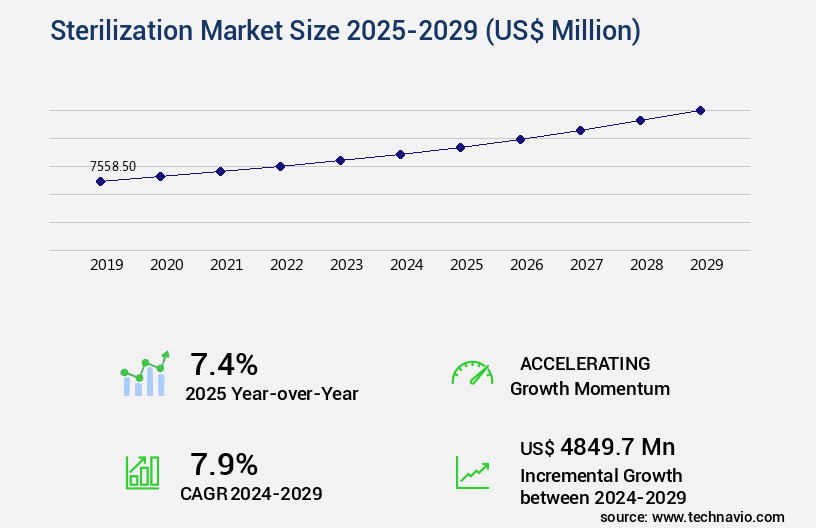
Sterilization Market Size 2025-2029
The sterilization market size is valued to increase USD 4.85 billion, at a CAGR of 7.9% from 2024 to 2029. Prevalence of hospital-acquired infections will drive the sterilization market.
Major Market Trends & Insights
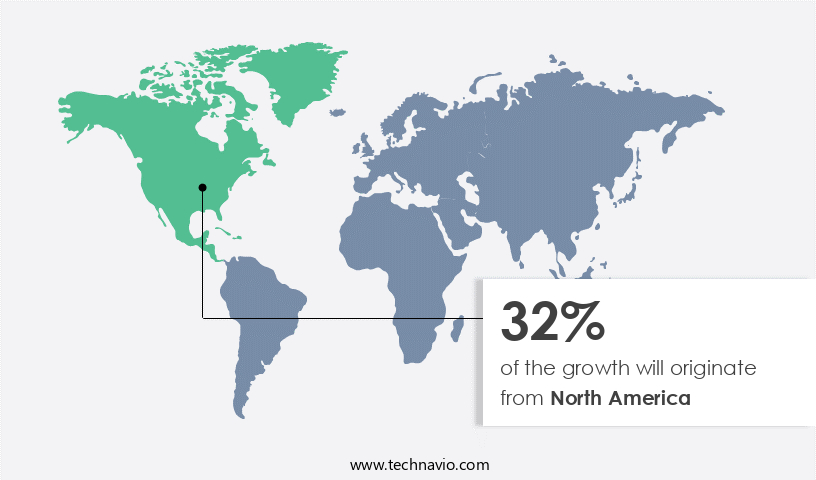
- North America dominated the market and accounted for a 32% growth during the forecast period.
- By Type - Chemical sterilization segment was valued at USD 3.32 billion in 2023
- By End-user - Hospitals and specialty clinics segment accounted for the largest market revenue share in 2023
Market Size & Forecast
- Market Opportunities: USD 103.30 million
- Market Future Opportunities: USD 4849.70 million
- CAGR from 2024 to 2029: 7.9%
Market Summary
- The market encompasses a critical segment of the healthcare industry, driven by the persistent threat of hospital-acquired infections. According to the World Health Organization, approximately 1.4 million patients in Europe and North America contract such infections each year, underscoring the market's significance. Advancements in technology have led to the increasing adoption of low-temperature sterilization methods, which offer advantages such as reduced energy consumption and minimal damage to heat-sensitive medical devices. This trend is expected to continue, as healthcare providers seek cost-effective and efficient sterilization solutions. Regulatory compliance and approval processes pose significant challenges to market participants. Stringent regulations ensure the safety and efficacy of sterilization technologies, but they also increase costs and complexities.
- Adhering to these guidelines is essential, as any deviation can lead to severe consequences, including patient harm and reputational damage. The market's evolution reflects the broader healthcare landscape, with a focus on innovation, cost containment, and patient safety. As technology continues to advance, we can anticipate further developments in sterilization methods, enabling more effective infection prevention and control.
What will be the Size of the Sterilization Market during the forecast period?
Get Key Insights on Market Forecast (PDF) Request Free Sample
How is the Sterilization Market Segmented?
The sterilization industry research report provides comprehensive data (region-wise segment analysis), with forecasts and estimates in "USD million" for the period 2025-2029, as well as historical data from 2019-2023 for the following segments.
- Type
- Chemical sterilization
- Radiation sterilization
- Others
- End-user
- Hospitals and specialty clinics
- Pharmaceuticals and medical device manufacturers
- Others
- Geography
- North America
- US
- Canada
- Europe
- France
- Germany
- Spain
- UK
- APAC
- China
- India
- Japan
- South Korea
- Rest of World (ROW)
- North America
By Type Insights
The chemical sterilization segment is estimated to witness significant growth during the forecast period.
The market encompasses a range of processes and technologies used to eliminate microorganisms from various industries, including medical devices, pharmaceuticals, and food processing. Key sterilization methods include hydrogen peroxide sterilization, gamma irradiation, sterile barrier systems, and decontamination methods using chemical indicators and biological indicators. Hydrogen peroxide sterilization, for instance, is a low-temperature process that utilizes high-pressure or steam to inactivate microbial loads. Another method, gamma irradiation, employs ionizing radiation to sterilize materials. Sterility testing, contamination control, and aseptic processing are crucial aspects of these processes, ensuring sterility assurance levels and maintaining quality control. For instance, dry heat sterilization and high-pressure sterilization are used to achieve sterility assurance levels of 10^-6, while low-temperature sterilization and steam sterilization can reach 10^-4.
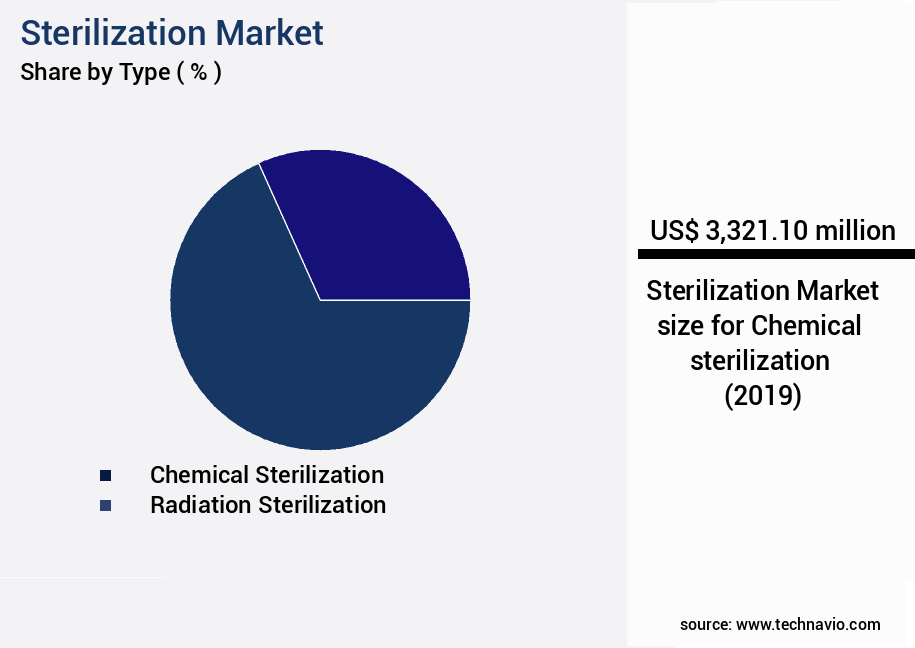
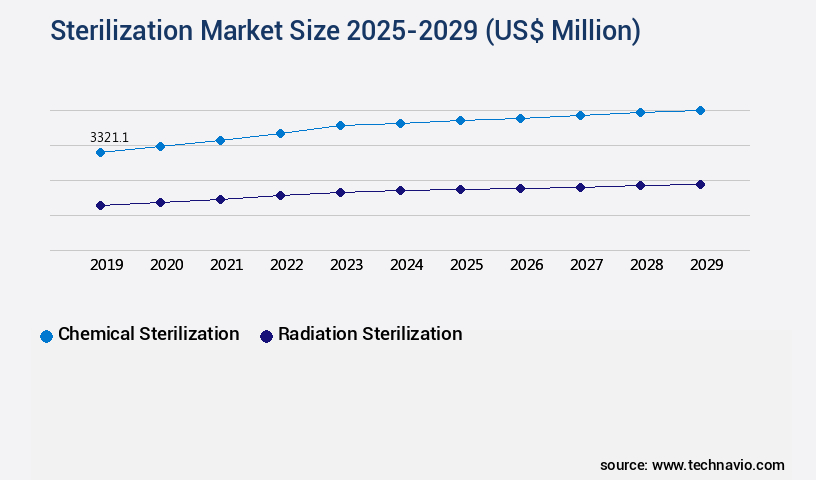
The Chemical sterilization segment was valued at USD 3.32 billion in 2019 and showed a gradual increase during the forecast period.
Industrial sterilization and medical device sterilization are significant applications, with pharmaceutical sterilization and cleaning validation playing essential roles in ensuring bioburden reduction. Notably, sterile packaging and sterile compounding are integral parts of the process, while filtration techniques and spore inactivation methods contribute to overall sterility. According to a study, the market is projected to reach a value of USD 41.5 billion by 2026, reflecting the market's continuous evolution and growing importance.
Regional Analysis
North America is estimated to contribute 32% to the growth of the global market during the forecast period. Technavio's analysts have elaborately explained the regional trends and drivers that shape the market during the forecast period.
See How Sterilization Market Demand is Rising in North America Request Free Sample
The market in North America is experiencing significant growth due to the extensive healthcare infrastructure and the high prevalence of hospital-acquired infections (HAIs). In 2023, there were approximately 6,100 hospitals in the United States and around 1,010 hospitals in Canada. The large number of healthcare facilities in these countries underscores the critical need for effective sterilization solutions to ensure patient safety and prevent infections. One of the major factors contributing to the market expansion in North America is the rising prevalence of HAIs. According to the Centers for Disease Control and Prevention (CDC), each day, about one in 31 US patients and one in 43 nursing home residents contract at least one infection associated with their healthcare.
These statistics highlight the importance of implementing advanced sterilization techniques to combat HAIs and maintain a hygienic environment in healthcare facilities. The adoption of automated sterilization systems and the increasing demand for sterilization services in various end-use industries, such as pharmaceuticals and food processing, further fuel the market growth. The integration of advanced technologies, such as UV-C light technology and steam sterilization, is also driving the market forward. The market in North America is poised for continued growth as the demand for reliable and efficient sterilization solutions increases.
Market Dynamics
Our researchers analyzed the data with 2024 as the base year, along with the key drivers, trends, and challenges. A holistic analysis of drivers will help companies refine their marketing strategies to gain a competitive advantage.
The market encompasses a broad range of technologies and processes designed to ensure the validation of sterilization processes for various industries, including pharmaceuticals, medical devices, and food and beverage. A critical aspect of sterilization is the inactivation of biological indicators, such as spores, to achieve a sterility assurance level (SAL) that meets regulatory requirements. Ethylene oxide sterilization is a commonly used method due to its effectiveness in penetrating porous materials and inactivating a wide range of microorganisms. However, the impact of sterilization parameters, such as temperature, pressure, and exposure time, on the effectiveness of ethylene oxide sterilization must be carefully monitored and controlled. Sterility testing methods comparison is essential to ensure the reliability and accuracy of results. Aseptic processing techniques validation and development of sterilization protocols are crucial to maintaining the integrity of sterile environments. The qualification of sterilization equipment and cleaning validation for sterile environments are also essential to prevent contamination and ensure regulatory compliance. Contamination control measures effectiveness, such as sterile barrier system integrity testing, are critical to maintaining a sterile environment throughout the sterilization process. Regulatory compliance for sterilization processes is paramount, and performance of sterilization equipment and process monitoring and data logging are essential components of maintaining compliance. Microbial load reduction methods, such as filtration and UV light, are often used in conjunction with sterilization processes to further reduce the risk of contamination. Sterile compounding aseptic techniques require stringent validation and optimization strategies to ensure the safety and efficacy of the final product. Sterilization cycle optimization strategies are essential to minimize cycle time while maintaining sterility assurance levels and ensuring the effectiveness of the sterilization process.
What are the key market drivers leading to the rise in the adoption of Sterilization Industry?
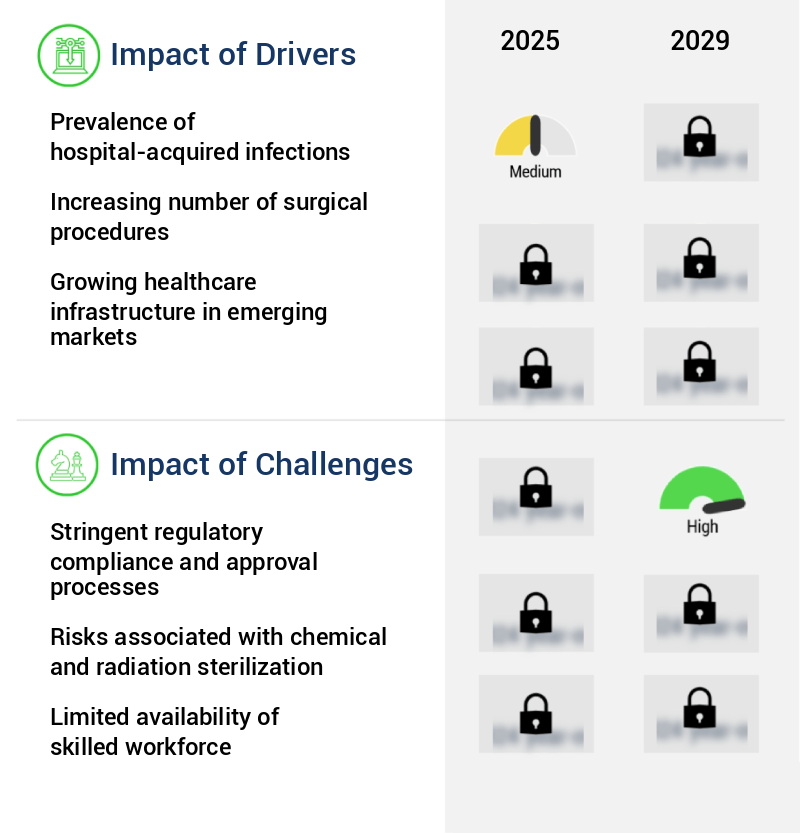
- The prevalence of hospital-acquired infections serves as the primary driver in the market's growth.
- The market is experiencing significant growth due to the increasing prevalence of hospital-acquired infections (HAIs). According to the World Health Organization (WHO), approximately 7% of patients in high-income countries and 15% in low- and middle-income countries contract an HAI during their hospital stay. Tragically, one in ten of these patients succumbs to these infections. This alarming statistic highlights the importance of effective sterilization solutions to ensure patient safety and reduce infection rates. The primary cause of HAIs is contaminated medical equipment and surgical instruments.
- The need for advanced sterilization technologies is more pressing than ever, with the global market expected to witness substantial expansion in response to this pressing healthcare concern.
What are the market trends shaping the Sterilization Industry?
- The increasing demand for low-temperature sterilization represents a significant market trend in the healthcare industry. Low-temperature sterilization is gaining popularity due to its numerous advantages over traditional sterilization methods.
- The market is undergoing a transformative phase, with a growing emphasis on low-temperature sterilization (LTS) solutions. Traditional high-temperature methods, such as autoclaving, face limitations in processing heat- and moisture-sensitive medical instruments, including advanced surgical tools like endoscopes, robotic-assisted surgical instruments, and electronic medical devices. In response, healthcare facilities are increasingly adopting LTS techniques, such as vaporized hydrogen peroxide (VH2O2), ethylene oxide (EtO), and ozone sterilization. These alternatives cater to the stringent infection control standards required in modern healthcare settings. Notably, the introduction of innovative LTS systems, like the Poladus 150 by Getinge, has accelerated market growth.
- Launched on June 3, 2024, this advanced VH2O2 sterilizer streamlines the reprocessing of non-lumen, flexible lumen, and rigid lumen instruments, addressing the escalating demand for sterilization in advanced endoscopic and robotic procedures.
What challenges does the Sterilization Industry face during its growth?
- The strict regulatory compliance and approval processes pose a significant challenge to the growth of the industry. Adhering to stringent regulations and securing necessary approvals are essential yet time-consuming and resource-intensive tasks that hinder industry expansion.
- The market is undergoing continuous evolution, driven by the increasing demand for infection prevention and patient safety in various sectors, including healthcare, pharmaceuticals, and food processing. According to recent studies, the market is projected to reach a significant value by 2026, growing at a steady pace due to the increasing adoption of advanced sterilization technologies. Regulatory agencies, such as the US Food and Drug Administration (FDA), the European Medicines Agency (EMA), the Centers for Disease Control and Prevention (CDC), and the International Organization for Standardization (ISO), have established stringent guidelines for sterilization equipment, consumables, and processes to ensure the highest levels of safety and efficacy.
- Compliance with these regulations is mandatory for manufacturers, healthcare facilities, and pharmaceutical companies. One of the primary regulatory requirements is adherence to Good Manufacturing Practices (GMP) and Sterility Assurance Levels (SALs), which ensure the production of sterile products and maintain the sterility of medical devices and biological products throughout their shelf life. The implementation of these regulations presents significant challenges, including increased costs, complex regulatory requirements, and the need for continuous process validation. Despite these challenges, the market continues to grow, driven by the increasing demand for safe and effective sterilization solutions.
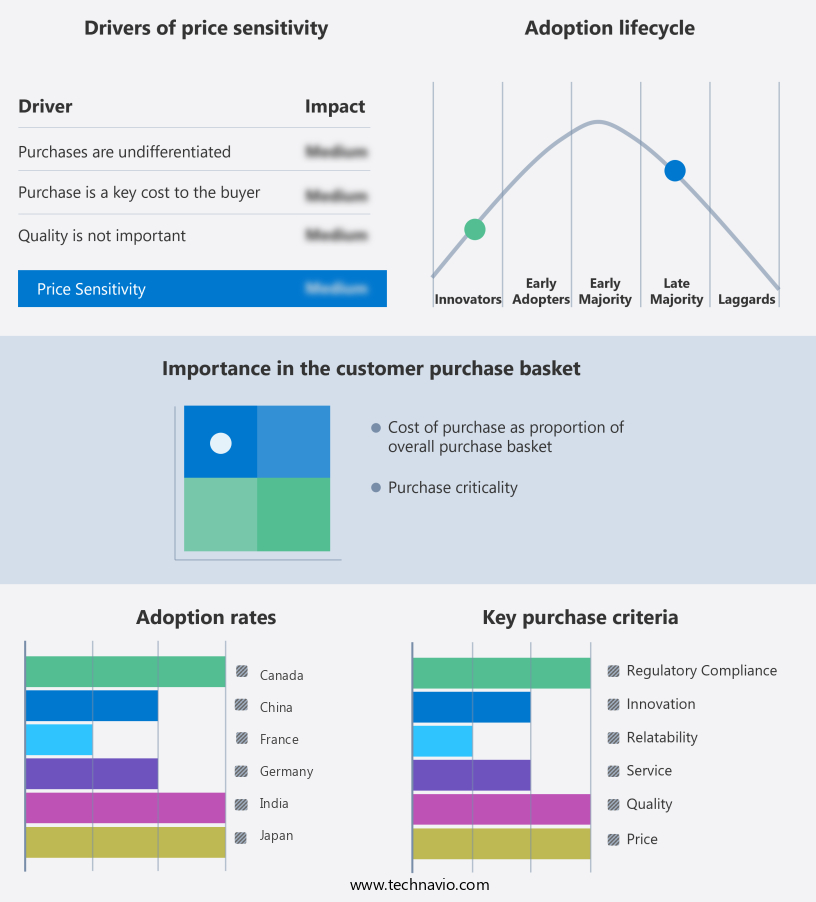
Exclusive Technavio Analysis on Customer Landscape
The sterilization market forecasting report includes the adoption lifecycle of the market, covering from the innovator's stage to the laggard's stage. It focuses on adoption rates in different regions based on penetration. Furthermore, the sterilization market report also includes key purchase criteria and drivers of price sensitivity to help companies evaluate and develop their market growth analysis strategies.
Customer Landscape of Sterilization Industry
Competitive Landscape
Companies are implementing various strategies, such as strategic alliances, sterilization market forecast, partnerships, mergers and acquisitions, geographical expansion, and product/service launches, to enhance their presence in the industry.
3M Co. - This company specializes in providing sterilization solutions, including 3M's Steri-Gas Cartridges 4-100, Model 400B Check Valve, and GS8 Door Gasket, among others.
The industry research and growth report includes detailed analyses of the competitive landscape of the market and information about key companies, including:
- 3M Co.
- Acmas Technologies Inc.
- Andersen Sterilizers
- ANTONIO MATACHANA SA
- Belimed AG
- Beta Star Life Science Equipment Inc.
- Cardinal Health Inc.
- Continental Equipment Co.
- Cosmed Group
- Fortive Corp.
- Getinge AB
- Johnson and Johnson
- MELAG Medizintechnik GmbH and Co. KG
- MMM Group
- Noxilizer Inc.
- STERIS plc
- Stryker Corp.
- Systec GmbH and Co. KG
- Tuttnauer
Qualitative and quantitative analysis of companies has been conducted to help clients understand the wider business environment as well as the strengths and weaknesses of key industry players. Data is qualitatively analyzed to categorize companies as pure play, category-focused, industry-focused, and diversified; it is quantitatively analyzed to categorize companies as dominant, leading, strong, tentative, and weak.
Recent Development and News in Sterilization Market
- In January 2024, Medtronic plc, a global healthcare solutions company, announced the FDA approval of its new SteriZone 720S Sterilizer, which uses ethylene oxide (EtO) sterilization technology to reduce cycle time and improve efficiency (Medtronic Press Release, 2024).
- In March 2024, STERIS plc, a leading provider of infection prevention solutions, entered into a strategic partnership with 3M to expand its offerings in the medical device reprocessing market. The collaboration aimed to combine STERIS's expertise in reprocessing and 3M's advanced contamination control technologies (STERIS Press Release, 2024).
- In May 2024, Thermo Fisher Scientific Inc. completed the acquisition of Patheon N.V., a leading provider of outsourced development and manufacturing services for sterile pharmaceutical and biologic products. The acquisition was valued at approximately USD 7.2 billion and expanded Thermo Fisher's capabilities in the market (Thermo Fisher Scientific Press Release, 2024).
- In February 2025, Getinge AB, a leading provider of medical technology and solutions, received FDA clearance for its new STERRAD X-10 Sterilizer, which uses a combination of hydrogen peroxide gas plasma sterilization and vacuum drying technology. The new sterilizer is expected to reduce cycle time and improve efficiency in the sterilization process (Getinge AB Press Release, 2025).
Dive into Technavio's robust research methodology, blending expert interviews, extensive data synthesis, and validated models for unparalleled Sterilization Market insights. See full methodology.
|
Market Scope |
|
|
Report Coverage |
Details |
|
Page number |
204 |
|
Base year |
2024 |
|
Historic period |
2019-2023 |
|
Forecast period |
2025-2029 |
|
Growth momentum & CAGR |
Accelerate at a CAGR of 7.9% |
|
Market growth 2025-2029 |
USD 4849.7 million |
|
Market structure |
Fragmented |
|
YoY growth 2024-2025(%) |
7.4 |
|
Key countries |
US, China, Germany, India, UK, Canada, France, Japan, South Korea, and Spain |
|
Competitive landscape |
Leading Companies, Market Positioning of Companies, Competitive Strategies, and Industry Risks |
Research Analyst Overview
- The market continues to evolve, driven by the persistent demand for regulatory compliance and contamination control in various sectors. Hydrogen peroxide sterilization and gamma irradiation are among the widely used sterilization methods, while plasma sterilization and low-temperature sterilization are gaining traction. Sterile barrier systems and filtration techniques play a crucial role in maintaining microbial load within acceptable limits. Process monitoring and sterility testing are essential components of contamination control, ensuring the sterility assurance level remains high. Gamma irradiation, for instance, has been reported to reduce bioburden by up to 9 log10 CFU/mL in medical device sterilization. The industry anticipates a growth of over 6% annually, fueled by the increasing need for sterilization in food processing, pharmaceutical, and industrial applications.
- Sterilization cycles and equipment qualification are integral to aseptic processing, ensuring the effectiveness of decontamination methods such as steam sterilization and ethylene oxide sterilization. Chemical indicators and biological indicators are used to validate cleaning validation and ensure the sterility of sterile compounding. Dry heat sterilization, high-pressure sterilization, and microbial inactivation are other essential sterilization techniques used in various industries. The ongoing unfolding of market activities reveals a continuous focus on improving sterilization processes and ensuring microbial load reduction. Quality control and bioburden reduction remain top priorities, with validation protocols and contamination control strategies being continually refined.
What are the Key Data Covered in this Sterilization Market Research and Growth Report?
-
What is the expected growth of the Sterilization Market between 2025 and 2029?
-
USD 4.85 billion, at a CAGR of 7.9%
-
-
What segmentation does the market report cover?
-
The report is segmented by Type (Chemical sterilization, Radiation sterilization, and Others), End-user (Hospitals and specialty clinics, Pharmaceuticals and medical device manufacturers, and Others), and Geography (North America, Europe, Asia, and Rest of World (ROW))
-
-
Which regions are analyzed in the report?
-
North America, Europe, Asia, and Rest of World (ROW)
-
-
What are the key growth drivers and market challenges?
-
Prevalence of hospital-acquired infections, Stringent regulatory compliance and approval processes
-
-
Who are the major players in the Sterilization Market?
-
3M Co., Acmas Technologies Inc., Andersen Sterilizers, ANTONIO MATACHANA SA, Belimed AG, Beta Star Life Science Equipment Inc., Cardinal Health Inc., Continental Equipment Co., Cosmed Group, Fortive Corp., Getinge AB, Johnson and Johnson, MELAG Medizintechnik GmbH and Co. KG, MMM Group, Noxilizer Inc., STERIS plc, Stryker Corp., Systec GmbH and Co. KG, and Tuttnauer
-
Market Research Insights
- The market for sterilization solutions continues to evolve, driven by the persistent demand for effective and efficient methods to ensure product sterility in various industries. Two key statistics highlight the market's growth and significance. First, the sterilization industry is projected to expand by approximately 5% annually, reflecting the increasing focus on maintaining high standards of hygiene and safety. Second, a notable example of market dynamics comes from the pharmaceutical sector, where sterilization failures can lead to costly recalls and potential health risks.
- In one instance, a company experienced a 30% increase in sales following the implementation of advanced sterilization technologies and improved monitoring systems. These solutions enabled the organization to enhance product sterility, maintain barrier integrity, and optimize processes, ultimately reducing contamination incidents.
We can help! Our analysts can customize this sterilization market research report to meet your requirements.
 RIA -
RIA - 
