Vacuum Truck Market Analysis, Size, and Forecast 2026-2030: North America (US, Canada, and Mexico), Europe (Germany, France, and UK), APAC (China, India, and Japan), South America (Brazil and Argentina), Middle East and Africa (Saudi Arabia, UAE, and South Africa), and Rest of World (ROW)

Vacuum Truck Market Analysis, Size, and Forecast 2026-2030:
North America (US, Canada, and Mexico), Europe (Germany, France, and UK), APAC (China, India, and Japan), South America (Brazil and Argentina), Middle East and Africa (Saudi Arabia, UAE, and South Africa), and Rest of World (ROW)

Published: Jan 2026 282 Pages SKU: IRTNTR74615

Market Overview at a Glance

$411.1 Mn
Market Opportunity
5.8%
CAGR 2025 - 2030
35.3%
North America Growth
$459.3 Mn
Industrial segment 2024

Vacuum Truck Market Size 2026-2030

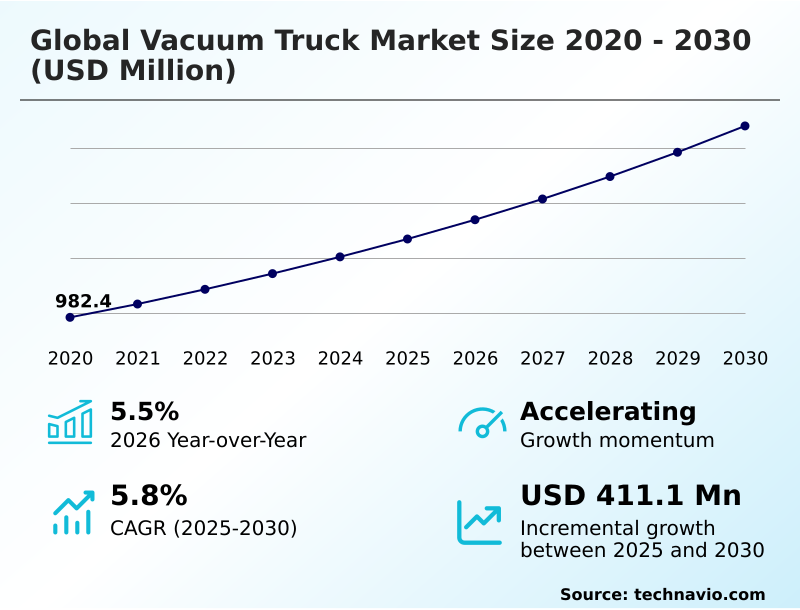
The vacuum truck market size is valued to increase by USD 411.1 million, at a CAGR of 5.8% from 2025 to 2030. Rising application of vacuum trucks in industrial cleaning will drive the vacuum truck market.

Major Market Trends & Insights

  • North America dominated the market and accounted for a 35.3% growth during the forecast period.
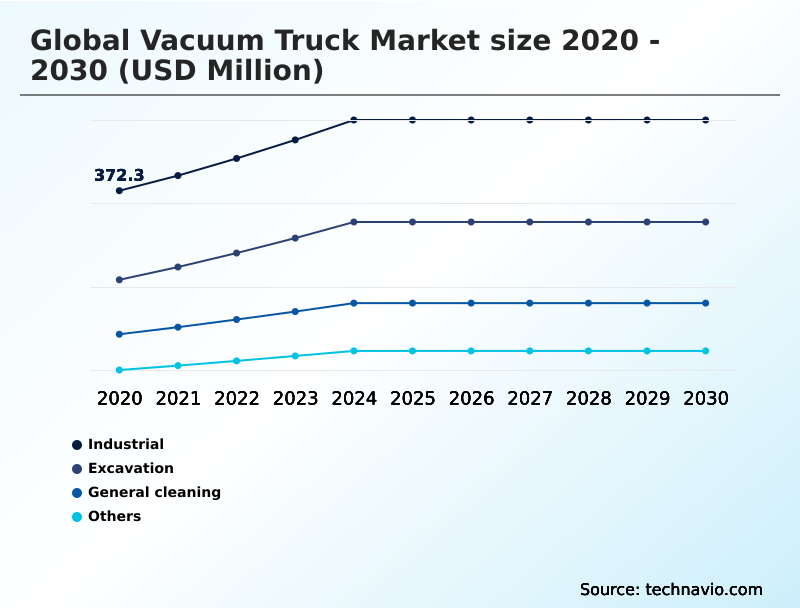
  • By Application - Industrial segment was valued at USD 459.3 million in 2024
  • By Product Type - Liquid and dry suctioning segment accounted for the largest market revenue share in 2024

Market Size & Forecast

  • Market Opportunities: USD 696 million
  • Market Future Opportunities: USD 411.1 million
  • CAGR from 2025 to 2030 : 5.8%

Market Summary

  • The vacuum truck market is evolving beyond simple waste collection, driven by stringent environmental regulations and the critical need for safe, efficient infrastructure management. Core applications like septic system cleaning and municipal infrastructure maintenance are now complemented by advanced industrial uses.
  • For instance, in the energy sector, hydro-excavation is now a standard for non-destructive digging around sensitive pipelines, a process mandated by safety protocols. This requires sophisticated equipment featuring a positive displacement blower and advanced wet dry vacuum solutions.
  • Concurrently, the push for operational intelligence is driving the adoption of telematics systems for remote diagnostics and preventive maintenance scheduling, enabling fleet managers to optimize asset utilization rates and reduce costly downtime. A scenario where an industrial plant leverages these systems for plant turnaround maintenance demonstrates the market's shift toward predictive, data-driven operations.
  • While challenges such as high operating costs persist, the integration of zero-emission collection vehicle technology and explosion-proof components for hazardous waste suction highlights a continuous focus on sustainability and safety, shaping the industry’s future trajectory.

What will be the Size of the Vacuum Truck Market during the forecast period?

Get Key Insights on Market Forecast (PDF) Request Free Sample

How is the Vacuum Truck Market Segmented?

The vacuum truck industry research report provides comprehensive data (region-wise segment analysis), with forecasts and estimates in "USD million" for the period 2026-2030, as well as historical data from 2020-2024 for the following segments.

  • Application
    • Industrial
    • Excavation
    • General cleaning
    • Others
  • Product type
    • Liquid and dry suctioning
    • Liquid suctioning only
  • Capacity
    • Medium
    • Small
    • Large
  • Geography
    • North America
      • US
      • Canada
      • Mexico
    • Europe
      • Germany
      • France
      • UK
    • APAC
      • China
      • India
      • Japan
    • South America
      • Brazil
      • Argentina
    • Middle East and Africa
      • Saudi Arabia
      • UAE
      • South Africa
    • Rest of World (ROW)

By Application Insights

The industrial segment is estimated to witness significant growth during the forecast period.

The industrial segment is defined by its critical reliance on specialized equipment for operational continuity and environmental compliance.

Industrial facilities depend on the industrial vacuum loader for essential tasks like industrial tank cleaning and removing materials from processing equipment, with wet dry vacuum solutions handling diverse waste streams.

The use of a positive displacement blower and advanced particulate matter filtration ensures efficient and safe removal during plant turnaround maintenance. This reliance highlights the segment's importance, where a breakdown can cause significant downtime.

Ensuring fleet operational efficiency through reliable equipment improves productivity by over 15% in continuous processing environments, making environmental cleaning and industrial fluid handling central to industrial strategy and a key driver of demand.

Request Free Sample

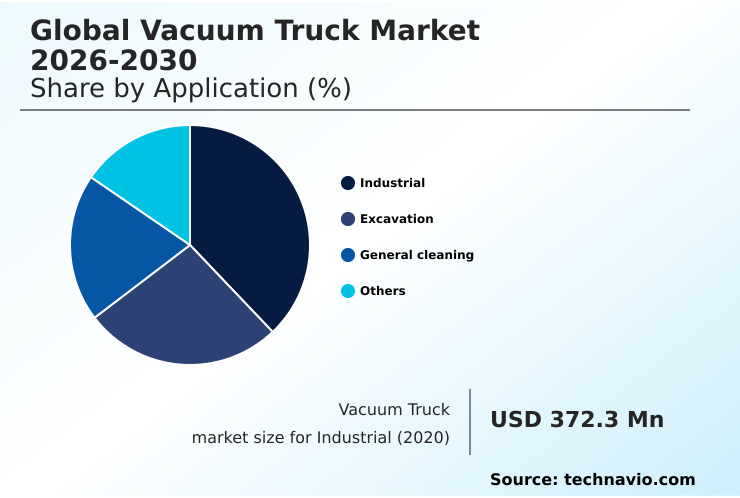
The Industrial segment was valued at USD 459.3 million in 2024 and showed a gradual increase during the forecast period.

Request Free Sample

Regional Analysis

North America is estimated to contribute 35.3% to the growth of the global market during the forecast period.Technavio’s analysts have elaborately explained the regional trends and drivers that shape the market during the forecast period.

See How Vacuum Truck Market Demand is Rising in North America Request Free Sample

The market's geographic landscape is led by North America, which accounts for over 35% of demand, driven by stringent environmental regulations and extensive municipal infrastructure maintenance projects. In this region, hydro-excavation services are standard for utility work.

Europe follows, with a strong focus on municipal waste handling and industrial applications. The APAC region, contributing nearly 23% of the market, is experiencing rapid growth due to industrialization and infrastructure development.

Here, demand for the sanitation vehicle and equipment for septic system cleaning is increasing.

The adoption of advanced pneumatic loading system technology is rising globally, with mature markets achieving up to a 15% greater operational uptime compared to regions relying on older equipment for sludge dewatering process.

hazardous waste suction is a globally recognized application.

Market Dynamics

Our researchers analyzed the data with 2025 as the base year, along with the key drivers, trends, and challenges. A holistic analysis of drivers will help companies refine their marketing strategies to gain a competitive advantage.

  • Strategic decision-making in the global vacuum truck market 2026-2030 requires a nuanced understanding of operational trade-offs and technological advancements. When evaluating a vacuum truck for oil and gas industry use, for instance, industrial vacuum loader safety standards compliance is non-negotiable, often mandating specialized equipment.
  • The debate over hydro-excavation vs traditional mechanical digging is largely settled in sensitive environments, where the key benefits of non-destructive digging methods far outweigh the higher initial cost. As the industry evolves, the electric vacuum truck operating cost comparison becomes increasingly relevant, especially for municipal fleets focused on total cost of ownership and emission reduction.
  • The selection between a positive displacement blower versus vacuum pump depends entirely on the application, whether it involves effective slurry and solids transport solutions or liquid-only tasks. Many operators are now analyzing whether renting vs buying industrial vacuum trucks offers better financial flexibility.
  • The choice of a compact vacuum truck for dense urban areas versus a larger model for industrial sites highlights the need for application-specific solutions. Furthermore, technological advancements in modern vacuum trucks, such as telematics integration for vacuum truck fleets and advanced filtration systems for vacuum trucks, are critical for optimizing performance.
  • For any operator, understanding municipal sewer cleaning truck performance specifications, septic tank pumping truck capacity requirements, and the impact of emission standards on vacuum trucks is fundamental to fleet management.
  • Ultimately, vacuum truck scheduled maintenance and repair protocols and robust vacuum truck operator training and certification are what differentiate top-performing fleets, with some achieving a 10% higher uptime than those with less rigorous programs.

What are the key market drivers leading to the rise in the adoption of Vacuum Truck Industry?

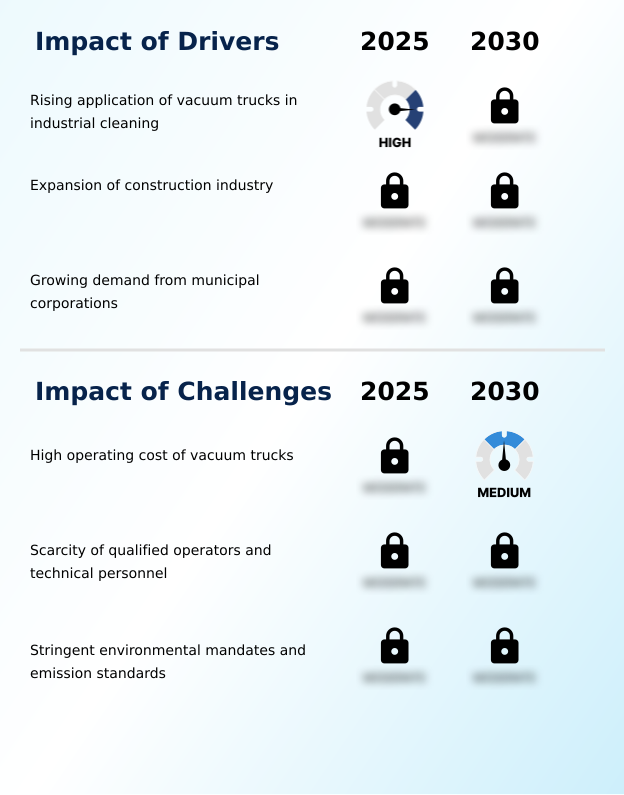
  • The increasing application of vacuum trucks for industrial cleaning, maintenance, and safety compliance is a primary driver for market growth.

  • Stringent regulations and the growing complexity of industrial cleaning applications are major drivers. Governments globally are tightening rules for environmental compliance, mandating the use of specialized vehicles for hazardous material collection and disposal.
  • This necessitates the use of explosion-proof components and advanced waste management technology. Consequently, demand for the sewer cleaner unit for sewer maintenance and hydro-excavators for subsurface utility engineering is rising.
  • For instance, companies adopting modern equipment report a 20% improvement in compliance documentation accuracy. The need for precise underground utility exposure without damage has made non-destructive digging a standard practice, further fueling market expansion.

What are the market trends shaping the Vacuum Truck Industry?

  • The emergence of electric vacuum trucks represents a significant upcoming trend, driven by global initiatives toward decarbonization and the demand for zero-emission vehicles in urban and industrial settings.

  • A key trend is the integration of advanced technologies to enhance performance and sustainability. The shift towards the zero-emission collection vehicle is gaining momentum, driven by corporate environmental goals and stricter urban regulations. Concurrently, onboard telematics systems are becoming standard, offering real-time remote diagnostics that improve preventive maintenance scheduling and reduce unplanned downtime by up to 25%.
  • These innovations support more efficient road cleaning operations and urban infrastructure rehabilitation. The development of superior vacuum pump technology also contributes, enabling quieter operation and lower energy consumption, which can decrease fuel costs by 10% in certain applications, thereby boosting overall asset utilization rates.

What challenges does the Vacuum Truck Industry face during its growth?

  • The high operating costs associated with fuel, maintenance, and specialized labor for vacuum trucks present a key challenge to market expansion and profitability.

  • High operational costs and a shortage of skilled labor present significant challenges. The expense of maintaining a heavy-duty chassis and specialized components like the baghouse filter is substantial. Furthermore, finding qualified personnel with expertise in pipeline inspection support and safe operation remains difficult, with some fleet managers reporting a 30% longer recruitment cycle for specialized roles.
  • These factors constrain profitability and limit expansion, especially for smaller operators. Even with tools for route planning optimization, high fuel consumption and repair costs can erode margins. The need for specialized training on operator safety features adds another layer of expense, affecting disaster cleanup and emergency spill response readiness.

Exclusive Technavio Analysis on Customer Landscape

The vacuum truck market forecasting report includes the adoption lifecycle of the market, covering from the innovator’s stage to the laggard’s stage. It focuses on adoption rates in different regions based on penetration. Furthermore, the vacuum truck market report also includes key purchase criteria and drivers of price sensitivity to help companies evaluate and develop their market growth analysis strategies.

Customer Landscape of Vacuum Truck Industry

Competitive Landscape

Companies are implementing various strategies, such as strategic alliances, vacuum truck market forecast, partnerships, mergers and acquisitions, geographical expansion, and product/service launches, to enhance their presence in the industry.

AFI Group - Provides specialized environmental solutions, including industrial vacuum loaders and sewer cleaners, essential for municipal and industrial maintenance operations.

The industry research and growth report includes detailed analyses of the competitive landscape of the market and information about key companies, including:

  • AFI Group
  • Alamo Group Inc.
  • Amphitec B.V.
  • Cappellotto S.p.A.
  • Chengli Special Automobile Co. Ltd.
  • DISAB Vacuum Technology AB
  • Federal Signal Corp.
  • Fulungma Group Co. Ltd.
  • GapVax Inc.
  • Hi Vac Corp.
  • Kanematsu Engineering Co. Ltd.
  • KOKS Group BV
  • Ledwell
  • RIVARD S.A.S
  • Sewer Equipment Co.
  • The Toro Co.
  • Tornado Global Hydrovacs Ltd.
  • Transway Systems Inc.
  • Vac Con Inc.

Qualitative and quantitative analysis of companies has been conducted to help clients understand the wider business environment as well as the strengths and weaknesses of key industry players. Data is qualitatively analyzed to categorize companies as pure play, category-focused, industry-focused, and diversified; it is quantitatively analyzed to categorize companies as dominant, leading, strong, tentative, and weak.

Recent Development and News in Vacuum truck market

  • In May 2025, Tornado Infrastructure Equipment Ltd. completed its acquisition of Custom Vacuum Services Ltd. for $28 million, expanding its manufacturing and service capabilities for truck-mounted and semi-trailer vacuum equipment across Canada's key industrial sectors.
  • In February 2025, Custom Truck One Source announced its showcase of the new Tornado F4 vacuum truck model at WWETT 2025, targeting sewer, hydro-excavation, and water infrastructure maintenance applications.
  • In October 2024, The Toro Co. announced an agreement to acquire Tornado Infrastructure Equipment Ltd., a strategic move to broaden its portfolio in the underground construction market with advanced vacuum truck technologies.
  • In September 2024, Supervac announced it would exhibit its latest custom-built mining vacuum trucks and wet/dry vacuum solutions at the CEN-CAN Expo 2025, targeting demanding mining and industrial cleanup environments.

Dive into Technavio’s robust research methodology, blending expert interviews, extensive data synthesis, and validated models for unparalleled Vacuum Truck Market insights. See full methodology.

Market Scope
Page number 282
Base year 2025
Historic period 2020-2024
Forecast period 2026-2030
Growth momentum & CAGR Accelerate at a CAGR of 5.8%
Market growth 2026-2030 USD 411.1 million
Market structure Fragmented
YoY growth 2025-2026(%) 5.5%
Key countries US, Canada, Mexico, Germany, France, UK, Italy, Spain, The Netherlands, China, India, Japan, South Korea, Australia, Indonesia, Brazil, Argentina, Chile, Saudi Arabia, UAE, South Africa, Egypt and Nigeria
Competitive landscape Leading Companies, Market Positioning of Companies, Competitive Strategies, and Industry Risks

Request Free Sample

Research Analyst Overview

  • The vacuum truck market is defined by its indispensable role in environmental services and infrastructure upkeep, where technological sophistication directly translates to operational value. The integration of a high-efficiency positive displacement blower, advanced particulate matter filtration, and robust wet dry vacuum solutions has become standard for modern fleets.
  • Core activities, from municipal infrastructure maintenance and septic system cleaning to complex industrial fluid handling, rely on this equipment. The push toward non-destructive digging through hydro-excavation has made subsurface utility engineering safer and more efficient, reducing utility strikes by over 40% in some projects.
  • At the boardroom level, investment decisions are increasingly influenced by the need for regulatory compliance and sustainability. This is driving adoption of the zero-emission collection vehicle and equipment with explosion-proof components for hazardous waste suction.
  • Furthermore, the deployment of telematics systems for remote diagnostics is no longer a luxury but a strategic necessity for managing the heavy-duty chassis and optimizing the entire lifecycle of a sanitation vehicle, sewer cleaner unit, or industrial vacuum loader. This strategic shift underscores the market's evolution from providing machinery to delivering integrated waste management technology and environmental cleaning solutions.

What are the Key Data Covered in this Vacuum Truck Market Research and Growth Report?

  • What is the expected growth of the Vacuum Truck Market between 2026 and 2030?

    • USD 411.1 million, at a CAGR of 5.8%

  • What segmentation does the market report cover?

    • The report is segmented by Application (Industrial, Excavation, General cleaning, and Others), Product Type (Liquid and dry suctioning, and Liquid suctioning only), Capacity (Medium, Small, and Large) and Geography (North America, Europe, APAC, South America, Middle East and Africa)

  • Which regions are analyzed in the report?

    • North America, Europe, APAC, South America and Middle East and Africa

  • What are the key growth drivers and market challenges?

    • Rising application of vacuum trucks in industrial cleaning, High operating cost of vacuum trucks

  • Who are the major players in the Vacuum Truck Market?

    • AFI Group, Alamo Group Inc., Amphitec B.V., Cappellotto S.p.A., Chengli Special Automobile Co. Ltd., DISAB Vacuum Technology AB, Federal Signal Corp., Fulungma Group Co. Ltd., GapVax Inc., Hi Vac Corp., Kanematsu Engineering Co. Ltd., KOKS Group BV, Ledwell, RIVARD S.A.S, Sewer Equipment Co., The Toro Co., Tornado Global Hydrovacs Ltd., Transway Systems Inc. and Vac Con Inc.

Market Research Insights

  • Market dynamics are shaped by a push for greater fleet operational efficiency and stricter environmental compliance. The adoption of advanced systems improves asset utilization rates by over 20% in some fleets, while integrated route planning optimization tools can reduce fuel consumption by up to 15%.
  • Demand is strong for specialized hydro-excavation services and industrial cleaning applications, driven by the need for safe underground utility exposure and plant turnaround maintenance. Consequently, operator safety features and reliable preventive maintenance scheduling have become key differentiators for equipment providers.
  • The focus on urban infrastructure rehabilitation and municipal waste handling ensures steady demand, while the industry's ability to support emergency spill response underscores its critical role in risk management.

We can help! Our analysts can customize this vacuum truck market research report to meet your requirements.

Get in touch

1. Executive Summary

1.1 Market overview

Executive Summary - Chart on Market Overview
Executive Summary - Data Table on Market Overview
Executive Summary - Chart on Global Market Characteristics
Executive Summary - Chart on Market by Geography
Executive Summary - Chart on Market Segmentation by Application
Executive Summary - Chart on Market Segmentation by Product Type
Executive Summary - Chart on Market Segmentation by Capacity
Executive Summary - Chart on Incremental Growth
Executive Summary - Data Table on Incremental Growth
Executive Summary - Chart on Company Market Positioning

2. Technavio Analysis

2.1 Analysis of price sensitivity, lifecycle, customer purchase basket, adoption rates, and purchase criteria

2.2 Criticality of inputs and Factors of differentiation

Chart on Overview on criticality of inputs and factors of differentiation

2.3 Factors of disruption

Chart on Overview on factors of disruption

2.4 Impact of drivers and challenges

Chart on Impact of drivers and challenges in 2025 and 2030

3. Market Landscape

3.1 Market ecosystem

Chart on Parent Market
Data Table on - Parent Market

3.2 Market characteristics

Chart on Market characteristics analysis

3.3 Value chain analysis

Chart on Value chain analysis

4. Market Sizing

4.1 Market definition

Data Table on Offerings of companies included in the market definition

4.2 Market segment analysis

Market segments

4.3 Market size 2025

4.4 Market outlook: Forecast for 2025-2030

Chart on Global - Market size and forecast 2025-2030 ($ million)
Data Table on Global - Market size and forecast 2025-2030 ($ million)
Chart on Global Market: Year-over-year growth 2025-2030 (%)
Data Table on Global Market: Year-over-year growth 2025-2030 (%)

5. Historic Market Size

5.1 Global Vacuum Truck Market 2020 - 2024

Historic Market Size - Data Table on Global Vacuum Truck Market 2020 - 2024 ($ million)

5.2 Application segment analysis 2020 - 2024

Historic Market Size - Application Segment 2020 - 2024 ($ million)

5.3 Product Type segment analysis 2020 - 2024

Historic Market Size - Product Type Segment 2020 - 2024 ($ million)

5.4 Capacity segment analysis 2020 - 2024

Historic Market Size - Capacity Segment 2020 - 2024 ($ million)

5.5 Geography segment analysis 2020 - 2024

Historic Market Size - Geography Segment 2020 - 2024 ($ million)

5.6 Country segment analysis 2020 - 2024

Historic Market Size - Country Segment 2020 - 2024 ($ million)

6. Qualitative Analysis

6.1 Impact of AI on global vacuum truck market

7. Five Forces Analysis

7.1 Five forces summary

Five forces analysis - Comparison between 2025 and 2030

7.2 Bargaining power of buyers

Bargaining power of buyers - Impact of key factors 2025 and 2030

7.3 Bargaining power of suppliers

Bargaining power of suppliers - Impact of key factors in 2025 and 2030

7.4 Threat of new entrants

Threat of new entrants - Impact of key factors in 2025 and 2030

7.5 Threat of substitutes

Threat of substitutes - Impact of key factors in 2025 and 2030

7.6 Threat of rivalry

Threat of rivalry - Impact of key factors in 2025 and 2030

7.7 Market condition

Chart on Market condition - Five forces 2025 and 2030

8. Market Segmentation by Application

8.1 Market segments

Chart on Application - Market share 2025-2030 (%)
Data Table on Application - Market share 2025-2030 (%)

8.2 Comparison by Application

Chart on Comparison by Application
Data Table on Comparison by Application

8.3 Industrial - Market size and forecast 2025-2030

Chart on Industrial - Market size and forecast 2025-2030 ($ million)
Data Table on Industrial - Market size and forecast 2025-2030 ($ million)
Chart on Industrial - Year-over-year growth 2025-2030 (%)
Data Table on Industrial - Year-over-year growth 2025-2030 (%)

8.4 Excavation - Market size and forecast 2025-2030

Chart on Excavation - Market size and forecast 2025-2030 ($ million)
Data Table on Excavation - Market size and forecast 2025-2030 ($ million)
Chart on Excavation - Year-over-year growth 2025-2030 (%)
Data Table on Excavation - Year-over-year growth 2025-2030 (%)

8.5 General cleaning - Market size and forecast 2025-2030

Chart on General cleaning - Market size and forecast 2025-2030 ($ million)
Data Table on General cleaning - Market size and forecast 2025-2030 ($ million)
Chart on General cleaning - Year-over-year growth 2025-2030 (%)
Data Table on General cleaning - Year-over-year growth 2025-2030 (%)

8.6 Others - Market size and forecast 2025-2030

Chart on Others - Market size and forecast 2025-2030 ($ million)
Data Table on Others - Market size and forecast 2025-2030 ($ million)
Chart on Others - Year-over-year growth 2025-2030 (%)
Data Table on Others - Year-over-year growth 2025-2030 (%)

8.7 Market opportunity by Application

Market opportunity by Application ($ million)
Data Table on Market opportunity by Application ($ million)

9. Market Segmentation by Product Type

9.1 Market segments

Chart on Product Type - Market share 2025-2030 (%)
Data Table on Product Type - Market share 2025-2030 (%)

9.2 Comparison by Product Type

Chart on Comparison by Product Type
Data Table on Comparison by Product Type

9.3 Liquid and dry suctioning - Market size and forecast 2025-2030

Chart on Liquid and dry suctioning - Market size and forecast 2025-2030 ($ million)
Data Table on Liquid and dry suctioning - Market size and forecast 2025-2030 ($ million)
Chart on Liquid and dry suctioning - Year-over-year growth 2025-2030 (%)
Data Table on Liquid and dry suctioning - Year-over-year growth 2025-2030 (%)

9.4 Liquid suctioning only - Market size and forecast 2025-2030

Chart on Liquid suctioning only - Market size and forecast 2025-2030 ($ million)
Data Table on Liquid suctioning only - Market size and forecast 2025-2030 ($ million)
Chart on Liquid suctioning only - Year-over-year growth 2025-2030 (%)
Data Table on Liquid suctioning only - Year-over-year growth 2025-2030 (%)

9.5 Market opportunity by Product Type

Market opportunity by Product Type ($ million)
Data Table on Market opportunity by Product Type ($ million)

10. Market Segmentation by Capacity

10.1 Market segments

Chart on Capacity - Market share 2025-2030 (%)
Data Table on Capacity - Market share 2025-2030 (%)

10.2 Comparison by Capacity

Chart on Comparison by Capacity
Data Table on Comparison by Capacity

10.3 Medium - Market size and forecast 2025-2030

Chart on Medium - Market size and forecast 2025-2030 ($ million)
Data Table on Medium - Market size and forecast 2025-2030 ($ million)
Chart on Medium - Year-over-year growth 2025-2030 (%)
Data Table on Medium - Year-over-year growth 2025-2030 (%)

10.4 Small - Market size and forecast 2025-2030

Chart on Small - Market size and forecast 2025-2030 ($ million)
Data Table on Small - Market size and forecast 2025-2030 ($ million)
Chart on Small - Year-over-year growth 2025-2030 (%)
Data Table on Small - Year-over-year growth 2025-2030 (%)

10.5 Large - Market size and forecast 2025-2030

Chart on Large - Market size and forecast 2025-2030 ($ million)
Data Table on Large - Market size and forecast 2025-2030 ($ million)
Chart on Large - Year-over-year growth 2025-2030 (%)
Data Table on Large - Year-over-year growth 2025-2030 (%)

10.6 Market opportunity by Capacity

Market opportunity by Capacity ($ million)
Data Table on Market opportunity by Capacity ($ million)

11. Customer Landscape

11.1 Customer landscape overview

Analysis of price sensitivity, lifecycle, customer purchase basket, adoption rates, and purchase criteria

12. Geographic Landscape

12.1 Geographic segmentation

Chart on Market share by geography 2025-2030 (%)
Data Table on Market share by geography 2025-2030 (%)

12.2 Geographic comparison

Chart on Geographic comparison
Data Table on Geographic comparison

12.3 North America - Market size and forecast 2025-2030

Chart on North America - Market size and forecast 2025-2030 ($ million)
Data Table on North America - Market size and forecast 2025-2030 ($ million)
Chart on North America - Year-over-year growth 2025-2030 (%)
Data Table on North America - Year-over-year growth 2025-2030 (%)
Chart on Regional Comparison - North America
Data Table on Regional Comparison - North America

12.3.1 US - Market size and forecast 2025-2030

Chart on US - Market size and forecast 2025-2030 ($ million)
Data Table on US - Market size and forecast 2025-2030 ($ million)
Chart on US - Year-over-year growth 2025-2030 (%)
Data Table on US - Year-over-year growth 2025-2030 (%)

12.3.2 Canada - Market size and forecast 2025-2030

Chart on Canada - Market size and forecast 2025-2030 ($ million)
Data Table on Canada - Market size and forecast 2025-2030 ($ million)
Chart on Canada - Year-over-year growth 2025-2030 (%)
Data Table on Canada - Year-over-year growth 2025-2030 (%)

12.3.3 Mexico - Market size and forecast 2025-2030

Chart on Mexico - Market size and forecast 2025-2030 ($ million)
Data Table on Mexico - Market size and forecast 2025-2030 ($ million)
Chart on Mexico - Year-over-year growth 2025-2030 (%)
Data Table on Mexico - Year-over-year growth 2025-2030 (%)

12.4 Europe - Market size and forecast 2025-2030

Chart on Europe - Market size and forecast 2025-2030 ($ million)
Data Table on Europe - Market size and forecast 2025-2030 ($ million)
Chart on Europe - Year-over-year growth 2025-2030 (%)
Data Table on Europe - Year-over-year growth 2025-2030 (%)
Chart on Regional Comparison - Europe
Data Table on Regional Comparison - Europe

12.4.1 Germany - Market size and forecast 2025-2030

Chart on Germany - Market size and forecast 2025-2030 ($ million)
Data Table on Germany - Market size and forecast 2025-2030 ($ million)
Chart on Germany - Year-over-year growth 2025-2030 (%)
Data Table on Germany - Year-over-year growth 2025-2030 (%)

12.4.2 France - Market size and forecast 2025-2030

Chart on France - Market size and forecast 2025-2030 ($ million)
Data Table on France - Market size and forecast 2025-2030 ($ million)
Chart on France - Year-over-year growth 2025-2030 (%)
Data Table on France - Year-over-year growth 2025-2030 (%)

12.4.3 UK - Market size and forecast 2025-2030

Chart on UK - Market size and forecast 2025-2030 ($ million)
Data Table on UK - Market size and forecast 2025-2030 ($ million)
Chart on UK - Year-over-year growth 2025-2030 (%)
Data Table on UK - Year-over-year growth 2025-2030 (%)

12.4.4 Italy - Market size and forecast 2025-2030

Chart on Italy - Market size and forecast 2025-2030 ($ million)
Data Table on Italy - Market size and forecast 2025-2030 ($ million)
Chart on Italy - Year-over-year growth 2025-2030 (%)
Data Table on Italy - Year-over-year growth 2025-2030 (%)

12.4.5 Spain - Market size and forecast 2025-2030

Chart on Spain - Market size and forecast 2025-2030 ($ million)
Data Table on Spain - Market size and forecast 2025-2030 ($ million)
Chart on Spain - Year-over-year growth 2025-2030 (%)
Data Table on Spain - Year-over-year growth 2025-2030 (%)

12.4.6 The Netherlands - Market size and forecast 2025-2030

Chart on The Netherlands - Market size and forecast 2025-2030 ($ million)
Data Table on The Netherlands - Market size and forecast 2025-2030 ($ million)
Chart on The Netherlands - Year-over-year growth 2025-2030 (%)
Data Table on The Netherlands - Year-over-year growth 2025-2030 (%)

12.5 APAC - Market size and forecast 2025-2030

Chart on APAC - Market size and forecast 2025-2030 ($ million)
Data Table on APAC - Market size and forecast 2025-2030 ($ million)
Chart on APAC - Year-over-year growth 2025-2030 (%)
Data Table on APAC - Year-over-year growth 2025-2030 (%)
Chart on Regional Comparison - APAC
Data Table on Regional Comparison - APAC

12.5.1 China - Market size and forecast 2025-2030

Chart on China - Market size and forecast 2025-2030 ($ million)
Data Table on China - Market size and forecast 2025-2030 ($ million)
Chart on China - Year-over-year growth 2025-2030 (%)
Data Table on China - Year-over-year growth 2025-2030 (%)

12.5.2 India - Market size and forecast 2025-2030

Chart on India - Market size and forecast 2025-2030 ($ million)
Data Table on India - Market size and forecast 2025-2030 ($ million)
Chart on India - Year-over-year growth 2025-2030 (%)
Data Table on India - Year-over-year growth 2025-2030 (%)

12.5.3 Japan - Market size and forecast 2025-2030

Chart on Japan - Market size and forecast 2025-2030 ($ million)
Data Table on Japan - Market size and forecast 2025-2030 ($ million)
Chart on Japan - Year-over-year growth 2025-2030 (%)
Data Table on Japan - Year-over-year growth 2025-2030 (%)

12.5.4 South Korea - Market size and forecast 2025-2030

Chart on South Korea - Market size and forecast 2025-2030 ($ million)
Data Table on South Korea - Market size and forecast 2025-2030 ($ million)
Chart on South Korea - Year-over-year growth 2025-2030 (%)
Data Table on South Korea - Year-over-year growth 2025-2030 (%)

12.5.5 Australia - Market size and forecast 2025-2030

Chart on Australia - Market size and forecast 2025-2030 ($ million)
Data Table on Australia - Market size and forecast 2025-2030 ($ million)
Chart on Australia - Year-over-year growth 2025-2030 (%)
Data Table on Australia - Year-over-year growth 2025-2030 (%)

12.5.6 Indonesia - Market size and forecast 2025-2030

Chart on Indonesia - Market size and forecast 2025-2030 ($ million)
Data Table on Indonesia - Market size and forecast 2025-2030 ($ million)
Chart on Indonesia - Year-over-year growth 2025-2030 (%)
Data Table on Indonesia - Year-over-year growth 2025-2030 (%)

12.6 South America - Market size and forecast 2025-2030

Chart on South America - Market size and forecast 2025-2030 ($ million)
Data Table on South America - Market size and forecast 2025-2030 ($ million)
Chart on South America - Year-over-year growth 2025-2030 (%)
Data Table on South America - Year-over-year growth 2025-2030 (%)
Chart on Regional Comparison - South America
Data Table on Regional Comparison - South America

12.6.1 Brazil - Market size and forecast 2025-2030

Chart on Brazil - Market size and forecast 2025-2030 ($ million)
Data Table on Brazil - Market size and forecast 2025-2030 ($ million)
Chart on Brazil - Year-over-year growth 2025-2030 (%)
Data Table on Brazil - Year-over-year growth 2025-2030 (%)

12.6.2 Argentina - Market size and forecast 2025-2030

Chart on Argentina - Market size and forecast 2025-2030 ($ million)
Data Table on Argentina - Market size and forecast 2025-2030 ($ million)
Chart on Argentina - Year-over-year growth 2025-2030 (%)
Data Table on Argentina - Year-over-year growth 2025-2030 (%)

12.6.3 Chile - Market size and forecast 2025-2030

Chart on Chile - Market size and forecast 2025-2030 ($ million)
Data Table on Chile - Market size and forecast 2025-2030 ($ million)
Chart on Chile - Year-over-year growth 2025-2030 (%)
Data Table on Chile - Year-over-year growth 2025-2030 (%)

12.7 Middle East and Africa - Market size and forecast 2025-2030

Chart on Middle East and Africa - Market size and forecast 2025-2030 ($ million)
Data Table on Middle East and Africa - Market size and forecast 2025-2030 ($ million)
Chart on Middle East and Africa - Year-over-year growth 2025-2030 (%)
Data Table on Middle East and Africa - Year-over-year growth 2025-2030 (%)
Chart on Regional Comparison - Middle East and Africa
Data Table on Regional Comparison - Middle East and Africa

12.7.1 Saudi Arabia - Market size and forecast 2025-2030

Chart on Saudi Arabia - Market size and forecast 2025-2030 ($ million)
Data Table on Saudi Arabia - Market size and forecast 2025-2030 ($ million)
Chart on Saudi Arabia - Year-over-year growth 2025-2030 (%)
Data Table on Saudi Arabia - Year-over-year growth 2025-2030 (%)

12.7.2 UAE - Market size and forecast 2025-2030

Chart on UAE - Market size and forecast 2025-2030 ($ million)
Data Table on UAE - Market size and forecast 2025-2030 ($ million)
Chart on UAE - Year-over-year growth 2025-2030 (%)
Data Table on UAE - Year-over-year growth 2025-2030 (%)

12.7.3 South Africa - Market size and forecast 2025-2030

Chart on South Africa - Market size and forecast 2025-2030 ($ million)
Data Table on South Africa - Market size and forecast 2025-2030 ($ million)
Chart on South Africa - Year-over-year growth 2025-2030 (%)
Data Table on South Africa - Year-over-year growth 2025-2030 (%)

12.7.4 Egypt - Market size and forecast 2025-2030

Chart on Egypt - Market size and forecast 2025-2030 ($ million)
Data Table on Egypt - Market size and forecast 2025-2030 ($ million)
Chart on Egypt - Year-over-year growth 2025-2030 (%)
Data Table on Egypt - Year-over-year growth 2025-2030 (%)

12.7.5 Nigeria - Market size and forecast 2025-2030

Chart on Nigeria - Market size and forecast 2025-2030 ($ million)
Data Table on Nigeria - Market size and forecast 2025-2030 ($ million)
Chart on Nigeria - Year-over-year growth 2025-2030 (%)
Data Table on Nigeria - Year-over-year growth 2025-2030 (%)

12.8 Market opportunity by geography

Market opportunity by geography ($ million)
Data Tables on Market opportunity by geography ($ million)

13. Drivers, Challenges, and Opportunity

13.1 Market drivers

Rising application of vacuum trucks in industrial cleaning
Expansion of construction industry
Growing demand from municipal corporations

13.2 Market challenges

High operating cost of vacuum trucks
Scarcity of qualified operators and technical personnel
Stringent environmental mandates and emission standards

13.3 Impact of drivers and challenges

Impact of drivers and challenges in 2025 and 2030

13.4 Market opportunities

Advent of electric vacuum truck
Rising environmental awareness
Technological advancements in vacuum trucks

14. Competitive Landscape

14.1 Overview

14.2

Overview on criticality of inputs and factors of differentiation

14.3 Landscape disruption

Overview on factors of disruption

14.4 Industry risks

Impact of key risks on business

15. Competitive Analysis

15.1 Companies profiled

Companies covered

15.2 Company ranking index

15.3 Market positioning of companies

Matrix on companies position and classification

15.4 Alamo Group Inc.

Alamo Group Inc. - Overview
Alamo Group Inc. - Business segments
Alamo Group Inc. - Key news
Alamo Group Inc. - Key offerings
Alamo Group Inc. - Segment focus
SWOT

15.5 Amphitec B.V.

Amphitec B.V. - Overview
Amphitec B.V. - Product / Service
Amphitec B.V. - Key offerings
SWOT

15.6 Cappellotto S.p.A.

Cappellotto S.p.A. - Overview
Cappellotto S.p.A. - Product / Service
Cappellotto S.p.A. - Key offerings
SWOT

15.7 Chengli Special Automobile Co. Ltd.

Chengli Special Automobile Co. Ltd. - Overview
Chengli Special Automobile Co. Ltd. - Product / Service
Chengli Special Automobile Co. Ltd. - Key offerings
SWOT

15.8 DISAB Vacuum Technology AB

DISAB Vacuum Technology AB - Overview
DISAB Vacuum Technology AB - Product / Service
DISAB Vacuum Technology AB - Key offerings
SWOT

15.9 Federal Signal Corp.

Federal Signal Corp. - Overview
Federal Signal Corp. - Business segments
Federal Signal Corp. - Key offerings
Federal Signal Corp. - Segment focus
SWOT

15.10 Fulungma Group Co. Ltd.

Fulungma Group Co. Ltd. - Overview
Fulungma Group Co. Ltd. - Product / Service
Fulungma Group Co. Ltd. - Key offerings
SWOT

15.11 GapVax Inc.

GapVax Inc. - Overview
GapVax Inc. - Product / Service
GapVax Inc. - Key offerings
SWOT

15.12 Hi Vac Corp.

Hi Vac Corp. - Overview
Hi Vac Corp. - Product / Service
Hi Vac Corp. - Key offerings
SWOT

15.13 KOKS Group BV

KOKS Group BV - Overview
KOKS Group BV - Product / Service
KOKS Group BV - Key offerings
SWOT

15.14 Ledwell

Ledwell - Overview
Ledwell - Product / Service
Ledwell - Key offerings
SWOT

15.15 RIVARD S.A.S

RIVARD S.A.S - Overview
RIVARD S.A.S - Product / Service
RIVARD S.A.S - Key offerings
SWOT

15.16 Sewer Equipment Co.

Sewer Equipment Co. - Overview
Sewer Equipment Co. - Product / Service
Sewer Equipment Co. - Key offerings
SWOT

15.17 The Toro Co.

The Toro Co. - Overview
The Toro Co. - Business segments
The Toro Co. - Key news
The Toro Co. - Key offerings
The Toro Co. - Segment focus
SWOT

15.18 Vac Con Inc.

Vac Con Inc. - Overview
Vac Con Inc. - Product / Service
Vac Con Inc. - Key offerings
SWOT

16. Appendix

16.1 Scope of the report

Market definition
Objectives
Notes and caveats

16.2 Inclusions and exclusions checklist

Inclusions checklist
Exclusions checklist

16.3 Currency conversion rates for US$

16.4 Research methodology

16.5 Data procurement

Information sources

16.6 Data validation

16.7 Validation techniques employed for market sizing

16.8 Data synthesis

16.9 360 degree market analysis

16.10 List of abbreviations

Research Methodology

Technavio presents a detailed picture of the market by way of study, synthesis, and summation of data from multiple sources. The analysts have presented the various facets of the market with a particular focus on identifying the key industry influencers. The data thus presented is comprehensive, reliable, and the result of extensive research, both primary and secondary.

INFORMATION SOURCES

Primary sources

  • Manufacturers and suppliers
  • Channel partners
  • Industry experts
  • Strategic decision makers

Secondary sources

  • Industry journals and periodicals
  • Government data
  • Financial reports of key industry players
  • Historical data
  • Press releases

DATA ANALYSIS

Data Synthesis

  • Collation of data
  • Estimation of key figures
  • Analysis of derived insights

Data Validation

  • Triangulation with data models
  • Reference against proprietary databases
  • Corroboration with industry experts

REPORT WRITING

Qualitative

  • Market drivers
  • Market challenges
  • Market trends
  • Five forces analysis

Quantitative

  • Market size and forecast
  • Market segmentation
  • Geographical insights
  • Competitive landscape

Interested in this report?

Get your sample now to see our research methodology and insights!

Download Now

Frequently Asked Questions

Vacuum Truck market growth will increase by USD 411.1 million during 2026-2030.

The Vacuum Truck market is expected to grow at a CAGR of 5.8% during 2026-2030.

Vacuum Truck market is segmented by Application (Industrial, Excavation, General cleaning, Others) Product type (Liquid and dry suctioning, Liquid suctioning only) Capacity (Medium, Small, Large)

AFI Group, Alamo Group Inc., Amphitec B.V., Cappellotto S.p.A., Chengli Special Automobile Co. Ltd., DISAB Vacuum Technology AB, Federal Signal Corp., Fulungma Group Co. Ltd., GapVax Inc., Hi Vac Corp., Kanematsu Engineering Co. Ltd., KOKS Group BV, Ledwell, RIVARD S.A.S, Sewer Equipment Co., The Toro Co., Tornado Global Hydrovacs Ltd., Transway Systems Inc., Vac Con Inc. are a few of the key vendors in the Vacuum Truck market.

North America will register the highest growth rate of 35.3% among the other regions. Therefore, the Vacuum Truck market in North America is expected to garner significant business opportunities for the vendors during the forecast period.

US, Canada, Mexico, Germany, France, UK, Italy, Spain, The Netherlands, China, India, Japan, South Korea, Australia, Indonesia, Brazil, Argentina, Chile, Saudi Arabia, UAE, South Africa, Egypt, Nigeria

  • Rising application of vacuum trucks in industrial cleaning is the driving factor this market.

The Vacuum Truck market vendors should focus on grabbing business opportunities from the Application segment as it accounted for the largest market share in the base year.