Varicose Vein Treatment Devices Market Analysis, Size, and Forecast 2026-2030: North America (US, Canada, and Mexico), Europe (Germany, UK, and France), Asia (China, India, and Japan), South America (Brazil), Middle East and Africa (UAE, South Africa, and Saudi Arabia), Rest of World (ROW)

Varicose Vein Treatment Devices Market Analysis, Size, and Forecast 2026-2030:
North America (US, Canada, and Mexico), Europe (Germany, UK, and France), Asia (China, India, and Japan), South America (Brazil), Middle East and Africa (UAE, South Africa, and Saudi Arabia), Rest of World (ROW)

Published: May 2026 292 Pages SKU: IRTNTR81252

Market Overview at a Glance

$465.9 Mn
Market Opportunity
6.3%
CAGR 2025 - 2030
31.2%
North America Growth
$683.9 Mn
Ablation devices segment 2024

Varicose Vein Treatment Devices Market Size and Growth Forecast 2026-2030

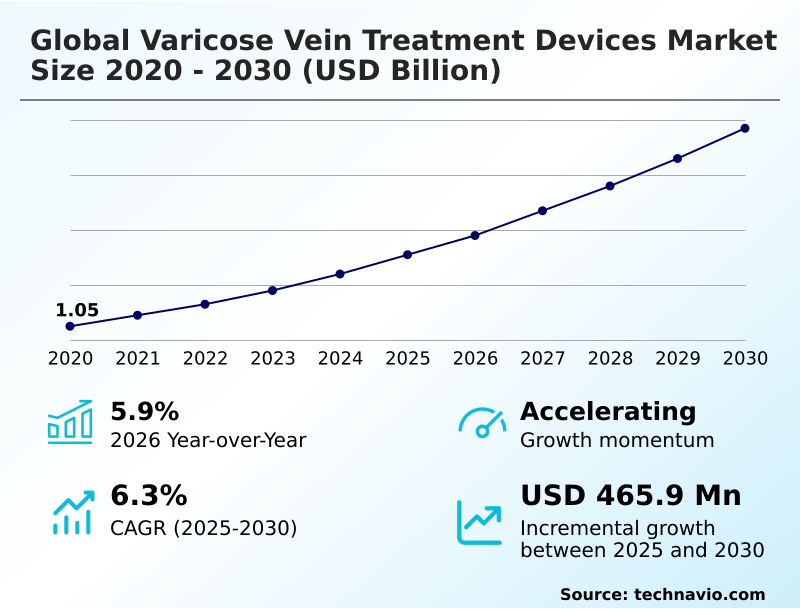
The Varicose Vein Treatment Devices Market size was valued at USD 1.31 billion in 2025 growing at a CAGR of 6.3% during the forecast period 2026-2030.

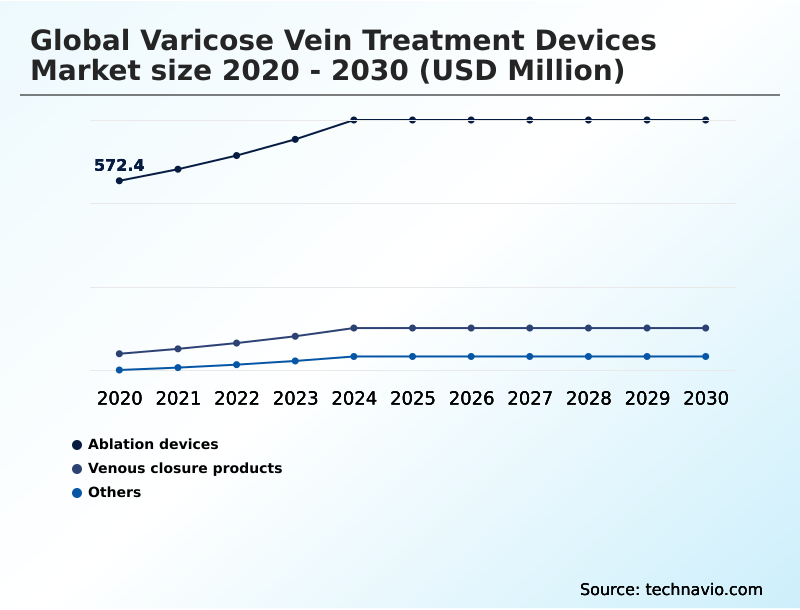
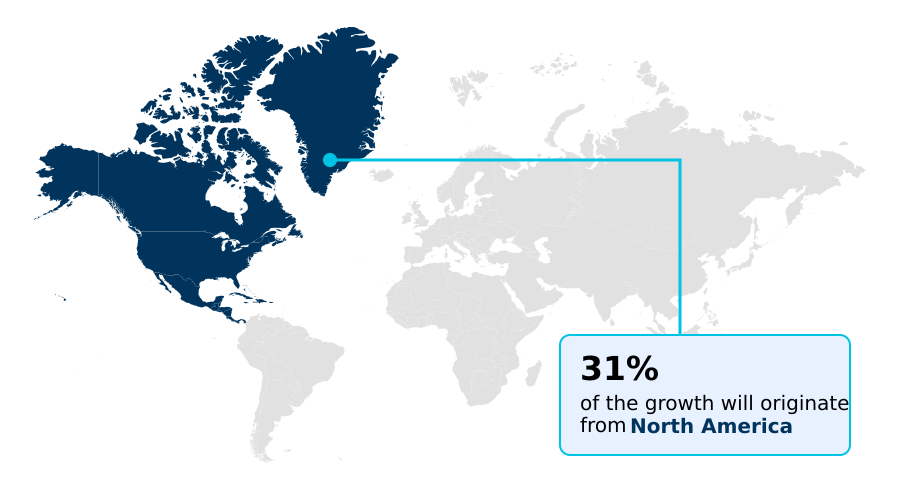
North America accounts for 31.2% of incremental growth during the forecast period. The Ablation devices segment by Device was valued at USD 683.9 million in 2024, while the Hospitals and clinics segment holds the largest revenue share by End-user.

The market is projected to grow by USD 720.4 million from 2020 to 2030, with USD 465.9 million of the growth expected during the forecast period of 2025 to 2030.

Get Key Insights on Market Forecast (PDF) Request Free Sample

Varicose Vein Treatment Devices Market Overview

The varicose vein treatment devices market is defined by a decisive shift toward minimally invasive procedures that improve patient outcomes and operational efficiency in clinical settings. Technologies such as endovenous thermal ablation and radiofrequency ablation have become standard, yet the field is rapidly advancing with non-thermal, non-tumescent options like cyanoacrylate adhesive closure and mechanochemical ablation. A typical ambulatory surgical center, by adopting a modern venous closure system for treating saphenous vein reflux, can increase patient throughput by reducing procedure and recovery times. This evolution is critical as North America alone is projected to contribute 31.2% of the market's incremental growth, reflecting high adoption of advanced endovascular therapy. The market's overall 5.9% year-over-year expansion is propelled by this innovation, which addresses conditions from chronic venous insufficiency to cosmetic concerns. The focus remains on refining catheter-based intervention and polidocanol foam sclerotherapy to minimize patient discomfort and enhance long-term efficacy, meeting demands for both medical and aesthetic-driven treatments in vascular surgery.

Drivers, Trends, and Challenges in the Varicose Vein Treatment Devices Market

Strategic decision-making for vein clinics increasingly revolves around balancing the cost of varicose vein treatment without insurance against clinical efficacy and patient satisfaction. The choice between mechanochemical ablation vs radiofrequency ablation, for instance, requires careful evaluation of upfront equipment costs, procedural consumables, and the potential for complications of endovenous laser ablation.

A key consideration is the varicose vein laser treatment recovery time, as faster recovery reduces patient downtime and improves clinic throughput. In a typical office-based setting, supplementing a primary procedure with an ultrasound-guided foam sclerotherapy procedure for residual varicosities can reduce the need for follow-up visits by over 50% compared to traditional methods.

This operational efficiency is critical for managing the best treatment for spider veins on legs and more complex conditions.

Furthermore, all devices must comply with tracking mandates like the FDA's UDI system to ensure traceability, which is vital for preventing deep vein thrombosis after vein surgery and managing the entire lifecycle of a venous closure system, including those utilizing cyanoacrylate glue for varicose veins.

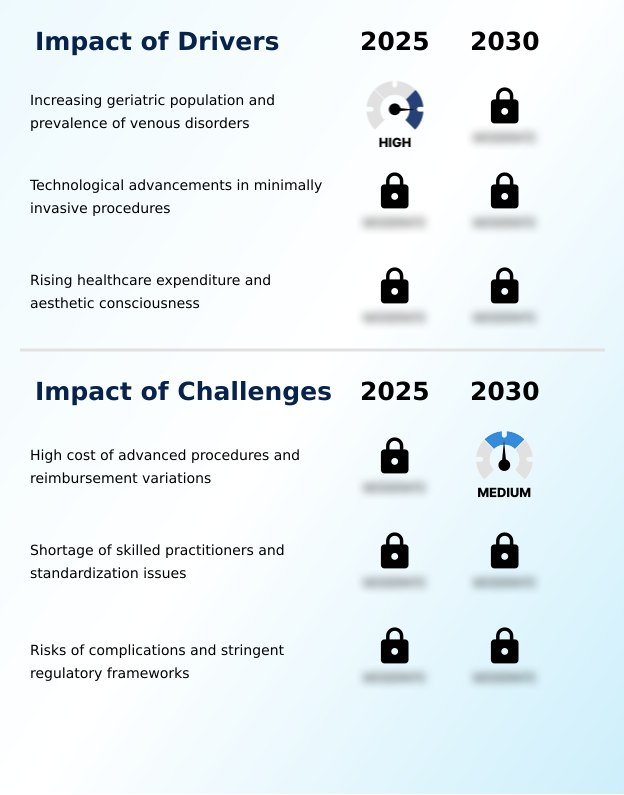
Primary Growth Driver: The primary market driver is the increasing geriatric population globally, coupled with a higher prevalence of venous disorders.

Market growth is propelled by the dual forces of a rising global geriatric population susceptible to chronic venous insufficiency and continuous technological advancements in minimally invasive procedures.

The development of endovenous thermal ablation and radiofrequency ablation has set a high standard for efficacy, creating a strong foundation for market expansion.

Demand is further amplified by lifestyle factors and a growing emphasis on aesthetics, expanding the patient pool beyond medical necessity to include cosmetic concerns.

This resilient demand structure supports sustained R&D in next-generation platforms, including high-intensity focused ultrasound and advanced venous stent system designs.

With Asia's market poised for a robust 7.6% CAGR, the global appetite for effective vein care solutions is creating significant opportunities for innovation in endovascular therapy.

Emerging Market Trend: A key market trend is the accelerated adoption of non-thermal and non-tumescent treatment modalities, which are displacing traditional thermal ablation techniques.

A defining market trend is the structural migration of procedures from hospitals to outpatient settings, including ambulatory surgical centers (ASCs) and office-based labs. This shift is enabled by the adoption of non-thermal, non-tumescent technologies like mechanochemical ablation and cyanoacrylate adhesive closure, which streamline workflows by eliminating the need for tumescent anesthesia.

As ASCs become a more prominent end-user segment, procurement is shifting toward portable, cost-effective devices. This includes advanced vascular access device solutions and integrated vein mapping technology to standardize procedures. The move toward office-based labs not only reduces healthcare system costs but also meets growing patient demand for convenient, minimally invasive endovenous therapy for both medical and cosmetic phlebology indications.

Key Industry Challenge: A key challenge affecting industry growth is the high cost of advanced procedures combined with significant variations in reimbursement policies.

A primary market challenge is the high capital cost of equipment for procedures like radiofrequency ablation, coupled with the recurring expense of single-use disposables for endovenous laser ablation. This financial barrier is magnified by inconsistent reimbursement policies and the rigorous pre-market approval processes of regulatory bodies such as the FDA and EMA.

A shortage of practitioners skilled in duplex ultrasound guidance for complex catheter-based intervention further constrains market growth, particularly in emerging economies. These factors create significant risk, as procedural complications like deep vein thrombosis not only pose patient safety issues but also expose manufacturers of even the most advanced venous stent systems to liability, potentially slowing the adoption of new technology.

Explore Full Market Dynamics Analysis Request Free Sample

Varicose Vein Treatment Devices Market Segmentation

The varicose vein treatment devices industry research report provides comprehensive data including region-wise segment analysis, with forecasts and analysis for the period 2026-2030, as well as historical data from 2020-2024 for the following segments.

Market Segment by Device
  • Ablation devices
  • Venous closure products
  • Others
Market Segment by End-user
  • Hospitals and clinics
  • Ambulatory surgical centers
Market Segment by Application
  • Endovenous ablation
  • Sclerotherapy
  • Surgical ligation and stripping
Market Segment by Geography
North America
US, Canada, Mexico
Europe
Germany, UK, France, Italy, The Netherlands, Spain
Asia
China, India, Japan, South Korea, Indonesia, Thailand, Singapore
Rest of World (ROW)

Device Segment Analysis

The ablation devices segment is estimated to witness significant growth during the forecast period.

The ablation devices segment dominates the varicose vein treatment devices market, primarily driven by the clinical shift from invasive surgery to minimally invasive thermal techniques.

This category, including radiofrequency ablation and endovenous laser ablation systems, leverages thermal energy for vein occlusion. These devices, integral to treating chronic venous insufficiency, are increasingly used in ambulatory phlebectomy.

The market for ablation devices stood at USD 726.6 million in 2025. Demand is bolstered by a preference for office-based procedures offering rapid recovery.

Manufacturers focus on improving catheter technology for navigating tortuous veins, a key factor in successful catheter-based intervention. The adoption of duplex ultrasound guidance ensures precision, solidifying this segment's leading position through superior outcomes in endovenous therapy.

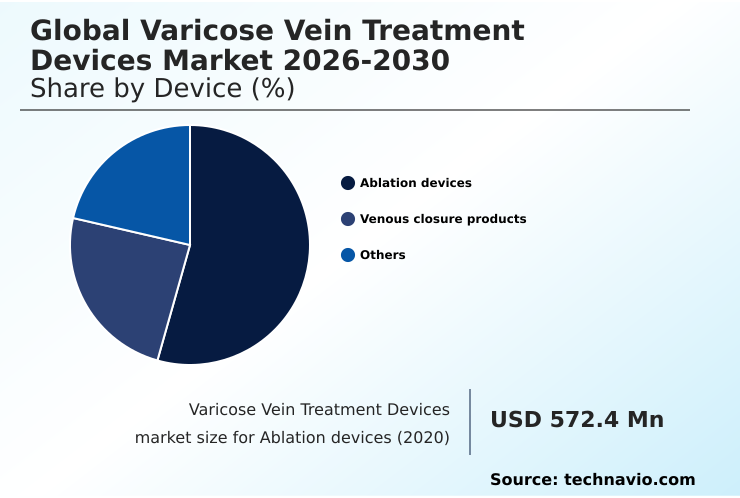
The Ablation devices segment was valued at USD 683.9 million in 2024 and showed a gradual increase during the forecast period.

Varicose Vein Treatment Devices Market by Region: North America Leads with 31.2% Growth Share

North America is estimated to contribute 31.2% to the growth of the global market during the forecast period.

The global geographic landscape is characterized by varied growth trajectories and technology adoption rates.

Asia is set to expand at a 7.6% CAGR, the fastest globally, driven by rising healthcare investments and a large, underserved patient population seeking treatment for chronic vein disease.

In contrast, the mature markets of North America and Europe, which together represent nearly 60% of the market opportunity, focus on adopting next-generation technologies like high-intensity focused ultrasound and non-thermal venous closure systems.

Regulatory frameworks such as the European Union's Medical Device Regulation (MDR) create high barriers to entry, favoring established vendors with robust clinical data for their endovenous therapy devices.

This dynamic ensures that while growth in developed regions is steady, the most significant expansion potential resides in Asian markets.

Customer Landscape Analysis for the Varicose Vein Treatment Devices Market

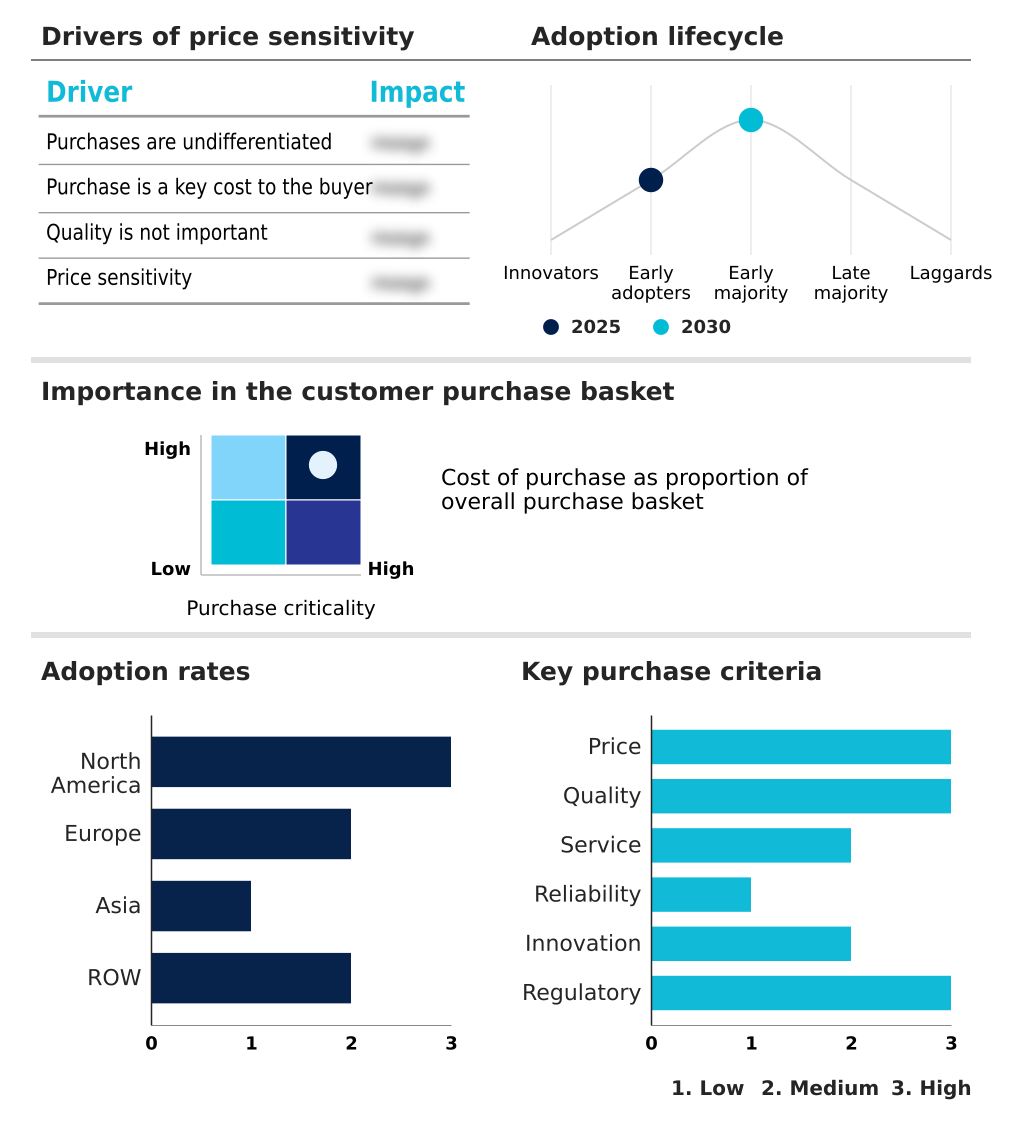
The varicose vein treatment devices market forecasting report includes the adoption lifecycle of the market, covering from the innovator’s stage to the laggard’s stage. It focuses on adoption rates in different regions based on penetration. Furthermore, the varicose vein treatment devices market report also includes key purchase criteria and drivers of price sensitivity to help companies evaluate and develop their market growth analysis strategies.

Competitive Landscape of the Varicose Vein Treatment Devices Market

Companies are implementing various strategies, such as strategic alliances, partnerships, mergers and acquisitions, geographical expansion, and product/service launches, to enhance their presence in the varicose vein treatment devices market industry.

AngioDynamics Inc. - Key offerings range from endovenous thermal ablation catheters and non-thermal adhesive systems to transdermal lasers for aesthetic vein treatment, addressing diverse clinical and cosmetic needs.

The industry research and growth report includes detailed analyses of the competitive landscape of the market and information about key companies, including:

  • AngioDynamics Inc.
  • Becton Dickinson and Co.
  • biolitec AG
  • Boston Scientific Corp.
  • Candela Corp.
  • Cook Group Inc.
  • Cutera Inc.
  • Cynosure LLC
  • Dornier MedTech GmbH
  • Eufoton srl
  • Fotona d.o.o
  • Lasotronix
  • LeMaitre Vascular Inc.
  • Lumenis Be Ltd.
  • Medtronic Plc
  • Merit Medical Systems Inc.
  • Quanta System S.p.A.
  • Teleflex Inc.
  • Terumo Corp.
  • VVT Medical

Qualitative and quantitative analysis of companies has been conducted to help clients understand the wider business environment as well as the strengths and weaknesses of key industry players. Data is qualitatively analyzed to categorize companies as pure play, category-focused, industry-focused, and diversified; it is quantitatively analyzed to categorize companies as dominant, leading, strong, tentative, and weak.

Recent Developments in the Varicose Vein Treatment Devices Market

  • In May 2025, MedVasc AB announced the successful completion of an approximately USD 1 million funding round to advance its catheter-based device designed to enhance anesthetic procedures in varicose vein treatment and support its FDA submission process.
  • In January 2025, Stryker announced a definitive agreement to acquire Inari Medical Inc., a move designed to strengthen its position in the venous thromboembolism segment by integrating Inari's peripheral vascular intervention technologies.
  • In October 2025, THERACLION provided a strategic update on Sonovein, its robotic HIFU platform, announcing the completion of the VEINRESET pivotal US clinical trial, which reported a 96.8% 12-month occlusion rate and confirmed strong safety and efficacy.
  • In February 2025, the Health Sciences Authority in Singapore granted regulatory approval for a next-generation mechanochemical ablation catheter from Vascular Dynamics Corp., expanding access to minimally invasive options for patients with complex venous anatomies.

Research Analyst Overview: Varicose Vein Treatment Devices Market

The varicose vein treatment devices market is driven by a fundamental clinical migration away from invasive surgery toward less traumatic endovenous techniques. Although ablation devices remain the dominant segment, the focus of innovation has shifted to non-thermal, non-tumescent (NTNT) technologies such as mechanochemical ablation and cyanoacrylate adhesive closure, which eliminate the need for tumescent anesthesia.

This trend directly impacts boardroom decisions on capital expenditure and portfolio strategy, as vendors must align with stringent regulatory pathways like the European Union's Medical Device Regulation (MDR) to prove the safety and efficacy of novel venous closure systems. While the market exhibits a 5.9% year-over-year expansion, competition is intensifying.

Success now hinges on demonstrating superior outcomes in treating chronic venous insufficiency and related conditions like deep vein thrombosis, forcing providers of endovenous thermal ablation and radiofrequency ablation to innovate or risk being displaced by more efficient catheter-based intervention methods.

Dive into Technavio’s robust research methodology, blending expert interviews, extensive data synthesis, and validated models for unparalleled Varicose Vein Treatment Devices Market insights. See full methodology.

Request Free Sample

Market Scope
Page number 292
Base year 2025
Historic period 2020-2024
Forecast period 2026-2030
Growth momentum & CAGR Accelerate at a CAGR of 6.3%
Market growth 2026-2030 USD 465.9 million
Market structure Fragmented
YoY growth 2025-2026(%) 5.9%
Key countries US, Canada, Mexico, Germany, UK, France, Italy, The Netherlands, Spain, Russia, China, India, Japan, South Korea, Indonesia, Thailand, Singapore, Australia, Brazil, UAE, South Africa, Saudi Arabia and Turkey
Competitive landscape Leading Companies, Market Positioning of Companies, Competitive Strategies, and Industry Risks

Varicose Vein Treatment Devices Market: Key Questions Answered in This Report

  • What is the expected growth of the Varicose Vein Treatment Devices Market between 2026 and 2030?

    • The Varicose Vein Treatment Devices Market is expected to grow by USD 465.9 million during 2026-2030, registering a CAGR of 6.3%. Year-over-year growth in 2026 is estimated at 5.9%%. This acceleration is shaped by increasing geriatric population and prevalence of venous disorders, which is intensifying demand across multiple end-use verticals covered in the report.

  • What segmentation does the market report cover?

    • The report is segmented by Device (Ablation devices, Venous closure products, and Others), End-user (Hospitals and clinics, and Ambulatory surgical centers), Application (Endovenous ablation, Sclerotherapy, and Surgical ligation and stripping) and Geography (North America, Europe, Asia, Rest of World (ROW)). Among these, the Ablation devices segment is estimated to witness significant growth during the forecast period, driven by rising adoption across key application areas. Each segment includes detailed qualitative and quantitative analysis, along with historical data from 2020-2024 and forecasts through 2030 with year-over-year growth rates.

  • Which regions are analyzed in the report?

    • The report covers North America, Europe, Asia and Rest of World (ROW). North America is estimated to contribute 31.2% to market growth during the forecast period. Country-level analysis includes US, Canada, Mexico, Germany, UK, France, Italy, The Netherlands, Spain, Russia, China, India, Japan, South Korea, Indonesia, Thailand, Singapore, Australia, Brazil, UAE, South Africa, Saudi Arabia and Turkey, with dedicated market size tables and year-over-year growth for each.

  • What are the key growth drivers and market challenges?

    • The primary driver is increasing geriatric population and prevalence of venous disorders, which is accelerating investment and industry demand. The main challenge is high cost of advanced procedures and reimbursement variations, creating operational barriers for key market participants. The report quantifies the impact of each driver and challenge across 2026 and 2030 with comparative analysis.

  • Who are the major players in the Varicose Vein Treatment Devices Market?

    • Key vendors include AngioDynamics Inc., Becton Dickinson and Co., biolitec AG, Boston Scientific Corp., Candela Corp., Cook Group Inc., Cutera Inc., Cynosure LLC, Dornier MedTech GmbH, Eufoton srl, Fotona d.o.o, Lasotronix, LeMaitre Vascular Inc., Lumenis Be Ltd., Medtronic Plc, Merit Medical Systems Inc., Quanta System S.p.A., Teleflex Inc., Terumo Corp. and VVT Medical. The report provides qualitative and quantitative analysis categorizing companies as dominant, leading, strong, tentative, and weak based on their market positioning. Company profiles include business segment analysis, SWOT assessment, key offerings, and recent strategic developments.

Varicose Vein Treatment Devices Market Research Insights

Market dynamics are increasingly shaped by regulatory frameworks and site-of-service economics. The FDA's Unique Device Identification (UDI) system, for instance, adds a layer of tracking and compliance for all vascular access device products, influencing procurement decisions in interventional radiology departments.

In practice, an office-based laboratory's choice between thermal and non-thermal endovenous therapy is driven by capital cost, reimbursement rates, and patient demand for cosmetic phlebology. While North America's market opportunity at 31.19% slightly outpaces Asia's 29.1%, the latter exhibits faster adoption of cost-effective solutions for chronic vein disease.

This geographic divergence reflects differing priorities between mature and emerging healthcare systems in their approach to vascular medicine and venous ulcer management.

We can help! Our analysts can customize this varicose vein treatment devices market research report to meet your requirements.

Get in touch

1. Executive Summary

1.1 Market overview

Executive Summary - Chart on Market Overview
Executive Summary - Data Table on Market Overview
Executive Summary - Chart on Global Market Characteristics
Executive Summary - Chart on Market by Geography
Executive Summary - Chart on Market Segmentation by Device
Executive Summary - Chart on Market Segmentation by End-user
Executive Summary - Chart on Market Segmentation by Application
Executive Summary - Chart on Incremental Growth
Executive Summary - Data Table on Incremental Growth
Executive Summary - Chart on Company Market Positioning

2. Technavio Analysis

2.1 Analysis of price sensitivity, lifecycle, customer purchase basket, adoption rates, and purchase criteria

2.2 Criticality of inputs and Factors of differentiation

Chart on Overview on criticality of inputs and factors of differentiation

2.3 Factors of disruption

Chart on Overview on factors of disruption

2.4 Impact of drivers and challenges

Chart on Impact of drivers and challenges in 2025 and 2030

3. Market Landscape

3.1 Market ecosystem

Chart on Parent Market
Data Table on - Parent Market

3.2 Market characteristics

Chart on Market characteristics analysis

3.3 Value chain analysis

Chart on Value chain analysis

4. Market Sizing

4.1 Market definition

Data Table on Offerings of companies included in the market definition

4.2 Market segment analysis

Market segments

4.3 Market size 2025

4.4 Market outlook: Forecast for 2025-2030

Chart on Global - Market size and forecast 2025-2030 ($ million)
Data Table on Global - Market size and forecast 2025-2030 ($ million)
Chart on Global Market: Year-over-year growth 2025-2030 (%)
Data Table on Global Market: Year-over-year growth 2025-2030 (%)

5. Historic Market Size

5.1 Global Varicose Vein Treatment Devices Market 2020 - 2024

Historic Market Size - Data Table on Global Varicose Vein Treatment Devices Market 2020 - 2024 ($ million)

5.2 Device segment analysis 2020 - 2024

Historic Market Size - Device Segment 2020 - 2024 ($ million)

5.3 End-user segment analysis 2020 - 2024

Historic Market Size - End-user Segment 2020 - 2024 ($ million)

5.4 Application segment analysis 2020 - 2024

Historic Market Size - Application Segment 2020 - 2024 ($ million)

5.5 Geography segment analysis 2020 - 2024

Historic Market Size - Geography Segment 2020 - 2024 ($ million)

5.6 Country segment analysis 2020 - 2024

Historic Market Size - Country Segment 2020 - 2024 ($ million)

6. Qualitative Analysis

6.1 Impact of AI on the Global Varicose Vein Treatment Devices Market

7. Five Forces Analysis

7.1 Five forces summary

Five forces analysis - Comparison between 2025 and 2030

7.2 Bargaining power of buyers

Bargaining power of buyers - Impact of key factors 2025 and 2030

7.3 Bargaining power of suppliers

Bargaining power of suppliers - Impact of key factors in 2025 and 2030

7.4 Threat of new entrants

Threat of new entrants - Impact of key factors in 2025 and 2030

7.5 Threat of substitutes

Threat of substitutes - Impact of key factors in 2025 and 2030

7.6 Threat of rivalry

Threat of rivalry - Impact of key factors in 2025 and 2030

7.7 Market condition

Chart on Market condition - Five forces 2025 and 2030

8. Market Segmentation by Device

8.1 Market segments

Chart on Device - Market share 2025-2030 (%)
Data Table on Device - Market share 2025-2030 (%)

8.2 Comparison by Device

Chart on Comparison by Device
Data Table on Comparison by Device

8.3 Ablation devices - Market size and forecast 2025-2030

Chart on Ablation devices - Market size and forecast 2025-2030 ($ million)
Data Table on Ablation devices - Market size and forecast 2025-2030 ($ million)
Chart on Ablation devices - Year-over-year growth 2025-2030 (%)
Data Table on Ablation devices - Year-over-year growth 2025-2030 (%)

8.4 Venous closure products - Market size and forecast 2025-2030

Chart on Venous closure products - Market size and forecast 2025-2030 ($ million)
Data Table on Venous closure products - Market size and forecast 2025-2030 ($ million)
Chart on Venous closure products - Year-over-year growth 2025-2030 (%)
Data Table on Venous closure products - Year-over-year growth 2025-2030 (%)

8.5 Others - Market size and forecast 2025-2030

Chart on Others - Market size and forecast 2025-2030 ($ million)
Data Table on Others - Market size and forecast 2025-2030 ($ million)
Chart on Others - Year-over-year growth 2025-2030 (%)
Data Table on Others - Year-over-year growth 2025-2030 (%)

8.6 Market opportunity by Device

Market opportunity by Device ($ million)
Data Table on Market opportunity by Device ($ million)

9. Market Segmentation by End-user

9.1 Market segments

Chart on End-user - Market share 2025-2030 (%)
Data Table on End-user - Market share 2025-2030 (%)

9.2 Comparison by End-user

Chart on Comparison by End-user
Data Table on Comparison by End-user

9.3 Hospitals and clinics - Market size and forecast 2025-2030

Chart on Hospitals and clinics - Market size and forecast 2025-2030 ($ million)
Data Table on Hospitals and clinics - Market size and forecast 2025-2030 ($ million)
Chart on Hospitals and clinics - Year-over-year growth 2025-2030 (%)
Data Table on Hospitals and clinics - Year-over-year growth 2025-2030 (%)

9.4 Ambulatory surgical centers - Market size and forecast 2025-2030

Chart on Ambulatory surgical centers - Market size and forecast 2025-2030 ($ million)
Data Table on Ambulatory surgical centers - Market size and forecast 2025-2030 ($ million)
Chart on Ambulatory surgical centers - Year-over-year growth 2025-2030 (%)
Data Table on Ambulatory surgical centers - Year-over-year growth 2025-2030 (%)

9.5 Market opportunity by End-user

Market opportunity by End-user ($ million)
Data Table on Market opportunity by End-user ($ million)

10. Market Segmentation by Application

10.1 Market segments

Chart on Application - Market share 2025-2030 (%)
Data Table on Application - Market share 2025-2030 (%)

10.2 Comparison by Application

Chart on Comparison by Application
Data Table on Comparison by Application

10.3 Endovenous ablation - Market size and forecast 2025-2030

Chart on Endovenous ablation - Market size and forecast 2025-2030 ($ million)
Data Table on Endovenous ablation - Market size and forecast 2025-2030 ($ million)
Chart on Endovenous ablation - Year-over-year growth 2025-2030 (%)
Data Table on Endovenous ablation - Year-over-year growth 2025-2030 (%)

10.4 Sclerotherapy - Market size and forecast 2025-2030

Chart on Sclerotherapy - Market size and forecast 2025-2030 ($ million)
Data Table on Sclerotherapy - Market size and forecast 2025-2030 ($ million)
Chart on Sclerotherapy - Year-over-year growth 2025-2030 (%)
Data Table on Sclerotherapy - Year-over-year growth 2025-2030 (%)

10.5 Surgical ligation and stripping - Market size and forecast 2025-2030

Chart on Surgical ligation and stripping - Market size and forecast 2025-2030 ($ million)
Data Table on Surgical ligation and stripping - Market size and forecast 2025-2030 ($ million)
Chart on Surgical ligation and stripping - Year-over-year growth 2025-2030 (%)
Data Table on Surgical ligation and stripping - Year-over-year growth 2025-2030 (%)

10.6 Market opportunity by Application

Market opportunity by Application ($ million)
Data Table on Market opportunity by Application ($ million)

11. Customer Landscape

11.1 Customer landscape overview

Analysis of price sensitivity, lifecycle, customer purchase basket, adoption rates, and purchase criteria

12. Geographic Landscape

12.1 Geographic segmentation

Chart on Market share by geography 2025-2030 (%)
Data Table on Market share by geography 2025-2030 (%)

12.2 Geographic comparison

Chart on Geographic comparison
Data Table on Geographic comparison

12.3 North America - Market size and forecast 2025-2030

Chart on North America - Market size and forecast 2025-2030 ($ million)
Data Table on North America - Market size and forecast 2025-2030 ($ million)
Chart on North America - Year-over-year growth 2025-2030 (%)
Data Table on North America - Year-over-year growth 2025-2030 (%)
Chart on Regional Comparison - North America
Data Table on Regional Comparison - North America

12.3.1 US - Market size and forecast 2025-2030

Chart on US - Market size and forecast 2025-2030 ($ million)
Data Table on US - Market size and forecast 2025-2030 ($ million)
Chart on US - Year-over-year growth 2025-2030 (%)
Data Table on US - Year-over-year growth 2025-2030 (%)

12.3.2 Canada - Market size and forecast 2025-2030

Chart on Canada - Market size and forecast 2025-2030 ($ million)
Data Table on Canada - Market size and forecast 2025-2030 ($ million)
Chart on Canada - Year-over-year growth 2025-2030 (%)
Data Table on Canada - Year-over-year growth 2025-2030 (%)

12.3.3 Mexico - Market size and forecast 2025-2030

Chart on Mexico - Market size and forecast 2025-2030 ($ million)
Data Table on Mexico - Market size and forecast 2025-2030 ($ million)
Chart on Mexico - Year-over-year growth 2025-2030 (%)
Data Table on Mexico - Year-over-year growth 2025-2030 (%)

12.4 Europe - Market size and forecast 2025-2030

Chart on Europe - Market size and forecast 2025-2030 ($ million)
Data Table on Europe - Market size and forecast 2025-2030 ($ million)
Chart on Europe - Year-over-year growth 2025-2030 (%)
Data Table on Europe - Year-over-year growth 2025-2030 (%)
Chart on Regional Comparison - Europe
Data Table on Regional Comparison - Europe

12.4.1 Germany - Market size and forecast 2025-2030

Chart on Germany - Market size and forecast 2025-2030 ($ million)
Data Table on Germany - Market size and forecast 2025-2030 ($ million)
Chart on Germany - Year-over-year growth 2025-2030 (%)
Data Table on Germany - Year-over-year growth 2025-2030 (%)

12.4.2 UK - Market size and forecast 2025-2030

Chart on UK - Market size and forecast 2025-2030 ($ million)
Data Table on UK - Market size and forecast 2025-2030 ($ million)
Chart on UK - Year-over-year growth 2025-2030 (%)
Data Table on UK - Year-over-year growth 2025-2030 (%)

12.4.3 France - Market size and forecast 2025-2030

Chart on France - Market size and forecast 2025-2030 ($ million)
Data Table on France - Market size and forecast 2025-2030 ($ million)
Chart on France - Year-over-year growth 2025-2030 (%)
Data Table on France - Year-over-year growth 2025-2030 (%)

12.4.4 Italy - Market size and forecast 2025-2030

Chart on Italy - Market size and forecast 2025-2030 ($ million)
Data Table on Italy - Market size and forecast 2025-2030 ($ million)
Chart on Italy - Year-over-year growth 2025-2030 (%)
Data Table on Italy - Year-over-year growth 2025-2030 (%)

12.4.5 The Netherlands - Market size and forecast 2025-2030

Chart on The Netherlands - Market size and forecast 2025-2030 ($ million)
Data Table on The Netherlands - Market size and forecast 2025-2030 ($ million)
Chart on The Netherlands - Year-over-year growth 2025-2030 (%)
Data Table on The Netherlands - Year-over-year growth 2025-2030 (%)

12.4.6 Spain - Market size and forecast 2025-2030

Chart on Spain - Market size and forecast 2025-2030 ($ million)
Data Table on Spain - Market size and forecast 2025-2030 ($ million)
Chart on Spain - Year-over-year growth 2025-2030 (%)
Data Table on Spain - Year-over-year growth 2025-2030 (%)

12.4.7 Russia - Market size and forecast 2025-2030

Chart on Russia - Market size and forecast 2025-2030 ($ million)
Data Table on Russia - Market size and forecast 2025-2030 ($ million)
Chart on Russia - Year-over-year growth 2025-2030 (%)
Data Table on Russia - Year-over-year growth 2025-2030 (%)

12.5 Asia - Market size and forecast 2025-2030

Chart on Asia - Market size and forecast 2025-2030 ($ million)
Data Table on Asia - Market size and forecast 2025-2030 ($ million)
Chart on Asia - Year-over-year growth 2025-2030 (%)
Data Table on Asia - Year-over-year growth 2025-2030 (%)
Chart on Regional Comparison - Asia
Data Table on Regional Comparison - Asia

12.5.1 China - Market size and forecast 2025-2030

Chart on China - Market size and forecast 2025-2030 ($ million)
Data Table on China - Market size and forecast 2025-2030 ($ million)
Chart on China - Year-over-year growth 2025-2030 (%)
Data Table on China - Year-over-year growth 2025-2030 (%)

12.5.2 India - Market size and forecast 2025-2030

Chart on India - Market size and forecast 2025-2030 ($ million)
Data Table on India - Market size and forecast 2025-2030 ($ million)
Chart on India - Year-over-year growth 2025-2030 (%)
Data Table on India - Year-over-year growth 2025-2030 (%)

12.5.3 Japan - Market size and forecast 2025-2030

Chart on Japan - Market size and forecast 2025-2030 ($ million)
Data Table on Japan - Market size and forecast 2025-2030 ($ million)
Chart on Japan - Year-over-year growth 2025-2030 (%)
Data Table on Japan - Year-over-year growth 2025-2030 (%)

12.5.4 South Korea - Market size and forecast 2025-2030

Chart on South Korea - Market size and forecast 2025-2030 ($ million)
Data Table on South Korea - Market size and forecast 2025-2030 ($ million)
Chart on South Korea - Year-over-year growth 2025-2030 (%)
Data Table on South Korea - Year-over-year growth 2025-2030 (%)

12.5.5 Indonesia - Market size and forecast 2025-2030

Chart on Indonesia - Market size and forecast 2025-2030 ($ million)
Data Table on Indonesia - Market size and forecast 2025-2030 ($ million)
Chart on Indonesia - Year-over-year growth 2025-2030 (%)
Data Table on Indonesia - Year-over-year growth 2025-2030 (%)

12.5.6 Thailand - Market size and forecast 2025-2030

Chart on Thailand - Market size and forecast 2025-2030 ($ million)
Data Table on Thailand - Market size and forecast 2025-2030 ($ million)
Chart on Thailand - Year-over-year growth 2025-2030 (%)
Data Table on Thailand - Year-over-year growth 2025-2030 (%)

12.5.7 Singapore - Market size and forecast 2025-2030

Chart on Singapore - Market size and forecast 2025-2030 ($ million)
Data Table on Singapore - Market size and forecast 2025-2030 ($ million)
Chart on Singapore - Year-over-year growth 2025-2030 (%)
Data Table on Singapore - Year-over-year growth 2025-2030 (%)

12.6 Rest of World (ROW) - Market size and forecast 2025-2030

Chart on Rest of World (ROW) - Market size and forecast 2025-2030 ($ million)
Data Table on Rest of World (ROW) - Market size and forecast 2025-2030 ($ million)
Chart on Rest of World (ROW) - Year-over-year growth 2025-2030 (%)
Data Table on Rest of World (ROW) - Year-over-year growth 2025-2030 (%)
Chart on Regional Comparison - Rest of World (ROW)
Data Table on Regional Comparison - Rest of World (ROW)

12.6.1 Australia - Market size and forecast 2025-2030

Chart on Australia - Market size and forecast 2025-2030 ($ million)
Data Table on Australia - Market size and forecast 2025-2030 ($ million)
Chart on Australia - Year-over-year growth 2025-2030 (%)
Data Table on Australia - Year-over-year growth 2025-2030 (%)

12.6.2 Brazil - Market size and forecast 2025-2030

Chart on Brazil - Market size and forecast 2025-2030 ($ million)
Data Table on Brazil - Market size and forecast 2025-2030 ($ million)
Chart on Brazil - Year-over-year growth 2025-2030 (%)
Data Table on Brazil - Year-over-year growth 2025-2030 (%)

12.6.3 UAE - Market size and forecast 2025-2030

Chart on UAE - Market size and forecast 2025-2030 ($ million)
Data Table on UAE - Market size and forecast 2025-2030 ($ million)
Chart on UAE - Year-over-year growth 2025-2030 (%)
Data Table on UAE - Year-over-year growth 2025-2030 (%)

12.6.4 South Africa - Market size and forecast 2025-2030

Chart on South Africa - Market size and forecast 2025-2030 ($ million)
Data Table on South Africa - Market size and forecast 2025-2030 ($ million)
Chart on South Africa - Year-over-year growth 2025-2030 (%)
Data Table on South Africa - Year-over-year growth 2025-2030 (%)

12.6.5 Saudi Arabia - Market size and forecast 2025-2030

Chart on Saudi Arabia - Market size and forecast 2025-2030 ($ million)
Data Table on Saudi Arabia - Market size and forecast 2025-2030 ($ million)
Chart on Saudi Arabia - Year-over-year growth 2025-2030 (%)
Data Table on Saudi Arabia - Year-over-year growth 2025-2030 (%)

12.6.6 Turkey - Market size and forecast 2025-2030

Chart on Turkey - Market size and forecast 2025-2030 ($ million)
Data Table on Turkey - Market size and forecast 2025-2030 ($ million)
Chart on Turkey - Year-over-year growth 2025-2030 (%)
Data Table on Turkey - Year-over-year growth 2025-2030 (%)

12.7 Market opportunity by geography

Market opportunity by geography ($ million)
Data Tables on Market opportunity by geography ($ million)

13. Drivers, Challenges, and Opportunity

13.1 Market drivers

Increasing geriatric population and prevalence of venous disorders
Technological advancements in minimally invasive procedures
Rising healthcare expenditure and aesthetic consciousness

13.2 Market challenges

High cost of advanced procedures and reimbursement variations
Shortage of skilled practitioners and standardization issues
Risks of complications and stringent regulatory frameworks

13.3 Impact of drivers and challenges

Impact of drivers and challenges in 2025 and 2030

13.4 Market opportunities

Accelerated adoption of non-thermal and non-tumescent treatment modalities
Migration of venous procedures to office-based laboratories and ambulatory centers
Integration of advanced imaging and augmented reality in vein mapping

14. Competitive Landscape

14.1 Overview

14.2

Overview on criticality of inputs and factors of differentiation

14.3 Landscape disruption

Overview on factors of disruption

14.4 Industry risks

Impact of key risks on business

15. Competitive Analysis

15.1 Companies profiled

Companies covered

15.2 Company ranking index

15.3 Market positioning of companies

Matrix on companies position and classification

15.4 AngioDynamics Inc.

AngioDynamics Inc. - Overview
AngioDynamics Inc. - Business segments
AngioDynamics Inc. - Key news
AngioDynamics Inc. - Key offerings
AngioDynamics Inc. - Segment focus
SWOT

15.5 Becton Dickinson and Co.

Becton Dickinson and Co. - Overview
Becton Dickinson and Co. - Business segments
Becton Dickinson and Co. - Key news
Becton Dickinson and Co. - Key offerings
Becton Dickinson and Co. - Segment focus
SWOT

15.6 biolitec AG

biolitec AG - Overview
biolitec AG - Product / Service
biolitec AG - Key offerings
SWOT

15.7 Boston Scientific Corp.

Boston Scientific Corp. - Overview
Boston Scientific Corp. - Business segments
Boston Scientific Corp. - Key news
Boston Scientific Corp. - Key offerings
Boston Scientific Corp. - Segment focus
SWOT

15.8 Candela Corp.

Candela Corp. - Overview
Candela Corp. - Product / Service
Candela Corp. - Key offerings
SWOT

15.9 Cook Group Inc.

Cook Group Inc. - Overview
Cook Group Inc. - Product / Service
Cook Group Inc. - Key offerings
SWOT

15.10 Cutera Inc.

Cutera Inc. - Overview
Cutera Inc. - Product / Service
Cutera Inc. - Key news
Cutera Inc. - Key offerings
SWOT

15.11 Cynosure LLC

Cynosure LLC - Overview
Cynosure LLC - Product / Service
Cynosure LLC - Key offerings
SWOT

15.12 Dornier MedTech GmbH

Dornier MedTech GmbH - Overview
Dornier MedTech GmbH - Product / Service
Dornier MedTech GmbH - Key offerings
SWOT

15.13 Fotona d.o.o

Fotona d.o.o - Overview
Fotona d.o.o - Product / Service
Fotona d.o.o - Key offerings
SWOT

15.14 LeMaitre Vascular Inc.

LeMaitre Vascular Inc. - Overview
LeMaitre Vascular Inc. - Product / Service
LeMaitre Vascular Inc. - Key offerings
SWOT

15.15 Medtronic Plc

Medtronic Plc - Overview
Medtronic Plc - Business segments
Medtronic Plc - Key news
Medtronic Plc - Key offerings
Medtronic Plc - Segment focus
SWOT

15.16 Merit Medical Systems Inc.

Merit Medical Systems Inc. - Overview
Merit Medical Systems Inc. - Business segments
Merit Medical Systems Inc. - Key news
Merit Medical Systems Inc. - Key offerings
Merit Medical Systems Inc. - Segment focus
SWOT

15.17 Teleflex Inc.

Teleflex Inc. - Overview
Teleflex Inc. - Business segments
Teleflex Inc. - Key news
Teleflex Inc. - Key offerings
Teleflex Inc. - Segment focus
SWOT

15.18 Terumo Corp.

Terumo Corp. - Overview
Terumo Corp. - Business segments
Terumo Corp. - Key news
Terumo Corp. - Key offerings
Terumo Corp. - Segment focus
SWOT

16. Appendix

16.1 Scope of the report

Market definition
Objectives
Notes and caveats

16.2 Inclusions and exclusions checklist

Inclusions checklist
Exclusions checklist

16.3 Currency conversion rates for US$

16.4 Research methodology

16.5 Data procurement

Information sources

16.6 Data validation

16.7 Validation techniques employed for market sizing

16.8 Data synthesis

16.9 360 degree market analysis

16.10 List of abbreviations

Research Methodology

Technavio presents a detailed picture of the market by way of study, synthesis, and summation of data from multiple sources. The analysts have presented the various facets of the market with a particular focus on identifying the key industry influencers. The data thus presented is comprehensive, reliable, and the result of extensive research, both primary and secondary.

INFORMATION SOURCES

Primary sources

  • Manufacturers and suppliers
  • Channel partners
  • Industry experts
  • Strategic decision makers

Secondary sources

  • Industry journals and periodicals
  • Government data
  • Financial reports of key industry players
  • Historical data
  • Press releases

DATA ANALYSIS

Data Synthesis

  • Collation of data
  • Estimation of key figures
  • Analysis of derived insights

Data Validation

  • Triangulation with data models
  • Reference against proprietary databases
  • Corroboration with industry experts

REPORT WRITING

Qualitative

  • Market drivers
  • Market challenges
  • Market trends
  • Five forces analysis

Quantitative

  • Market size and forecast
  • Market segmentation
  • Geographical insights
  • Competitive landscape

Interested in this report?

Get your sample now to see our research methodology and insights!

Download Now

Frequently Asked Questions

Varicose Vein Treatment Devices market growth will increase by USD 465.9 million during 2026-2030.

The Varicose Vein Treatment Devices market is expected to grow at a CAGR of 6.3% during 2026-2030.

Varicose Vein Treatment Devices market is segmented by Device (Ablation devices, Venous closure products, Others) End-user (Hospitals and clinics, Ambulatory surgical centers) Application (Endovenous ablation, Sclerotherapy, Surgical ligation and stripping)

AngioDynamics Inc., Becton Dickinson and Co., biolitec AG, Boston Scientific Corp., Candela Corp., Cook Group Inc., Cutera Inc., Cynosure LLC, Dornier MedTech GmbH, Eufoton srl, Fotona d.o.o, Lasotronix, LeMaitre Vascular Inc., Lumenis Be Ltd., Medtronic Plc, Merit Medical Systems Inc., Quanta System S.p.A., Teleflex Inc., Terumo Corp., VVT Medical are a few of the key vendors in the Varicose Vein Treatment Devices market.

North America will register the highest growth rate of 31.2% among the other regions. Therefore, the Varicose Vein Treatment Devices market in North America is expected to garner significant business opportunities for the vendors during the forecast period.

US, Canada, Mexico, Germany, UK, France, Italy, The Netherlands, Spain, Russia, China, India, Japan, South Korea, Indonesia, Thailand, Singapore, Australia, Brazil, UAE, South Africa, Saudi Arabia, Turkey

  • Increasing geriatric population and prevalence of venous disorders is the driving factor this market.

The Varicose Vein Treatment Devices market vendors should focus on grabbing business opportunities from the Device segment as it accounted for the largest market share in the base year.
RIA - Research AI Assistant
Ask RIA