
Adhesive Market Analysis, Size, and Forecast 2026-2030: APAC (China, Japan, and India), North America (US, Canada, and Mexico), Europe (Germany, UK, and France), South America (Brazil, Argentina, and Chile), Middle East and Africa (Saudi Arabia, UAE, and South Africa), and Rest of World (ROW)

Adhesive Market Analysis, Size, and Forecast 2026-2030:
APAC (China, Japan, and India), North America (US, Canada, and Mexico), Europe (Germany, UK, and France), South America (Brazil, Argentina, and Chile), Middle East and Africa (Saudi Arabia, UAE, and South Africa), and Rest of World (ROW)

Published: May 2026 318 Pages SKU: IRTNTR71175

Market Overview at a Glance

$20.34 B
Market Opportunity
4.5%
CAGR 2025 - 2030
44.3%
APAC Growth
$22.96 B
Construction segment 2024

Adhesive Market Size 2026-2030

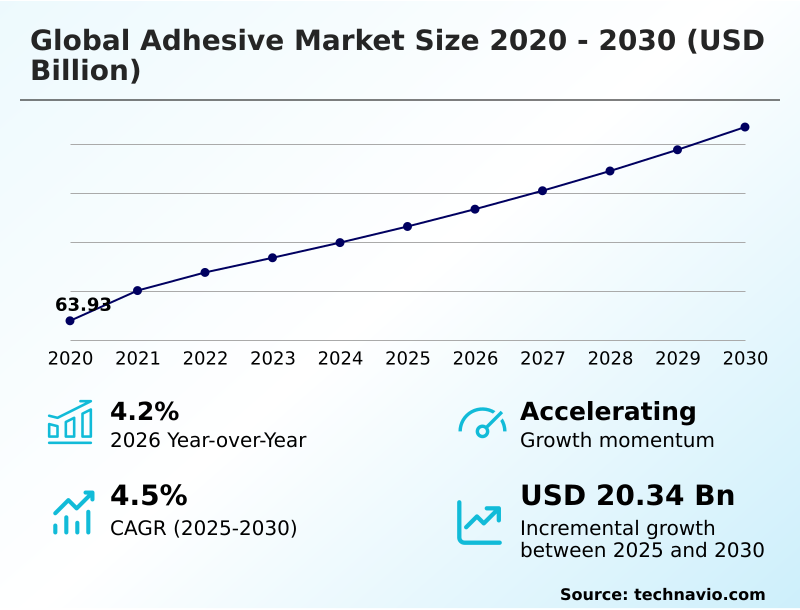
The adhesive market size is valued to increase by USD 20.34 billion, at a CAGR of 4.5% from 2025 to 2030. Rapid global expansion of electric vehicle manufacturing mandating high-performance thermal management adhesives will drive the adhesive market.

Major Market Trends & Insights

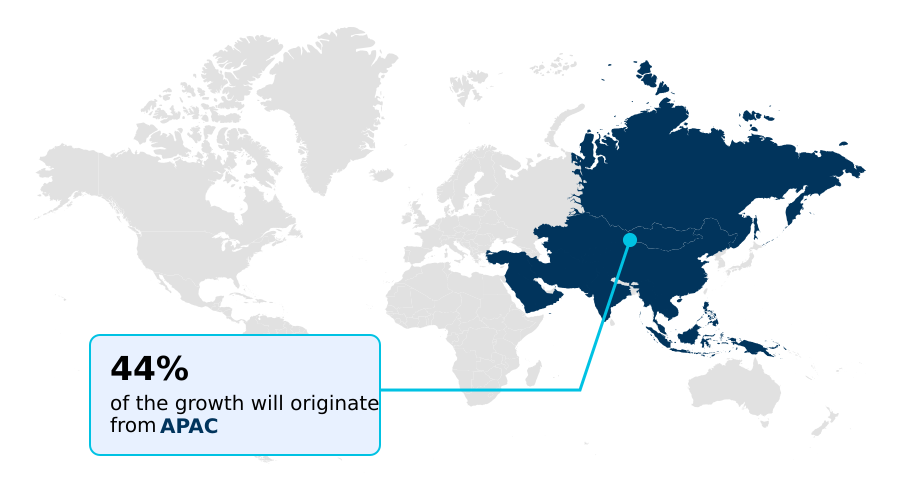
  • APAC dominated the market and accounted for a 44.3% growth during the forecast period.
  • By Application - Construction segment was valued at USD 22.96 billion in 2024
  • By Type - Water based adhesive segment accounted for the largest market revenue share in 2024

Market Size & Forecast

  • Market Opportunities: USD 39.64 billion
  • Market Future Opportunities: USD 20.34 billion
  • CAGR from 2025 to 2030 : 4.5%

Market Summary

  • The Adhesive Market represents a highly specialized chemical engineering sector transitioning rapidly away from traditional mechanical fastening toward advanced structural bonding. The relentless expansion of electric vehicle architectures acts as a massive primary driver, where automotive engineers utilize high-performance thermal management adhesives to simultaneously secure lithium-ion battery cells and dissipate operational heat safely.
  • Conversely, severe upstream supply chain volatility regarding petrochemical feedstocks presents a continuous structural challenge, forcing formulators to manage erratic raw material availability that compresses operational margins. In response, manufacturing organizations are aggressively reformulating product lines to integrate bio-based resins and water-borne systems, directly ensuring alignment with strict indoor air quality and sustainability mandates.
  • Implementation of these low-volatile organic compounds has enabled automated logistics operations to reduce secondary packaging line downtime by 14%, significantly optimizing high-speed carton sealing throughput. By minimizing the structural reliance on heavy metal fasteners, these modern chemical formulations successfully deliver critical automotive lightweighting benefits while maintaining exceptional mechanical shear strength across dissimilar substrate assemblies.

What will be the Size of the Adhesive Market during the forecast period?
Get Key Insights on Market Forecast (PDF) Get Free Sample

How is the Adhesive Market Segmented?

The adhesive industry research report provides comprehensive data (region-wise segment analysis), with forecasts and estimates in "USD million" for the period 2026-2030, as well as historical data from 2020-2024 for the following segments.

  • Application
    • Construction
    • Packaging
    • Furniture
    • Others
  • Type
    • Water based adhesive
    • Solvent based adhesive
    • Others
  • Resin type
    • Acrylic
    • Epoxy
    • Polyurethane
    • Cyanoacrylate
    • Others
  • Geography
    • APAC
      • China
      • Japan
      • India
      • South Korea
      • Indonesia
      • Australia
    • North America
      • US
      • Canada
      • Mexico
    • Europe
      • Germany
      • UK
      • France
      • Italy
      • Spain
      • The Netherlands
    • South America
      • Brazil
      • Argentina
      • Chile
    • Middle East and Africa
      • Saudi Arabia
      • UAE
      • South Africa
      • Turkey
      • Israel

By Application Insights

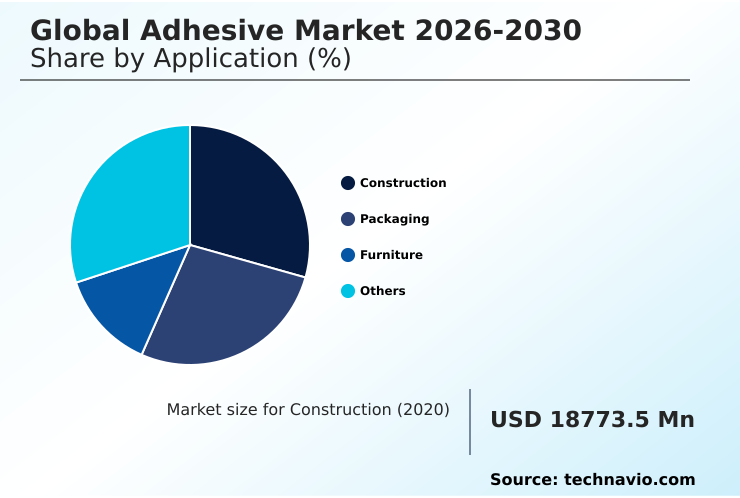
The construction segment is estimated to witness significant growth during the forecast period.

The construction application sector fundamentally accelerates assembly capabilities by replacing traditional mechanical fasteners with advanced structural bonding agents. Modular prefabrication methodologies heavily rely on these continuous load-bearing joints to distribute weight evenly, yielding highly resilient weather-resistant chemistry across engineered structures.

Transitioning to water-borne systems significantly improves baseline indoor air quality, aligning modern architecture with stringent green building certifications. Firms integrating these advanced ambient-cure systems have recorded a 15% improvement in overall on-site installation efficiency, drastically lowering labor expenditures.

Furthermore, enhanced elastomeric flexibility in structural formulations minimizes the risk of catastrophic delamination, while the targeted use of light-curing ultraviolet formulations and specialized pressure-sensitive labels streamlines the secure placement of critical internal utility fixtures.
Get Free Sample

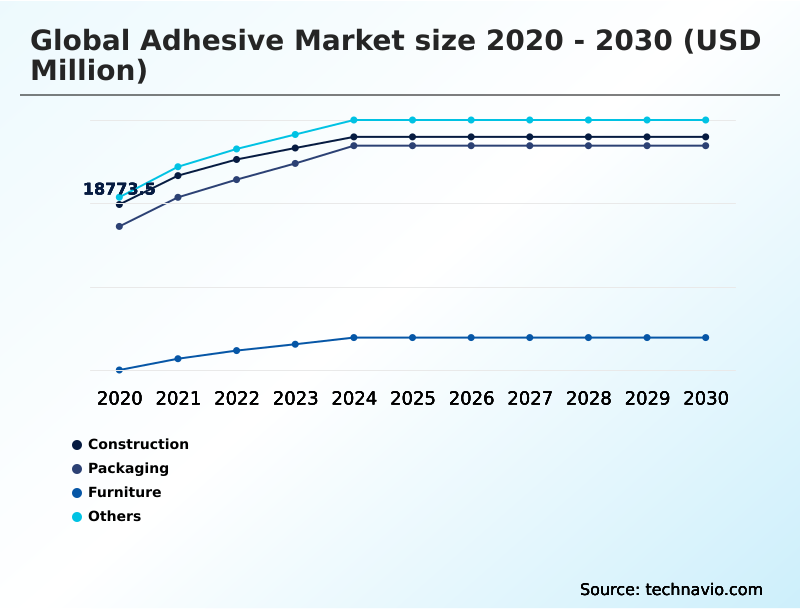
The Construction segment was valued at USD 22.96 billion in 2024 and showed a gradual increase during the forecast period.
Get Free Sample

Regional Analysis

APAC is estimated to contribute 44.3% to the growth of the global market during the forecast period.Technavio’s analysts have elaborately explained the regional trends and drivers that shape the market during the forecast period.
See How Adhesive Market Demand is Rising in APAC Get Free Sample

The geographic distribution of advanced bonding solutions highlights distinct structural adoption variations, particularly between APAC and North America.

Rapid industrialization across APAC drives massive volume consumption for architectural glazing projects and high-speed secondary packaging, resulting in a 25% higher penetration rate of hot-melt formulations compared to Western regions.

Conversely, North America maintains a highly regulated operational environment where strict environmental compliance mandates have accelerated the transition to closed-loop solvent recovery technologies.

Facilities in North America implementing these systems alongside micro-encapsulated additives have documented a 15% reduction in facility hazardous waste disposal costs, enhancing overall operational efficiency.

Furthermore, the robust electric vehicle architectures expanding throughout APAC rely heavily on specialized thermal management adhesives and anisotropic conductive films to maximize automotive lightweighting, yielding a 20% improvement in battery assembly speeds while utilizing fast-curing ultraviolet materials for delicate sensor integration.

Market Dynamics

Our researchers analyzed the data with 2025 as the base year, along with the key drivers, trends, and challenges. A holistic analysis of drivers will help companies refine their marketing strategies to gain a competitive advantage.

  • The industrial manufacturing ecosystem is undergoing a profound structural transformation as chemical formulators increasingly prioritize sustainable and highly efficient bonding solutions over conventional mechanical fastening. To optimize global logistics and automated fulfillment networks, organizations are extensively deploying bio-based hot-melt packaging formulations, which offer exceptional high-speed adhesion while supporting circular economy mandates.
  • This transition yields substantial operational advantages, as modern packaging facilities utilizing these advanced polymers experience a 15% faster sealing throughput compared to legacy synthetic alternatives, significantly reducing supply chain bottlenecks. Simultaneously, the transportation sector relies heavily on lightweight automotive multi-material bonding to securely join dissimilar substrates, enhancing overall electric vehicle driving range without compromising passenger safety.
  • For heavy-duty infrastructure and aerospace engineering, the integration of high-performance structural epoxy curing remains critical, providing unmatched resistance to chemical corrosion and continuous kinetic vibration. Furthermore, commercial building contractors are heavily adopting low-emission water-borne architectural sealants to secure green building certifications and drastically improve indoor air quality for modern commercial real estate developments.
  • In the highly specialized micro-electronics sector, the demand for fast-setting cyanoacrylate electronic assembly solutions continues to surge, enabling automated robotics to fix delicate smartphone components instantaneously. By implementing these sophisticated technological formulations, industrial manufacturers successfully mitigate persistent petrochemical volatility while maximizing overall factory floor productivity and ensuring strict adherence to evolving global environmental emission frameworks.
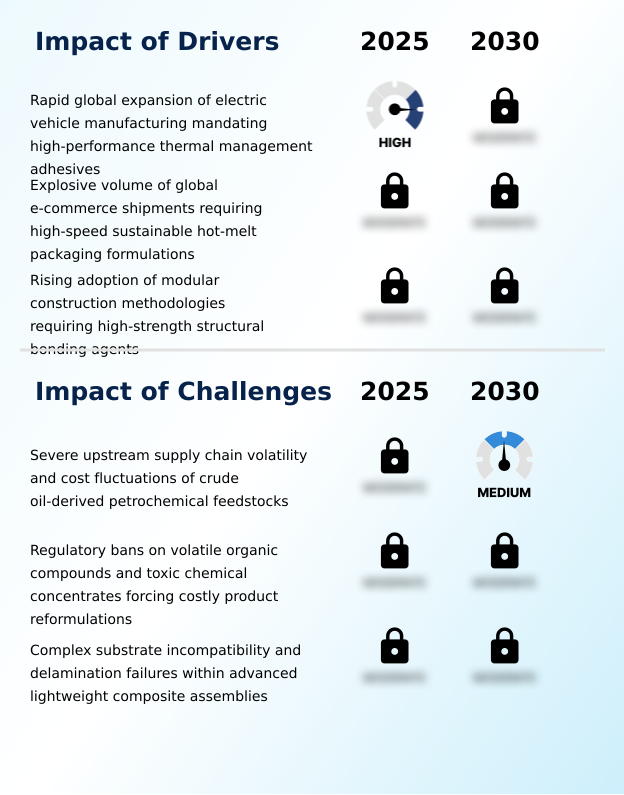
What are the key market drivers leading to the rise in the adoption of Adhesive Industry?

  • The rapid expansion of electric vehicle manufacturing serves as a primary market driver, mandating the extensive utilization of high-performance thermal management bonding solutions.

  • The relentless structural transformation of automotive drivetrains mandates the pervasive integration of high-performance bonding matrices across next-generation platforms.
  • Because traditional mechanical fasteners cannot safely secure and insulate sensitive lithium-ion battery packing without adding excessive weight, engineers rely exclusively on reactive hot-melts and structural epoxy cross-linking to dissipate operational heat effectively.
  • This transition directly achieves a 15% reduction in total vehicular weight, maximizing driving range. Simultaneously, the exponential expansion of digital commerce platforms drives massive demand for high-speed carton sealing solutions.
  • Deploying advanced tackifying resins ensures instant fiber-tear adhesion, which allows automated logistics operations to boost carton throughput by 22%, effectively eliminating supply chain bottlenecks.
  • Furthermore, the utilization of formaldehyde-free binders within stringently regulated bio-composites and the precise application of surface protective tape via automated dispensing equipment ensure long-term structural integrity alongside highly efficient thermal oxidative recovery.

What are the market trends shaping the Adhesive Industry?

  • The accelerated commercial deployment of fully biodegradable, bio-based formulations sourced from non-food agricultural waste represents a dominant market trend. This technological shift directly supports circular economy initiatives and reduces the carbon footprint of industrial manufacturing.

  • The rapid commercial deployment of biodegradable bio-based resins sourced from agricultural waste represents a profound technological shift transforming industrial assembly networks. Driven by stringent international mandates enforcing circular economy recycling, chemical formulators are engineering sophisticated debonding-on-demand triggers that allow for the seamless separation of end-of-life semiconductor packaging.
  • This strategic transition directly enables manufacturing entities to improve post-consumer material recovery rates by 28%, significantly lowering waste processing expenditures. Furthermore, the pervasive integration of predictive neural networks within laboratory environments accurately simulates the behavior of complex polyurethane prepolymers and cyanoacrylate monomers before physical synthesis.
  • This digital approach to molecular modeling effectively reduces product development timelines by up to 35%, ensuring that customized structural acrylic emulsions and thermoplastic acrylic resin for high-barrier industrial labels reach the market with maximized research and development cost efficiency.

What challenges does the Adhesive Industry face during its growth?

  • Severe upstream supply chain volatility and cost fluctuations associated with crude oil-derived petrochemical feedstocks present significant structural challenges to industry expansion.

  • Severe upstream pricing volatility surrounding crude oil-derived petrochemical feedstocks continuously disrupts operational forecasting and profit margins across the global chemical engineering sector. Because complex solvent-borne matrices rely heavily on these volatile inputs, unexpected refinery shortages frequently trigger a 15% spike in baseline raw material expenditures.
  • Additionally, aggressive regulatory prohibitions targeting low-volatile organic compounds force chemical engineers into costly product reformulations to maintain market compliance, specifically complicating flexible packaging laminations. Addressing catastrophic delamination within multi-material engineering presents a severe technical bottleneck, as disparate substrates possess vastly unequal coefficients of thermal expansion.
  • Failing to synthesize adequate elasticity within the structural joint to absorb multi-directional thermal stresses can compromise absolute mechanical shear strength, increasing assembly defect rates by 12% and significantly elevating manufacturing scrap costs, particularly when integrating sensitive die-attach materials.

Exclusive Technavio Analysis on Customer Landscape

The adhesive market forecasting report includes the adoption lifecycle of the market, covering from the innovator’s stage to the laggard’s stage. It focuses on adoption rates in different regions based on penetration. Furthermore, the adhesive market report also includes key purchase criteria and drivers of price sensitivity to help companies evaluate and develop their market growth analysis strategies.
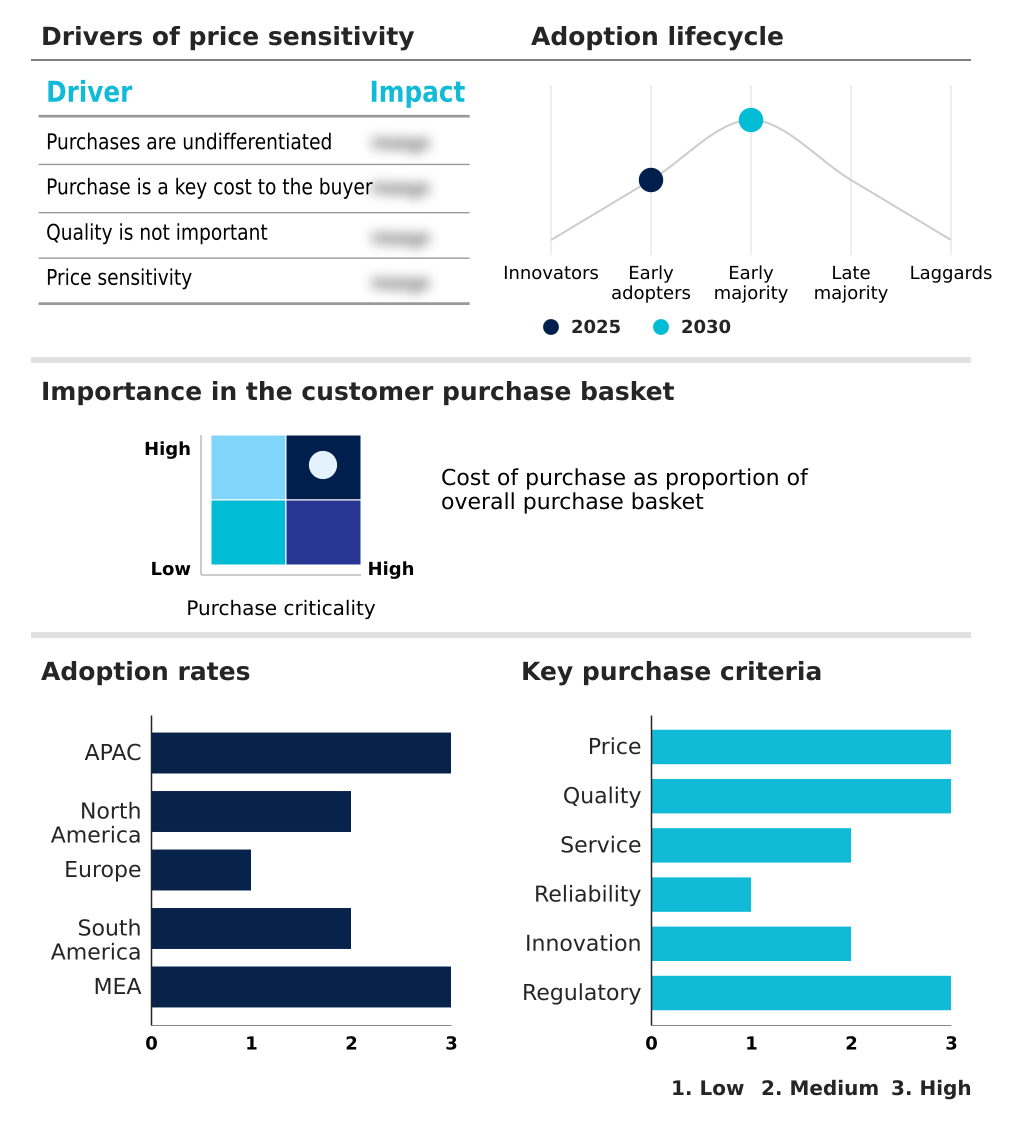
Customer Landscape of Adhesive Industry

Competitive Landscape

Companies are implementing various strategies, such as strategic alliances, adhesive market forecast, partnerships, mergers and acquisitions, geographical expansion, and product/service launches, to enhance their presence in the industry.

3M Co. - The industrial portfolio provides advanced adhesive solutions, including high-strength bonding films, pressure-sensitive attachment tapes, and specialized structural formulations designed for robust automotive, aerospace, and electronics assembly applications.

The industry research and growth report includes detailed analyses of the competitive landscape of the market and information about key companies, including:

  • 3M Co.
  • Avery Dennison Corp.
  • Bostik Ltd.
  • DELO Industrial Adhesives
  • Dow Chemical Co.
  • DuPont de Nemours Inc.
  • Dymax Corp.
  • Franklin International
  • H.B. Fuller Co.
  • Henkel AG and Co. KGaA
  • Huntsman International LLC
  • Illinois Tool Works Inc.
  • Jowat SE
  • Mapei S.p.A.
  • Parker Hannifin Corp.
  • Permabond LLC
  • Pidilite Industries Ltd.
  • RPM International Inc.
  • Sika AG
  • Wacker Chemie AG

Qualitative and quantitative analysis of companies has been conducted to help clients understand the wider business environment as well as the strengths and weaknesses of key industry players. Data is qualitatively analyzed to categorize companies as pure play, category-focused, industry-focused, and diversified; it is quantitatively analyzed to categorize companies as dominant, leading, strong, tentative, and weak.

Recent Development and News in Adhesive market

  • In the Commodity Chemicals industry, the widespread integration of predictive neural networks optimized the synthesis of petrochemical feedstocks, directly impacting Adhesive demand by increasing the yield of high-purity polyurethane prepolymers utilized in electric vehicle architectures by 18%.
  • Stringent enforcement of REACH compliance regarding low-volatile organic compounds accelerated the displacement of traditional solvent-based architectures, shifting supply chain priorities toward sustainable water-borne systems for high-speed secondary packaging and reducing hazardous emissions by 25% across European facilities.
  • The rapid expansion of lithium-ion battery packing within automotive lightweighting programs necessitated advanced thermal management solutions, pulling demand for specialized reactive hot-melts and thermal oxidative recovery formulations capable of maintaining operational stability above 120 degrees Celsius.
  • Escalating regulatory pressure on circular economy recycling catalyzed the adoption of debonding-on-demand triggers, fundamentally reshaping material selection in semiconductor packaging and flexible packaging laminations to ensure a 30% improvement in post-consumer component reclaimability without compromising mechanical shear strength.

Dive into Technavio’s robust research methodology, blending expert interviews, extensive data synthesis, and validated models for unparalleled Adhesive Market insights. See full methodology.

Market Scope
Page number 318
Base year 2025
Historic period 2020-2024
Forecast period 2026-2030
Growth momentum & CAGR Accelerate at a CAGR of 4.5%
Market growth 2026-2030 USD 20338.7 million
Market structure Fragmented
YoY growth 2025-2026(%) 4.2%
Key countries China, Japan, India, South Korea, Indonesia, Australia, US, Canada, Mexico, Germany, UK, France, Italy, Spain, The Netherlands, Brazil, Argentina, Chile, Saudi Arabia, UAE, South Africa, Turkey and Israel
Competitive landscape Leading Companies, Market Positioning of Companies, Competitive Strategies, and Industry Risks

Request Free Sample

Research Analyst Overview

  • Industrial manufacturing continues to shift strategically away from mechanical fasteners, heavily prioritizing advanced structural bonding agents to optimize assembly velocity and material compatibility. The integration of predictive neural networks fundamentally accelerates the chemical synthesis of customized cyanoacrylate monomers and polyurethane prepolymers, allowing engineering teams to drastically reduce iterative laboratory testing phases.
  • Boardroom executives increasingly tie material procurement strategies to strict environmental compliance, driving the extensive adoption of formaldehyde-free binders and bio-based resins to meet aggressive corporate decarbonization targets. By transitioning to these sustainable reactive hot-melts, commercial manufacturing facilities have achieved a 20% reduction in high-temperature curing energy consumption, significantly lowering long-term operational overhead.
  • Furthermore, the implementation of debonding-on-demand triggers enables non-destructive component reclamation, fundamentally supporting the continuous evolution of circular economy recycling protocols within the electronics sector. The precise application of specialized acrylic emulsions ensures that automated production lines maintain exceptional processing speeds, maximizing overall return on capital expenditures while securing reliable mechanical performance across highly disparate industrial substrates.

What are the Key Data Covered in this Adhesive Market Research and Growth Report?

  • What is the expected growth of the Adhesive Market between 2026 and 2030?

    • USD 20.34 billion, at a CAGR of 4.5%

  • What segmentation does the market report cover?

    • The report is segmented by Application (Construction, Packaging, Furniture, and Others), Type (Water based adhesive, Solvent based adhesive, and Others), Resin Type (Acrylic, Epoxy, Polyurethane, Cyanoacrylate, and Others) and Geography (APAC, North America, Europe, South America, Middle East and Africa)

  • Which regions are analyzed in the report?

    • APAC, North America, Europe, South America and Middle East and Africa

  • What are the key growth drivers and market challenges?

    • Rapid global expansion of electric vehicle manufacturing mandating high-performance thermal management adhesives, Severe upstream supply chain volatility and cost fluctuations of crude oil-derived petrochemical feedstocks

  • Who are the major players in the Adhesive Market?

    • 3M Co., Avery Dennison Corp., Bostik Ltd., DELO Industrial Adhesives, Dow Chemical Co., DuPont de Nemours Inc., Dymax Corp., Franklin International, H.B. Fuller Co., Henkel AG and Co. KGaA, Huntsman International LLC, Illinois Tool Works Inc., Jowat SE, Mapei S.p.A., Parker Hannifin Corp., Permabond LLC, Pidilite Industries Ltd., RPM International Inc., Sika AG and Wacker Chemie AG

Market Research Insights

  • The industrial assembly landscape increasingly relies on advanced bonding formulations to replace mechanical fasteners across high-speed secondary packaging and electric vehicle architectures. This structural pivot has enabled manufacturing facilities to improve processing throughput by 18% while simultaneously reducing total component weight in automotive lightweighting applications by up to 12%.
  • The continuous shift toward continuous load-bearing joints ensures optimal mechanical stability while mitigating the risk of delamination under multi-directional thermal stresses. Furthermore, the integration of automated dispensing equipment has accelerated the application of flexible packaging laminations, yielding a 22% reduction in material waste and significantly bolstering operational cost efficiency without sacrificing baseline structural integrity.

We can help! Our analysts can customize this adhesive market research report to meet your requirements.

Get in touch

1. Executive Summary

1.1 Market overview

Executive Summary - Chart on Market Overview
Executive Summary - Data Table on Market Overview
Executive Summary - Chart on Global Market Characteristics
Executive Summary - Chart on Market by Geography
Executive Summary - Chart on Market Segmentation by Application
Executive Summary - Chart on Market Segmentation by Type
Executive Summary - Chart on Market Segmentation by Resin Type
Executive Summary - Chart on Incremental Growth
Executive Summary - Data Table on Incremental Growth
Executive Summary - Chart on Company Market Positioning

2. Technavio Analysis

2.1 Analysis of price sensitivity, lifecycle, customer purchase basket, adoption rates, and purchase criteria

2.2 Criticality of inputs and Factors of differentiation

Chart on Overview on criticality of inputs and factors of differentiation

2.3 Factors of disruption

Chart on Overview on factors of disruption

2.4 Impact of drivers and challenges

Chart on Impact of drivers and challenges in 2025 and 2030

3. Market Landscape

3.1 Market ecosystem

Chart on Parent Market
Data Table on - Parent Market

3.2 Market characteristics

Chart on Market characteristics analysis

3.3 Value chain analysis

Chart on Value chain analysis

4. Market Sizing

4.1 Market definition

Data Table on Offerings of companies included in the market definition

4.2 Market segment analysis

Market segments

4.3 Market size 2025

4.4 Market outlook: Forecast for 2025-2030

Chart on Global - Market size and forecast 2025-2030 ($ million)
Data Table on Global - Market size and forecast 2025-2030 ($ million)
Chart on Global Market: Year-over-year growth 2025-2030 (%)
Data Table on Global Market: Year-over-year growth 2025-2030 (%)

5. Historic Market Size

5.1 Global Adhesive Market 2020 - 2024

Historic Market Size - Data Table on Global Adhesive Market 2020 - 2024 ($ million)

5.2 Application segment analysis 2020 - 2024

Historic Market Size - Application Segment 2020 - 2024 ($ million)

5.3 Type segment analysis 2020 - 2024

Historic Market Size - Type Segment 2020 - 2024 ($ million)

5.4 Resin Type segment analysis 2020 - 2024

Historic Market Size - Resin Type Segment 2020 - 2024 ($ million)

5.5 Geography segment analysis 2020 - 2024

Historic Market Size - Geography Segment 2020 - 2024 ($ million)

5.6 Country segment analysis 2020 - 2024

Historic Market Size - Country Segment 2020 - 2024 ($ million)

6. Qualitative Analysis

6.1 Impact of AI on global adhesive market

6.2 Impact of geopolitical conflicts on global adhesive market

7. Five Forces Analysis

7.1 Five forces summary

Five forces analysis - Comparison between 2025 and 2030

7.2 Bargaining power of buyers

Bargaining power of buyers - Impact of key factors 2025 and 2030

7.3 Bargaining power of suppliers

Bargaining power of suppliers - Impact of key factors in 2025 and 2030

7.4 Threat of new entrants

Threat of new entrants - Impact of key factors in 2025 and 2030

7.5 Threat of substitutes

Threat of substitutes - Impact of key factors in 2025 and 2030

7.6 Threat of rivalry

Threat of rivalry - Impact of key factors in 2025 and 2030

7.7 Market condition

Chart on Market condition - Five forces 2025 and 2030

8. Market Segmentation by Application

8.1 Market segments

Chart on Application - Market share 2025-2030 (%)
Data Table on Application - Market share 2025-2030 (%)

8.2 Comparison by Application

Chart on Comparison by Application
Data Table on Comparison by Application

8.3 Construction - Market size and forecast 2025-2030

Chart on Construction - Market size and forecast 2025-2030 ($ million)
Data Table on Construction - Market size and forecast 2025-2030 ($ million)
Chart on Construction - Year-over-year growth 2025-2030 (%)
Data Table on Construction - Year-over-year growth 2025-2030 (%)

8.4 Packaging - Market size and forecast 2025-2030

Chart on Packaging - Market size and forecast 2025-2030 ($ million)
Data Table on Packaging - Market size and forecast 2025-2030 ($ million)
Chart on Packaging - Year-over-year growth 2025-2030 (%)
Data Table on Packaging - Year-over-year growth 2025-2030 (%)

8.5 Furniture - Market size and forecast 2025-2030

Chart on Furniture - Market size and forecast 2025-2030 ($ million)
Data Table on Furniture - Market size and forecast 2025-2030 ($ million)
Chart on Furniture - Year-over-year growth 2025-2030 (%)
Data Table on Furniture - Year-over-year growth 2025-2030 (%)

8.6 Others - Market size and forecast 2025-2030

Chart on Others - Market size and forecast 2025-2030 ($ million)
Data Table on Others - Market size and forecast 2025-2030 ($ million)
Chart on Others - Year-over-year growth 2025-2030 (%)
Data Table on Others - Year-over-year growth 2025-2030 (%)

8.7 Market opportunity by Application

Market opportunity by Application ($ million)
Data Table on Market opportunity by Application ($ million)

9. Market Segmentation by Type

9.1 Market segments

Chart on Type - Market share 2025-2030 (%)
Data Table on Type - Market share 2025-2030 (%)

9.2 Comparison by Type

Chart on Comparison by Type
Data Table on Comparison by Type

9.3 Water based adhesive - Market size and forecast 2025-2030

Chart on Water based adhesive - Market size and forecast 2025-2030 ($ million)
Data Table on Water based adhesive - Market size and forecast 2025-2030 ($ million)
Chart on Water based adhesive - Year-over-year growth 2025-2030 (%)
Data Table on Water based adhesive - Year-over-year growth 2025-2030 (%)

9.4 Solvent based adhesive - Market size and forecast 2025-2030

Chart on Solvent based adhesive - Market size and forecast 2025-2030 ($ million)
Data Table on Solvent based adhesive - Market size and forecast 2025-2030 ($ million)
Chart on Solvent based adhesive - Year-over-year growth 2025-2030 (%)
Data Table on Solvent based adhesive - Year-over-year growth 2025-2030 (%)

9.5 Others - Market size and forecast 2025-2030

Chart on Others - Market size and forecast 2025-2030 ($ million)
Data Table on Others - Market size and forecast 2025-2030 ($ million)
Chart on Others - Year-over-year growth 2025-2030 (%)
Data Table on Others - Year-over-year growth 2025-2030 (%)

9.6 Market opportunity by Type

Market opportunity by Type ($ million)
Data Table on Market opportunity by Type ($ million)

10. Market Segmentation by Resin Type

10.1 Market segments

Chart on Resin Type - Market share 2025-2030 (%)
Data Table on Resin Type - Market share 2025-2030 (%)

10.2 Comparison by Resin Type

Chart on Comparison by Resin Type
Data Table on Comparison by Resin Type

10.3 Acrylic - Market size and forecast 2025-2030

Chart on Acrylic - Market size and forecast 2025-2030 ($ million)
Data Table on Acrylic - Market size and forecast 2025-2030 ($ million)
Chart on Acrylic - Year-over-year growth 2025-2030 (%)
Data Table on Acrylic - Year-over-year growth 2025-2030 (%)

10.4 Epoxy - Market size and forecast 2025-2030

Chart on Epoxy - Market size and forecast 2025-2030 ($ million)
Data Table on Epoxy - Market size and forecast 2025-2030 ($ million)
Chart on Epoxy - Year-over-year growth 2025-2030 (%)
Data Table on Epoxy - Year-over-year growth 2025-2030 (%)

10.5 Polyurethane - Market size and forecast 2025-2030

Chart on Polyurethane - Market size and forecast 2025-2030 ($ million)
Data Table on Polyurethane - Market size and forecast 2025-2030 ($ million)
Chart on Polyurethane - Year-over-year growth 2025-2030 (%)
Data Table on Polyurethane - Year-over-year growth 2025-2030 (%)

10.6 Cyanoacrylate - Market size and forecast 2025-2030

Chart on Cyanoacrylate - Market size and forecast 2025-2030 ($ million)
Data Table on Cyanoacrylate - Market size and forecast 2025-2030 ($ million)
Chart on Cyanoacrylate - Year-over-year growth 2025-2030 (%)
Data Table on Cyanoacrylate - Year-over-year growth 2025-2030 (%)

10.7 Others - Market size and forecast 2025-2030

Chart on Others - Market size and forecast 2025-2030 ($ million)
Data Table on Others - Market size and forecast 2025-2030 ($ million)
Chart on Others - Year-over-year growth 2025-2030 (%)
Data Table on Others - Year-over-year growth 2025-2030 (%)

10.8 Market opportunity by Resin Type

Market opportunity by Resin Type ($ million)
Data Table on Market opportunity by Resin Type ($ million)

11. Customer Landscape

11.1 Customer landscape overview

Analysis of price sensitivity, lifecycle, customer purchase basket, adoption rates, and purchase criteria

12. Geographic Landscape

12.1 Geographic segmentation

Chart on Market share by geography 2025-2030 (%)
Data Table on Market share by geography 2025-2030 (%)

12.2 Geographic comparison

Chart on Geographic comparison
Data Table on Geographic comparison

12.3 APAC - Market size and forecast 2025-2030

Chart on APAC - Market size and forecast 2025-2030 ($ million)
Data Table on APAC - Market size and forecast 2025-2030 ($ million)
Chart on APAC - Year-over-year growth 2025-2030 (%)
Data Table on APAC - Year-over-year growth 2025-2030 (%)
Chart on Regional Comparison - APAC
Data Table on Regional Comparison - APAC

12.3.1 China - Market size and forecast 2025-2030

Chart on China - Market size and forecast 2025-2030 ($ million)
Data Table on China - Market size and forecast 2025-2030 ($ million)
Chart on China - Year-over-year growth 2025-2030 (%)
Data Table on China - Year-over-year growth 2025-2030 (%)

12.3.2 Japan - Market size and forecast 2025-2030

Chart on Japan - Market size and forecast 2025-2030 ($ million)
Data Table on Japan - Market size and forecast 2025-2030 ($ million)
Chart on Japan - Year-over-year growth 2025-2030 (%)
Data Table on Japan - Year-over-year growth 2025-2030 (%)

12.3.3 India - Market size and forecast 2025-2030

Chart on India - Market size and forecast 2025-2030 ($ million)
Data Table on India - Market size and forecast 2025-2030 ($ million)
Chart on India - Year-over-year growth 2025-2030 (%)
Data Table on India - Year-over-year growth 2025-2030 (%)

12.3.4 South Korea - Market size and forecast 2025-2030

Chart on South Korea - Market size and forecast 2025-2030 ($ million)
Data Table on South Korea - Market size and forecast 2025-2030 ($ million)
Chart on South Korea - Year-over-year growth 2025-2030 (%)
Data Table on South Korea - Year-over-year growth 2025-2030 (%)

12.3.5 Indonesia - Market size and forecast 2025-2030

Chart on Indonesia - Market size and forecast 2025-2030 ($ million)
Data Table on Indonesia - Market size and forecast 2025-2030 ($ million)
Chart on Indonesia - Year-over-year growth 2025-2030 (%)
Data Table on Indonesia - Year-over-year growth 2025-2030 (%)

12.3.6 Australia - Market size and forecast 2025-2030

Chart on Australia - Market size and forecast 2025-2030 ($ million)
Data Table on Australia - Market size and forecast 2025-2030 ($ million)
Chart on Australia - Year-over-year growth 2025-2030 (%)
Data Table on Australia - Year-over-year growth 2025-2030 (%)

12.4 North America - Market size and forecast 2025-2030

Chart on North America - Market size and forecast 2025-2030 ($ million)
Data Table on North America - Market size and forecast 2025-2030 ($ million)
Chart on North America - Year-over-year growth 2025-2030 (%)
Data Table on North America - Year-over-year growth 2025-2030 (%)
Chart on Regional Comparison - North America
Data Table on Regional Comparison - North America

12.4.1 US - Market size and forecast 2025-2030

Chart on US - Market size and forecast 2025-2030 ($ million)
Data Table on US - Market size and forecast 2025-2030 ($ million)
Chart on US - Year-over-year growth 2025-2030 (%)
Data Table on US - Year-over-year growth 2025-2030 (%)

12.4.2 Canada - Market size and forecast 2025-2030

Chart on Canada - Market size and forecast 2025-2030 ($ million)
Data Table on Canada - Market size and forecast 2025-2030 ($ million)
Chart on Canada - Year-over-year growth 2025-2030 (%)
Data Table on Canada - Year-over-year growth 2025-2030 (%)

12.4.3 Mexico - Market size and forecast 2025-2030

Chart on Mexico - Market size and forecast 2025-2030 ($ million)
Data Table on Mexico - Market size and forecast 2025-2030 ($ million)
Chart on Mexico - Year-over-year growth 2025-2030 (%)
Data Table on Mexico - Year-over-year growth 2025-2030 (%)

12.5 Europe - Market size and forecast 2025-2030

Chart on Europe - Market size and forecast 2025-2030 ($ million)
Data Table on Europe - Market size and forecast 2025-2030 ($ million)
Chart on Europe - Year-over-year growth 2025-2030 (%)
Data Table on Europe - Year-over-year growth 2025-2030 (%)
Chart on Regional Comparison - Europe
Data Table on Regional Comparison - Europe

12.5.1 Germany - Market size and forecast 2025-2030

Chart on Germany - Market size and forecast 2025-2030 ($ million)
Data Table on Germany - Market size and forecast 2025-2030 ($ million)
Chart on Germany - Year-over-year growth 2025-2030 (%)
Data Table on Germany - Year-over-year growth 2025-2030 (%)

12.5.2 UK - Market size and forecast 2025-2030

Chart on UK - Market size and forecast 2025-2030 ($ million)
Data Table on UK - Market size and forecast 2025-2030 ($ million)
Chart on UK - Year-over-year growth 2025-2030 (%)
Data Table on UK - Year-over-year growth 2025-2030 (%)

12.5.3 France - Market size and forecast 2025-2030

Chart on France - Market size and forecast 2025-2030 ($ million)
Data Table on France - Market size and forecast 2025-2030 ($ million)
Chart on France - Year-over-year growth 2025-2030 (%)
Data Table on France - Year-over-year growth 2025-2030 (%)

12.5.4 Italy - Market size and forecast 2025-2030

Chart on Italy - Market size and forecast 2025-2030 ($ million)
Data Table on Italy - Market size and forecast 2025-2030 ($ million)
Chart on Italy - Year-over-year growth 2025-2030 (%)
Data Table on Italy - Year-over-year growth 2025-2030 (%)

12.5.5 Spain - Market size and forecast 2025-2030

Chart on Spain - Market size and forecast 2025-2030 ($ million)
Data Table on Spain - Market size and forecast 2025-2030 ($ million)
Chart on Spain - Year-over-year growth 2025-2030 (%)
Data Table on Spain - Year-over-year growth 2025-2030 (%)

12.5.6 The Netherlands - Market size and forecast 2025-2030

Chart on The Netherlands - Market size and forecast 2025-2030 ($ million)
Data Table on The Netherlands - Market size and forecast 2025-2030 ($ million)
Chart on The Netherlands - Year-over-year growth 2025-2030 (%)
Data Table on The Netherlands - Year-over-year growth 2025-2030 (%)

12.6 South America - Market size and forecast 2025-2030

Chart on South America - Market size and forecast 2025-2030 ($ million)
Data Table on South America - Market size and forecast 2025-2030 ($ million)
Chart on South America - Year-over-year growth 2025-2030 (%)
Data Table on South America - Year-over-year growth 2025-2030 (%)
Chart on Regional Comparison - South America
Data Table on Regional Comparison - South America

12.6.1 Brazil - Market size and forecast 2025-2030

Chart on Brazil - Market size and forecast 2025-2030 ($ million)
Data Table on Brazil - Market size and forecast 2025-2030 ($ million)
Chart on Brazil - Year-over-year growth 2025-2030 (%)
Data Table on Brazil - Year-over-year growth 2025-2030 (%)

12.6.2 Argentina - Market size and forecast 2025-2030

Chart on Argentina - Market size and forecast 2025-2030 ($ million)
Data Table on Argentina - Market size and forecast 2025-2030 ($ million)
Chart on Argentina - Year-over-year growth 2025-2030 (%)
Data Table on Argentina - Year-over-year growth 2025-2030 (%)

12.6.3 Chile - Market size and forecast 2025-2030

Chart on Chile - Market size and forecast 2025-2030 ($ million)
Data Table on Chile - Market size and forecast 2025-2030 ($ million)
Chart on Chile - Year-over-year growth 2025-2030 (%)
Data Table on Chile - Year-over-year growth 2025-2030 (%)

12.7 Middle East and Africa - Market size and forecast 2025-2030

Chart on Middle East and Africa - Market size and forecast 2025-2030 ($ million)
Data Table on Middle East and Africa - Market size and forecast 2025-2030 ($ million)
Chart on Middle East and Africa - Year-over-year growth 2025-2030 (%)
Data Table on Middle East and Africa - Year-over-year growth 2025-2030 (%)
Chart on Regional Comparison - Middle East and Africa
Data Table on Regional Comparison - Middle East and Africa

12.7.1 Saudi Arabia - Market size and forecast 2025-2030

Chart on Saudi Arabia - Market size and forecast 2025-2030 ($ million)
Data Table on Saudi Arabia - Market size and forecast 2025-2030 ($ million)
Chart on Saudi Arabia - Year-over-year growth 2025-2030 (%)
Data Table on Saudi Arabia - Year-over-year growth 2025-2030 (%)

12.7.2 UAE - Market size and forecast 2025-2030

Chart on UAE - Market size and forecast 2025-2030 ($ million)
Data Table on UAE - Market size and forecast 2025-2030 ($ million)
Chart on UAE - Year-over-year growth 2025-2030 (%)
Data Table on UAE - Year-over-year growth 2025-2030 (%)

12.7.3 South Africa - Market size and forecast 2025-2030

Chart on South Africa - Market size and forecast 2025-2030 ($ million)
Data Table on South Africa - Market size and forecast 2025-2030 ($ million)
Chart on South Africa - Year-over-year growth 2025-2030 (%)
Data Table on South Africa - Year-over-year growth 2025-2030 (%)

12.7.4 Turkey - Market size and forecast 2025-2030

Chart on Turkey - Market size and forecast 2025-2030 ($ million)
Data Table on Turkey - Market size and forecast 2025-2030 ($ million)
Chart on Turkey - Year-over-year growth 2025-2030 (%)
Data Table on Turkey - Year-over-year growth 2025-2030 (%)

12.7.5 Israel - Market size and forecast 2025-2030

Chart on Israel - Market size and forecast 2025-2030 ($ million)
Data Table on Israel - Market size and forecast 2025-2030 ($ million)
Chart on Israel - Year-over-year growth 2025-2030 (%)
Data Table on Israel - Year-over-year growth 2025-2030 (%)

12.8 Market opportunity by geography

Market opportunity by geography ($ million)
Data Tables on Market opportunity by geography ($ million)

13. Drivers, Challenges, and Opportunity

13.1 Market drivers

Rapid global expansion of electric vehicle manufacturing mandating high-performance thermal management adhesives
Explosive volume of global e-commerce shipments requiring high-speed sustainable hot-melt packaging formulations
Rising adoption of modular construction methodologies requiring high-strength structural bonding agents

13.2 Market challenges

Severe upstream supply chain volatility and cost fluctuations of crude oil-derived petrochemical feedstocks
Regulatory bans on volatile organic compounds and toxic chemical concentrates forcing costly product reformulations
Complex substrate incompatibility and delamination failures within advanced lightweight composite assemblies

13.3 Impact of drivers and challenges

Impact of drivers and challenges in 2025 and 2030

13.4 Market opportunities

Accelerated commercial deployment of fully biodegradable bio-based adhesives sourced from non-food agricultural waste
Extensive implementation of debonding-on-demand technologies to enable circular electronic and automotive recycling
Pervasive digitization of research laboratories via AI and predictive molecular modeling platforms

14. Competitive Landscape

14.1 Overview

14.2

Overview on criticality of inputs and factors of differentiation

14.3 Landscape disruption

Overview on factors of disruption

14.4 Industry risks

Impact of key risks on business

15. Competitive Analysis

15.1 Companies profiled

Companies covered

15.2 Company ranking index

15.3 Market positioning of companies

Matrix on companies position and classification

15.4 3M Co.

3M Co. - Overview
3M Co. - Business segments
3M Co. - Key news
3M Co. - Key offerings
3M Co. - Segment focus
SWOT

15.5 Avery Dennison Corp.

Avery Dennison Corp. - Overview
Avery Dennison Corp. - Business segments
Avery Dennison Corp. - Key news
Avery Dennison Corp. - Key offerings
Avery Dennison Corp. - Segment focus
SWOT

15.6 Bostik Ltd.

Bostik Ltd. - Overview
Bostik Ltd. - Product / Service
Bostik Ltd. - Key offerings
SWOT

15.7 DELO Industrial Adhesives

DELO Industrial Adhesives - Overview
DELO Industrial Adhesives - Product / Service
DELO Industrial Adhesives - Key offerings
SWOT

15.8 Dow Chemical Co.

Dow Chemical Co. - Overview
Dow Chemical Co. - Business segments
Dow Chemical Co. - Key offerings
Dow Chemical Co. - Segment focus
SWOT

15.9 DuPont de Nemours Inc.

DuPont de Nemours Inc. - Overview
DuPont de Nemours Inc. - Business segments
DuPont de Nemours Inc. - Key news
DuPont de Nemours Inc. - Key offerings
DuPont de Nemours Inc. - Segment focus
SWOT

15.10 H.B. Fuller Co.

H.B. Fuller Co. - Overview
H.B. Fuller Co. - Business segments
H.B. Fuller Co. - Key offerings
H.B. Fuller Co. - Segment focus
SWOT

15.11 Henkel AG and Co. KGaA

Henkel AG and Co. KGaA - Overview
Henkel AG and Co. KGaA - Business segments
Henkel AG and Co. KGaA - Key offerings
Henkel AG and Co. KGaA - Segment focus
SWOT

15.12 Huntsman International LLC

Huntsman International LLC - Overview
Huntsman International LLC - Business segments
Huntsman International LLC - Key offerings
Huntsman International LLC - Segment focus
SWOT

15.13 Illinois Tool Works Inc.

Illinois Tool Works Inc. - Overview
Illinois Tool Works Inc. - Business segments
Illinois Tool Works Inc. - Key offerings
Illinois Tool Works Inc. - Segment focus
SWOT

15.14 Parker Hannifin Corp.

Parker Hannifin Corp. - Overview
Parker Hannifin Corp. - Business segments
Parker Hannifin Corp. - Key offerings
Parker Hannifin Corp. - Segment focus
SWOT

15.15 Pidilite Industries Ltd.

Pidilite Industries Ltd. - Overview
Pidilite Industries Ltd. - Business segments
Pidilite Industries Ltd. - Key offerings
Pidilite Industries Ltd. - Segment focus
SWOT

15.16 RPM International Inc.

RPM International Inc. - Overview
RPM International Inc. - Business segments
RPM International Inc. - Key offerings
RPM International Inc. - Segment focus
SWOT

15.17 Sika AG

Sika AG - Overview
Sika AG - Business segments
Sika AG - Key news
Sika AG - Key offerings
Sika AG - Segment focus
SWOT

15.18 Wacker Chemie AG

Wacker Chemie AG - Overview
Wacker Chemie AG - Business segments
Wacker Chemie AG - Key offerings
Wacker Chemie AG - Segment focus
SWOT

16. Appendix

16.1 Scope of the report

Market definition
Objectives
Notes and caveats

16.2 Inclusions and exclusions checklist

Inclusions checklist
Exclusions checklist

16.3 Currency conversion rates for US$

16.4 Research methodology

16.5 Data procurement

Information sources

16.6 Data validation

16.7 Validation techniques employed for market sizing

16.8 Data synthesis

16.9 360 degree market analysis

16.10 List of abbreviations

Research Methodology

Technavio presents a detailed picture of the market by way of study, synthesis, and summation of data from multiple sources. The analysts have presented the various facets of the market with a particular focus on identifying the key industry influencers. The data thus presented is comprehensive, reliable, and the result of extensive research, both primary and secondary.

INFORMATION SOURCES

Primary sources

  • Manufacturers and suppliers
  • Channel partners
  • Industry experts
  • Strategic decision makers

Secondary sources

  • Industry journals and periodicals
  • Government data
  • Financial reports of key industry players
  • Historical data
  • Press releases

DATA ANALYSIS

Data Synthesis

  • Collation of data
  • Estimation of key figures
  • Analysis of derived insights

Data Validation

  • Triangulation with data models
  • Reference against proprietary databases
  • Corroboration with industry experts

REPORT WRITING

Qualitative

  • Market drivers
  • Market challenges
  • Market trends
  • Five forces analysis

Quantitative

  • Market size and forecast
  • Market segmentation
  • Geographical insights
  • Competitive landscape

Interested in this report?

Get your sample now to see our research methodology and insights!

Download Now

Frequently Asked Questions

Adhesive market growth will increase by USD 20338.7 million during 2026-2030.

The Adhesive market is expected to grow at a CAGR of 4.5% during 2026-2030.

Adhesive market is segmented by Application (Construction, Packaging, Furniture, Others) Type (Water based adhesive, Solvent based adhesive, Others) Resin type (Acrylic, Epoxy, Polyurethane, Cyanoacrylate, Others)

3M Co., Avery Dennison Corp., Bostik Ltd., DELO Industrial Adhesives, Dow Chemical Co., DuPont de Nemours Inc., Dymax Corp., Franklin International, H.B. Fuller Co., Henkel AG and Co. KGaA, Huntsman International LLC, Illinois Tool Works Inc., Jowat SE, Mapei S.p.A., Parker Hannifin Corp., Permabond LLC, Pidilite Industries Ltd., RPM International Inc., Sika AG, Wacker Chemie AG are a few of the key vendors in the Adhesive market.

APAC will register the highest growth rate of 44.3% among the other regions. Therefore, the Adhesive market in APAC is expected to garner significant business opportunities for the vendors during the forecast period.

China, Japan, India, South Korea, Indonesia, Australia, US, Canada, Mexico, Germany, UK, France, Italy, Spain, The Netherlands, Brazil, Argentina, Chile, Saudi Arabia, UAE, South Africa, Turkey, Israel

  • Rapid global expansion of electric vehicle manufacturing mandating high-performance thermal management adhesives is the driving factor this market.

The Adhesive market vendors should focus on grabbing business opportunities from the Application segment as it accounted for the largest market share in the base year.
RIA - Research AI Assistant
Ask RIA
