Vegan Ice Cream Market Analysis, Size, and Forecast 2024-2028: North America (US and Canada), Europe (France, Germany, Italy, and UK), Middle East and Africa (Egypt, KSA, Oman, and UAE), APAC (China, India, and Japan), South America (Argentina and Brazil), and Rest of World (ROW)

Vegan Ice Cream Market Analysis, Size, and Forecast 2024-2028:
North America (US and Canada), Europe (France, Germany, Italy, and UK), Middle East and Africa (Egypt, KSA, Oman, and UAE), APAC (China, India, and Japan), South America (Argentina and Brazil), and Rest of World (ROW)

Published: Oct 2024 148 Pages SKU: IRTNTR43725

Market Overview at a Glance

$1.31 B
Market Opportunity
10%
CAGR
8.9
YoY growth 2023-2024(%)

Vegan Ice Cream Market Size 2024-2028

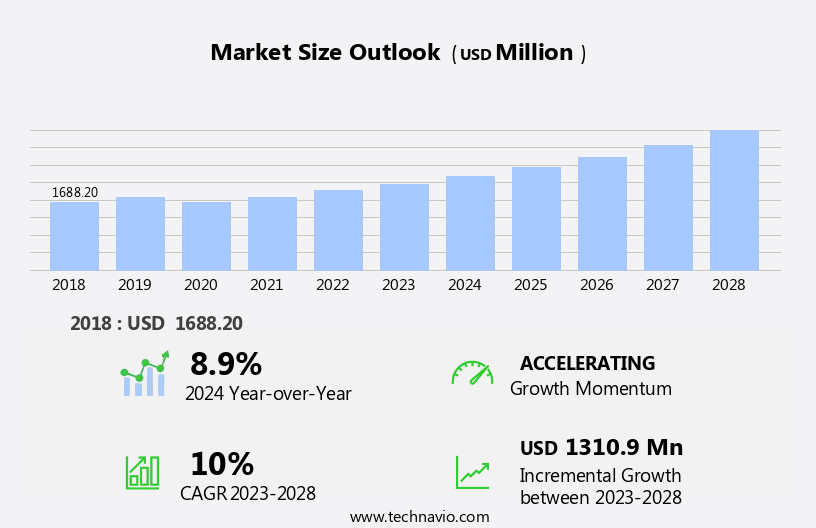
The vegan ice cream market size is forecast to increase by USD 1.31 billion, at a CAGR of 10% between 2023 and 2028.

  • The market is experiencing significant growth, driven by the expanding global population base adhering to vegan diets. This trend is leading companies to innovate and introduce new product offerings to cater to this consumer demographic. Coconut milk, almond milk, cashew milk, and soy milk are some of the common plant-based bases used in vegan ice cream production. However, product recalls pose a significant challenge to market players. In 2020, several vegan ice cream brands faced recalls due to contamination issues, damaging their reputation and sales. To mitigate this risk, companies are investing in robust quality control measures and supply chain transparency. Additionally, collaborations with influencers and partnerships with foodservice outlets are strategic moves to expand market reach and boost brand visibility.
  • The market's dynamics are shaped by these key drivers and challenges, offering opportunities for companies to capitalize on the growing demand for vegan ice cream while navigating potential risks effectively.

What will be the Size of the Vegan Ice Cream Market during the forecast period?

Vegan Ice Cream Market Size

Explore in-depth regional segment analysis with market size data - historical 2018-2022 and forecasts 2024-2028 - in the full report.  
Request Free Sample

The market continues to evolve, driven by consumer preferences for plant-based options and innovative product development. High-protein ice cream variants are gaining traction, utilizing natural food colorings and vegan protein sources to cater to health-conscious consumers. Production efficiency metrics, cold chain management, and texture modification techniques are essential for maintaining product quality and consistency. Emulsifier selection and ingredient sourcing are critical factors in ensuring vegan certification standards are met. Frozen dessert manufacturing involves intricate processes such as homogenization and churning, which require careful optimization for low-fat and low-sugar ice cream formulations. Prevention of freezer burn and maintaining optimal shelf life is a continuous challenge, necessitating the exploration of new packaging materials and shelf-life extension methods.

Natural flavorings and plant-based fat sources are increasingly popular, as are fat reduction strategies. Sensory evaluation methods and food safety regulations play a crucial role in ensuring product quality and consumer safety. Cost optimization strategies are essential for manufacturers to remain competitive in this dynamic market. Dairy-free alternatives continue to expand, with a focus on natural and sustainable ingredients. The ongoing evolution of this market underscores the importance of staying abreast of emerging trends and consumer preferences.

How is this Vegan Ice Cream Industry segmented?

The vegan ice cream industry research report provides comprehensive data (region-wise segment analysis), with forecasts and estimates in "USD million" for the period 2024-2028, as well as historical data from 2018-2022 for the following segments.

  • Product
    • Take home
    • Impulse
    • Artisanal
  • Base Ingredient
    • Almond Milk
    • Coconut Milk
    • Soy Milk
    • Cashew Milk
    • Oat Milk
    • Rice Milk
    • Avocado
    • Other Plant-Based Milks
  • Form
    • Bars
    • Pints/Tubs
    • Sticks
    • Novelties
    • Cones
  • Flavor
    • Vanilla
    • Chocolate
    • Strawberry
    • Coffee
    • Fruit Flavors
    • Nut Flavors
    • Specialty Flavors
  • Packaging Type
    • Cups
    • Cones
    • Tubs
    • Boxes
  • Distribution Channel
    • Supermarkets/Hypermarkets
    • Convenience Stores
    • Online Retail
    • Foodservice
    • Specialty Stores
  • Geography
    • North America
      • US
      • Canada
    • Europe
      • France
      • Germany
      • Italy
      • UK
    • Middle East and Africa
      • Egypt
      • KSA
      • Oman
      • UAE
    • APAC
      • China
      • India
      • Japan
    • South America
      • Argentina
      • Brazil
    • Rest of World (ROW)

By Product Insights

The take home segment is estimated to witness significant growth during the forecast period.

The market is witnessing significant growth due to the increasing preference for plant-based diets and the surge in demand for dairy-free alternatives. In response, manufacturers are innovating with high-protein ice creams, natural food colorings, and texture modification techniques to cater to consumer needs. Production efficiency metrics and cold chain management are crucial considerations to maintain product quality and ensure shelf stability. Emulsifier selection and stabilizer choice are essential for creating the desired texture and preventing ice crystal formation. Ingredient sourcing from reputable suppliers and adherence to vegan certification standards are key to maintaining consumer trust. Freezer burn prevention techniques and proper packaging materials are essential to extend shelf life and maintain product integrity.

Vegan protein sources and fat reduction strategies are also being explored to cater to various dietary preferences. Sensory evaluation methods and food safety regulations are paramount for ensuring product quality and consumer safety. Low-fat and low-sugar ice cream options are gaining popularity, necessitating homogenization techniques and churning process optimization. Shelf-life extension methods and natural flavorings are also being employed to cater to evolving consumer preferences. Cost optimization strategies and plant-based ingredient sourcing are essential for maintaining competitiveness in the market. The frozen dessert manufacturing process is being streamlined through automation and advanced technologies to improve efficiency and reduce costs.

Vegan Ice Cream Market Size

Request Free Sample

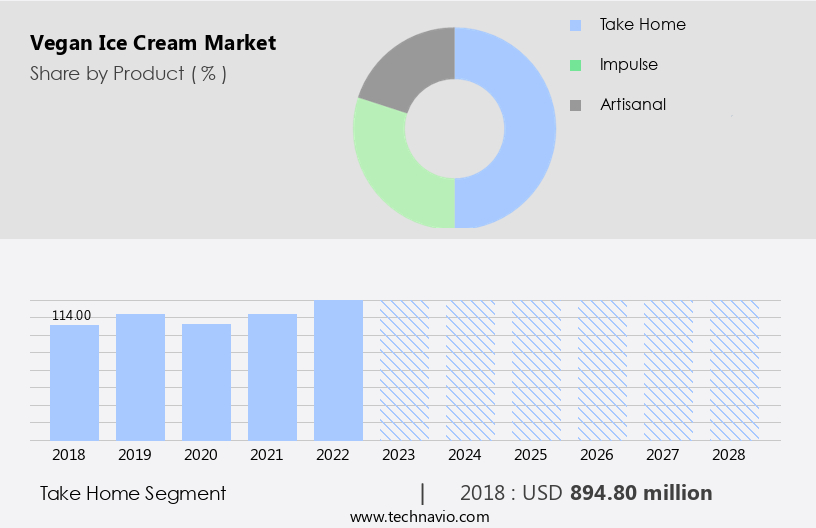
The Take home segment was valued at USD 894.80 million in 2018 and showed a gradual increase during the forecast period.

Regional Analysis

North America is estimated to contribute 34% to the growth of the global market during the forecast period.Technavio's analysts have elaborately explained the regional trends and drivers that shape the market during the forecast period.

Vegan Ice Cream Market Share by Geography

 Request Free Sample

In the evolving world of frozen desserts, the market is witnessing significant advancements. Plant-based ingredients, such as natural food colorings, are increasingly being adopted to cater to consumer preferences. Production efficiency metrics and cold chain management are crucial in maintaining product quality and ensuring consumer satisfaction. Texture modification techniques and emulsifier selection play vital roles in creating the desired consistency and stability. Ingredient sourcing, adhering to vegan certification standards, is essential to meet consumer expectations. Freezer burn prevention strategies are necessary to maintain product freshness and extend shelf life. Vegan fat sources, such as coconut oil and almond milk, are used in place of dairy.

Fat reduction strategies, including the use of low-fat ice cream and sugar reduction techniques, are employed to cater to health-conscious consumers. Homogenization techniques and churning process optimization ensure uniformity and smoothness. Natural flavorings and stabilizer selection contribute to the overall taste and texture of the product. Sensory evaluation methods are employed to assess product quality and consumer appeal. Food safety regulations and quality control procedures are rigorously followed to ensure product safety and consistency. The market is witnessing growth, with North America leading the charge. The US, Canada, and Mexico are major contributors to the market, driven by the expanding vegan population base and increasing awareness of the benefits of plant-based diets.

Cost optimization strategies, including the use of packaging materials and vegan protein sources, are essential for market success. The frozen dessert manufacturing industry continues to innovate, offering consumers a wide range of dairy-free alternatives.

Market Dynamics

The global vegan ice cream market is experiencing unprecedented growth, driven by dynamic vegan ice cream market trends and a rising consumer shift towards plant-based diets. The proliferation of plant-based ice cream and non-dairy ice cream options has broadened consumer choices, with innovative vegan ice cream brands offering diverse flavors. Popular bases like coconut milk ice cream and oat milk ice cream are gaining significant traction, highlighting the versatility of vegan ice cream ingredients. The perceived vegan ice cream benefits, including being lactose-free and often lower in saturated fat, contribute to its appeal. This expanding sector boasts a wide array of vegan ice cream flavors, driving the overall vegan frozen dessert industry. The increasing focus on healthy vegan ice cream and organic vegan ice cream aligns with evolving vegan ice cream consumer preferences, further propelling market expansion.

Our researchers analyzed the data with 2023 as the base year, along with the key drivers, trends, and challenges. A holistic analysis of drivers will help companies refine their marketing strategies to gain a competitive advantage.

What are the key market drivers leading to the rise in the adoption of Vegan Ice Cream Industry?

  • The expanding global vegan population represents a significant market driver, as an increasing number of consumers adopt vegan diets. 
  • The market is experiencing significant growth due to the increasing number of individuals adopting a vegan lifestyle. This trend is driven by both health benefits and ethical reasons. According to recent research, the global vegan population has grown by approximately 300% over the last decade. To cater to this market, manufacturers are employing various strategies such as sugar reduction, homogenization techniques, churning process optimization, and shelf-life extension methods.
  • Natural flavorings and stabilizer selection are also crucial factors in producing high-quality vegan ice cream. These strategies enable the creation of low-sugar, delicious, and long-lasting vegan ice cream products. The market is expected to continue its growth trajectory due to the increasing demand for plant-based food options.

What are the market trends shaping the Vegan Ice Cream Industry?

  • The adoption of strategic business approaches by companies is currently a significant market trend. This includes implementing innovative pricing models, enhancing customer engagement, and leveraging technology to gain a competitive edge.
  • The market is experiencing significant growth due to increasing consumer preferences for plant-based alternatives. companies are focusing on producing high-protein ice creams using natural food colorings to cater to health-conscious consumers. To enhance production efficiency, they are implementing advanced cold chain management systems and texture modification techniques. The selection of appropriate emulsifiers is crucial to maintain the desired texture and mouthfeel of vegan ice creams.
  • companies are also prioritizing ingredient sourcing from ethical and sustainable suppliers to meet the growing demand for vegan products. These strategies are expected to drive market growth during the forecast period. Additionally, the introduction of innovative flavors and packaging styles is attracting a wider consumer base, further fueling market expansion.

What challenges does the Vegan Ice Cream Industry face during its growth?

  • Product recalls pose a significant challenge to industry growth, as companies must address safety concerns and restore consumer trust following the withdrawal of faulty products from the market. 
  • The market experiences significant challenges due to increasing product recalls, which can result from contamination or mislabeling. These incidents negatively impact consumer trust and damage manufacturers' reputations, leading to potential financial liabilities from legal claims. For instance, in July 2024, Van Leeuwen recalled its Vegan Cinnamon flavor due to undeclared peanuts, and in August 2022, General Mills recalled Haagen-Dazs Vanilla ice cream due to the presence of toxic ethylene oxide (ETO) exceeding regulatory thresholds. To mitigate such risks, manufacturers must adhere to stringent vegan certification standards and food safety regulations. Moreover, implementing effective fat reduction strategies using plant-based ingredients and vegan fat sources, as well as employing sensory evaluation methods, can help maintain product quality and consumer satisfaction.
  • Preventing freezer burn is also crucial for maintaining the freshness and texture of vegan ice cream. By prioritizing these measures, manufacturers can build consumer trust and ensure the long-term success of their businesses.

Exclusive Customer Landscape

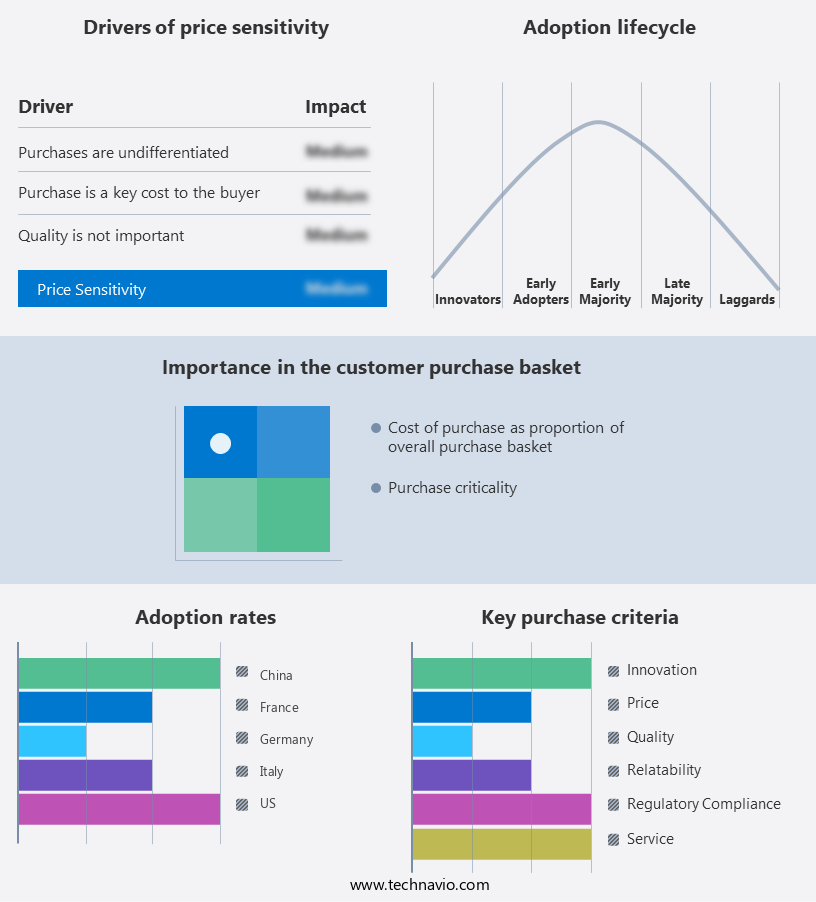
The vegan ice cream market forecasting report includes the adoption lifecycle of the market, covering from the innovator's stage to the laggard's stage. It focuses on adoption rates in different regions based on penetration. Furthermore, the vegan ice cream market report also includes key purchase criteria and drivers of price sensitivity to help companies evaluate and develop their market growth analysis strategies.

Vegan Ice Cream Market Share by Geography

 Customer Landscape

Key Companies & Market Insights

Companies are implementing various strategies, such as strategic alliances, vegan ice cream market forecast, partnerships, mergers and acquisitions, geographical expansion, and product/service launches, to enhance their presence in the industry.

Aurora Foods - This company specializes in producing vegan ice cream, utilizing coconut milk, coconut syrup, peanut butter, cocoa, and vanilla extract as key ingredients. Their offerings cater to consumers seeking plant-based dessert options. The use of natural, recognizable components adds to the product's appeal.

The industry research and growth report includes detailed analyses of the competitive landscape of the market and information about key companies, including:

  • Aurora Foods
  • Bliss Unlimited LLC
  • Compassionate Choices Pvt. Ltd.
  • Coolhaus
  • Danone SA
  • General Mills Inc.
  • JENIS SPLENDID ICE CREAMS LLC
  • Nestle SA
  • Over The Moo
  • The Booja Booja Co. Ltd.
  • The Brooklyn Creamery
  • Tofutti Brands Inc
  • Unilever PLC
  • Valsoia SpA
  • Wells Enterprises Inc.

Qualitative and quantitative analysis of companies has been conducted to help clients understand the wider business environment as well as the strengths and weaknesses of key industry players. Data is qualitatively analyzed to categorize companies as pure play, category-focused, industry-focused, and diversified; it is quantitatively analyzed to categorize companies as dominant, leading, strong, tentative, and weak.

Recent Development and News in Vegan Ice Cream Market

  • In January 2024, Ben & Jerry's, a leading ice cream brand, announced the launch of its new line of vegan ice cream flavors, including "Pint Sized Peace," in collaboration with the Peace Corps. This strategic partnership aimed to promote sustainability and social responsibility (Ben & Jerry's Press Release).
  • In March 2024, Tesco, the UK's largest retailer, revealed its plans to triple its vegan ice cream range, making it the largest vegan ice cream selection among UK supermarkets. This expansion was driven by the growing demand for plant-based alternatives (Tesco Press Release).
  • In April 2025, Unilever, the Anglo-Dutch multinational consumer goods corporation, acquired The Non-Dairy Co., a UK-based vegan ice cream manufacturer. This acquisition was part of Unilever's strategy to expand its plant-based offerings and cater to the increasing consumer preference for vegan products (Unilever Press Release).
  • In May 2025, Nestlé, the world's largest food and beverage company, received regulatory approval for its new vegan ice cream production facility in the Netherlands. This facility, with an annual capacity of 25,000 tons, is expected to strengthen Nestlé's position in the European the market (Nestlé Press Release).

Research Analyst Overview

  • In the dynamic market, competitive landscape assessment plays a crucial role in identifying key players and their strategies. Manufacturers focus on improving freeze-thaw stability through the exploration of cocoa butter alternatives and thickening agents. Melt rate measurement is essential for maintaining creaminess, while pricing strategies and product differentiation are vital for market penetration. Flavor stability testing and retail display strategies are crucial for appealing to the expanding target audience. Customer feedback analysis and sales forecasting inform innovation strategies, such as vegan chocolate production and fruit puree processing.
  • Sweetener selection and nut paste production are critical aspects of supply chain optimization. The product development lifecycle incorporates creaminess assessment and microbial contamination control, while allergen management is essential for maintaining consumer trust. Distribution logistics and market share analysis are key factors in ensuring profitability and growth.

Dive into Technavio's robust research methodology, blending expert interviews, extensive data synthesis, and validated models for unparalleled Vegan Ice Cream Market insights. See full methodology.

Market Scope

Report Coverage

Details

Page number

148

Base year

2023

Historic period

2018-2022

Forecast period

2024-2028

Growth momentum & CAGR

Accelerate at a CAGR of 10%

Market growth 2024-2028

USD 1310.9 million

Market structure

Concentrated

YoY growth 2023-2024(%)

8.9

Key countries

US, Canada, Germany, UK, Italy, France, China, India, Japan, Brazil, Egypt, UAE, Oman, Argentina, KSA, UAE, Brazil, and Rest of World (ROW)

Competitive landscape

Leading Companies, Market Positioning of Companies, Competitive Strategies, and Industry Risks

Request Free Sample

What are the Key Data Covered in this Vegan Ice Cream Market Research and Growth Report?

  • CAGR of the Vegan Ice Cream industry during the forecast period
  • Detailed information on factors that will drive the growth and forecasting between 2024 and 2028
  • Precise estimation of the size of the market and its contribution of the industry in focus to the parent market
  • Accurate predictions about upcoming growth and trends and changes in consumer behaviour
  • Growth of the market across North America, Europe, APAC, South America, and Middle East and Africa
  • Thorough analysis of the market's competitive landscape and detailed information about companies
  • Comprehensive analysis of factors that will challenge the vegan ice cream market growth of industry companies

We can help! Our analysts can customize this vegan ice cream market research report to meet your requirements.

Get in touch

1 Executive Summary

  • 1.1 Market overview
    • Executive Summary - Chart on Market Overview
    • Executive Summary - Data Table on Market Overview
    • Executive Summary - Chart on Global Market Characteristics
    • Executive Summary - Chart on Market by Geography
    • Executive Summary - Chart on Market Segmentation by Product
    • Executive Summary - Chart on Incremental Growth
    • Executive Summary - Data Table on Incremental Growth
    • Executive Summary - Chart on Company Market Positioning

2 Market Landscape

  • 2.1 Market ecosystem
    • Parent Market
    • Data Table on - Parent Market
  • 2.2 Market characteristics
    • Market characteristics analysis
  • 2.3 Value chain analysis
    • Value Chain Analysis

3 Market Sizing

  • 3.1 Market definition
    • Offerings of companies included in the market definition
  • 3.2 Market segment analysis
    • Market segments
  • 3.3 Market size 2023
    • 3.4 Market outlook: Forecast for 2023-2028
      • Chart on Global - Market size and forecast 2023-2028 ($ million)
      • Data Table on Global - Market size and forecast 2023-2028 ($ million)
      • Chart on Global Market: Year-over-year growth 2023-2028 (%)
      • Data Table on Global Market: Year-over-year growth 2023-2028 (%)

    4 Historic Market Size

    • 4.1 Global Vegan Ice Cream Market 2018 - 2022
      • Historic Market Size - Data Table on Global Vegan Ice Cream Market 2018 - 2022 ($ million)
    • 4.2 Product segment analysis 2018 - 2022
      • Historic Market Size - Product Segment 2018 - 2022 ($ million)
    • 4.3 Geography segment analysis 2018 - 2022
      • Historic Market Size - Geography Segment 2018 - 2022 ($ million)
    • 4.4 Country segment analysis 2018 - 2022
      • Historic Market Size - Country Segment 2018 - 2022 ($ million)

    5 Five Forces Analysis

    • 5.1 Five forces summary
      • Five forces analysis - Comparison between 2023 and 2028
    • 5.2 Bargaining power of buyers
      • Bargaining power of buyers - Impact of key factors 2023 and 2028
    • 5.3 Bargaining power of suppliers
      • Bargaining power of suppliers - Impact of key factors in 2023 and 2028
    • 5.4 Threat of new entrants
      • Threat of new entrants - Impact of key factors in 2023 and 2028
    • 5.5 Threat of substitutes
      • Threat of substitutes - Impact of key factors in 2023 and 2028
    • 5.6 Threat of rivalry
      • Threat of rivalry - Impact of key factors in 2023 and 2028
    • 5.7 Market condition
      • Chart on Market condition - Five forces 2023 and 2028

    6 Market Segmentation by Product

    • 6.1 Market segments
      • Chart on Product - Market share (2023-2028) (%)
      • Data Table on Product - Market share (2023-2028) (%)
    • 6.2 Comparison by Product
      • Chart on Comparison by Product
      • Data Table on Comparison by Product
    • 6.3 Take home - Market size and forecast (2023-2028)
      • Chart on Take home - Market size and forecast (2023-2028) ($ million)
      • Data Table on Take home - Market size and forecast (2023-2028) ($ million)
      • Chart on Take home - Year-over-year growth (2023-2028) (%)
      • Data Table on Take home - Year-over-year growth (2023-2028) (%)
    • 6.4 Impulse - Market size and forecast (2023-2028)
      • Chart on Impulse - Market size and forecast (2023-2028) ($ million)
      • Data Table on Impulse - Market size and forecast (2023-2028) ($ million)
      • Chart on Impulse - Year-over-year growth (2023-2028) (%)
      • Data Table on Impulse - Year-over-year growth (2023-2028) (%)
    • 6.5 Artisanal - Market size and forecast (2023-2028)
      • Chart on Artisanal - Market size and forecast (2023-2028) ($ million)
      • Data Table on Artisanal - Market size and forecast (2023-2028) ($ million)
      • Chart on Artisanal - Year-over-year growth (2023-2028) (%)
      • Data Table on Artisanal - Year-over-year growth (2023-2028) (%)
    • 6.6 Market opportunity by Product
      • Market opportunity by Product ($ million)
      • Data Table on Market opportunity by Product ($ million)

    7 Market Segmentation by Base Ingredient

    • 7.1 Market segments
      • Chart on Base Ingredient - Market share (2023-2028) (%)
      • Data Table on Base Ingredient - Market share (2023-2028) (%)
      • Chart on Other Plant-Based Milks - Market size and forecast (2023-2028) ($ million)
      • Data Table on Other Plant-Based Milks - Market size and forecast (2023-2028) ($ million)
      • Chart on Other Plant-Based Milks - Year-over-year growth (2023-2028) (%)
      • Data Table on Other Plant-Based Milks - Year-over-year growth (2023-2028) (%)
    • 7.2 Comparison by Base Ingredient
      • Chart on Comparison by Base Ingredient
      • Data Table on Comparison by Base Ingredient
      • Market opportunity by Base Ingredient ($ million)
      • Data Table on Market opportunity by Base Ingredient ($ million)
    • 7.3 Almond Milk - Market size and forecast (2023-2028)
      • Chart on Almond Milk - Market size and forecast (2023-2028) ($ million)
      • Data Table on Almond Milk - Market size and forecast (2023-2028) ($ million)
      • Chart on Almond Milk - Year-over-year growth (2023-2028) (%)
      • Data Table on Almond Milk - Year-over-year growth (2023-2028) (%)
    • 7.4 Coconut Milk - Market size and forecast (2023-2028)
      • Chart on Coconut Milk - Market size and forecast (2023-2028) ($ million)
      • Data Table on Coconut Milk - Market size and forecast (2023-2028) ($ million)
      • Chart on Coconut Milk - Year-over-year growth (2023-2028) (%)
      • Data Table on Coconut Milk - Year-over-year growth (2023-2028) (%)
    • 7.5 Soy Milk - Market size and forecast (2023-2028)
      • Chart on Soy Milk - Market size and forecast (2023-2028) ($ million)
      • Data Table on Soy Milk - Market size and forecast (2023-2028) ($ million)
      • Chart on Soy Milk - Year-over-year growth (2023-2028) (%)
      • Data Table on Soy Milk - Year-over-year growth (2023-2028) (%)
    • 7.6 Cashew Milk - Market size and forecast (2023-2028)
      • Chart on Cashew Milk - Market size and forecast (2023-2028) ($ million)
      • Data Table on Cashew Milk - Market size and forecast (2023-2028) ($ million)
      • Chart on Cashew Milk - Year-over-year growth (2023-2028) (%)
      • Data Table on Cashew Milk - Year-over-year growth (2023-2028) (%)
    • 7.7 Oat Milk - Market size and forecast (2023-2028)
      • Chart on Oat Milk - Market size and forecast (2023-2028) ($ million)
      • Data Table on Oat Milk - Market size and forecast (2023-2028) ($ million)
      • Chart on Oat Milk - Year-over-year growth (2023-2028) (%)
      • Data Table on Oat Milk - Year-over-year growth (2023-2028) (%)
    • 7.8 Rice Milk - Market size and forecast (2023-2028)
      • Chart on Rice Milk - Market size and forecast (2023-2028) ($ million)
      • Data Table on Rice Milk - Market size and forecast (2023-2028) ($ million)
      • Chart on Rice Milk - Year-over-year growth (2023-2028) (%)
      • Data Table on Rice Milk - Year-over-year growth (2023-2028) (%)
    • 7.9 Avocado - Market size and forecast (2023-2028)
      • Chart on Avocado - Market size and forecast (2023-2028) ($ million)
      • Data Table on Avocado - Market size and forecast (2023-2028) ($ million)
      • Chart on Avocado - Year-over-year growth (2023-2028) (%)
      • Data Table on Avocado - Year-over-year growth (2023-2028) (%)

    8 Market Segmentation by Form

    • 8.1 Market segments
      • Chart on Form - Market share (2023-2028) (%)
      • Data Table on Form - Market share (2023-2028) (%)
    • 8.2 Comparison by Form
      • Chart on Comparison by Form
      • Data Table on Comparison by Form
    • 8.3 Bars - Market size and forecast (2023-2028)
      • Chart on Bars - Market size and forecast (2023-2028) ($ million)
      • Data Table on Bars - Market size and forecast (2023-2028) ($ million)
      • Chart on Bars - Year-over-year growth (2023-2028) (%)
      • Data Table on Bars - Year-over-year growth (2023-2028) (%)
    • 8.4 Pints/Tubs - Market size and forecast (2023-2028)
      • Chart on Pints/Tubs - Market size and forecast (2023-2028) ($ million)
      • Data Table on Pints/Tubs - Market size and forecast (2023-2028) ($ million)
      • Chart on Pints/Tubs - Year-over-year growth (2023-2028) (%)
      • Data Table on Pints/Tubs - Year-over-year growth (2023-2028) (%)
    • 8.5 Sticks - Market size and forecast (2023-2028)
      • Chart on Sticks - Market size and forecast (2023-2028) ($ million)
      • Data Table on Sticks - Market size and forecast (2023-2028) ($ million)
      • Chart on Sticks - Year-over-year growth (2023-2028) (%)
      • Data Table on Sticks - Year-over-year growth (2023-2028) (%)
    • 8.6 Novelties - Market size and forecast (2023-2028)
      • Chart on Novelties - Market size and forecast (2023-2028) ($ million)
      • Data Table on Novelties - Market size and forecast (2023-2028) ($ million)
      • Chart on Novelties - Year-over-year growth (2023-2028) (%)
      • Data Table on Novelties - Year-over-year growth (2023-2028) (%)
    • 8.7 Cones - Market size and forecast (2023-2028)
      • Chart on Cones - Market size and forecast (2023-2028) ($ million)
      • Data Table on Cones - Market size and forecast (2023-2028) ($ million)
      • Chart on Cones - Year-over-year growth (2023-2028) (%)
      • Data Table on Cones - Year-over-year growth (2023-2028) (%)
    • 8.8 Market opportunity by Form
      • Market opportunity by Form ($ million)
      • Data Table on Market opportunity by Form ($ million)

    9 Market Segmentation by Flavor

    • 9.1 Market segments
      • Chart on Flavor - Market share (2023-2028) (%)
      • Data Table on Flavor - Market share (2023-2028) (%)
      • Market opportunity by Flavor ($ million)
      • Data Table on Market opportunity by Flavor ($ million)
    • 9.2 Comparison by Flavor
      • Chart on Comparison by Flavor
      • Data Table on Comparison by Flavor
    • 9.3 Vanilla - Market size and forecast (2023-2028)
      • Chart on Vanilla - Market size and forecast (2023-2028) ($ million)
      • Data Table on Vanilla - Market size and forecast (2023-2028) ($ million)
      • Chart on Vanilla - Year-over-year growth (2023-2028) (%)
      • Data Table on Vanilla - Year-over-year growth (2023-2028) (%)
    • 9.4 Chocolate - Market size and forecast (2023-2028)
      • Chart on Chocolate - Market size and forecast (2023-2028) ($ million)
      • Data Table on Chocolate - Market size and forecast (2023-2028) ($ million)
      • Chart on Chocolate - Year-over-year growth (2023-2028) (%)
      • Data Table on Chocolate - Year-over-year growth (2023-2028) (%)
    • 9.5 Strawberry - Market size and forecast (2023-2028)
      • Chart on Strawberry - Market size and forecast (2023-2028) ($ million)
      • Data Table on Strawberry - Market size and forecast (2023-2028) ($ million)
      • Chart on Strawberry - Year-over-year growth (2023-2028) (%)
      • Data Table on Strawberry - Year-over-year growth (2023-2028) (%)
    • 9.6 Coffee - Market size and forecast (2023-2028)
      • Chart on Coffee - Market size and forecast (2023-2028) ($ million)
      • Data Table on Coffee - Market size and forecast (2023-2028) ($ million)
      • Chart on Coffee - Year-over-year growth (2023-2028) (%)
      • Data Table on Coffee - Year-over-year growth (2023-2028) (%)
    • 9.7 Fruit Flavors - Market size and forecast (2023-2028)
      • Chart on Fruit Flavors - Market size and forecast (2023-2028) ($ million)
      • Data Table on Fruit Flavors - Market size and forecast (2023-2028) ($ million)
      • Chart on Fruit Flavors - Year-over-year growth (2023-2028) (%)
      • Data Table on Fruit Flavors - Year-over-year growth (2023-2028) (%)
    • 9.8 Nut Flavors - Market size and forecast (2023-2028)
      • Chart on Nut Flavors - Market size and forecast (2023-2028) ($ million)
      • Data Table on Nut Flavors - Market size and forecast (2023-2028) ($ million)
      • Chart on Nut Flavors - Year-over-year growth (2023-2028) (%)
      • Data Table on Nut Flavors - Year-over-year growth (2023-2028) (%)
    • 9.9 Specialty Flavors - Market size and forecast (2023-2028)
      • Chart on Specialty Flavors - Market size and forecast (2023-2028) ($ million)
      • Data Table on Specialty Flavors - Market size and forecast (2023-2028) ($ million)
      • Chart on Specialty Flavors - Year-over-year growth (2023-2028) (%)
      • Data Table on Specialty Flavors - Year-over-year growth (2023-2028) (%)

    10 Market Segmentation by Packaging Type

    • 10.1 Market segments
      • Chart on Packaging Type - Market share (2023-2028) (%)
      • Data Table on Packaging Type - Market share (2023-2028) (%)
    • 10.2 Comparison by Packaging Type
      • Chart on Comparison by Packaging Type
      • Data Table on Comparison by Packaging Type
    • 10.3 Cups - Market size and forecast (2023-2028)
      • Chart on Cups - Market size and forecast (2023-2028) ($ million)
      • Data Table on Cups - Market size and forecast (2023-2028) ($ million)
      • Chart on Cups - Year-over-year growth (2023-2028) (%)
      • Data Table on Cups - Year-over-year growth (2023-2028) (%)
    • 10.4 Cones - Market size and forecast (2023-2028)
      • Chart on Cones - Market size and forecast (2023-2028) ($ million)
      • Data Table on Cones - Market size and forecast (2023-2028) ($ million)
      • Chart on Cones - Year-over-year growth (2023-2028) (%)
      • Data Table on Cones - Year-over-year growth (2023-2028) (%)
    • 10.5 Tubs - Market size and forecast (2023-2028)
      • Chart on Tubs - Market size and forecast (2023-2028) ($ million)
      • Data Table on Tubs - Market size and forecast (2023-2028) ($ million)
      • Chart on Tubs - Year-over-year growth (2023-2028) (%)
      • Data Table on Tubs - Year-over-year growth (2023-2028) (%)
    • 10.6 Boxes - Market size and forecast (2023-2028)
      • Chart on Boxes - Market size and forecast (2023-2028) ($ million)
      • Data Table on Boxes - Market size and forecast (2023-2028) ($ million)
      • Chart on Boxes - Year-over-year growth (2023-2028) (%)
      • Data Table on Boxes - Year-over-year growth (2023-2028) (%)
    • 10.7 Market opportunity by Packaging Type
      • Market opportunity by Packaging Type ($ million)
      • Data Table on Market opportunity by Packaging Type ($ million)

    11 Market Segmentation by Distribution Channel

    • 11.1 Market segments
      • Chart on Distribution Channel - Market share (2023-2028) (%)
      • Data Table on Distribution Channel - Market share (2023-2028) (%)
    • 11.2 Comparison by Distribution Channel
      • Chart on Comparison by Distribution Channel
      • Data Table on Comparison by Distribution Channel
    • 11.3 Supermarkets/Hypermarkets - Market size and forecast (2023-2028)
      • Chart on Supermarkets/Hypermarkets - Market size and forecast (2023-2028) ($ million)
      • Data Table on Supermarkets/Hypermarkets - Market size and forecast (2023-2028) ($ million)
      • Chart on Supermarkets/Hypermarkets - Year-over-year growth (2023-2028) (%)
      • Data Table on Supermarkets/Hypermarkets - Year-over-year growth (2023-2028) (%)
    • 11.4 Convenience Stores - Market size and forecast (2023-2028)
      • Chart on Convenience Stores - Market size and forecast (2023-2028) ($ million)
      • Data Table on Convenience Stores - Market size and forecast (2023-2028) ($ million)
      • Chart on Convenience Stores - Year-over-year growth (2023-2028) (%)
      • Data Table on Convenience Stores - Year-over-year growth (2023-2028) (%)
    • 11.5 Online Retail - Market size and forecast (2023-2028)
      • Chart on Online Retail - Market size and forecast (2023-2028) ($ million)
      • Data Table on Online Retail - Market size and forecast (2023-2028) ($ million)
      • Chart on Online Retail - Year-over-year growth (2023-2028) (%)
      • Data Table on Online Retail - Year-over-year growth (2023-2028) (%)
    • 11.6 Foodservice - Market size and forecast (2023-2028)
      • Chart on Foodservice - Market size and forecast (2023-2028) ($ million)
      • Data Table on Foodservice - Market size and forecast (2023-2028) ($ million)
      • Chart on Foodservice - Year-over-year growth (2023-2028) (%)
      • Data Table on Foodservice - Year-over-year growth (2023-2028) (%)
    • 11.7 Specialty Stores - Market size and forecast (2023-2028)
      • Chart on Specialty Stores - Market size and forecast (2023-2028) ($ million)
      • Data Table on Specialty Stores - Market size and forecast (2023-2028) ($ million)
      • Chart on Specialty Stores - Year-over-year growth (2023-2028) (%)
      • Data Table on Specialty Stores - Year-over-year growth (2023-2028) (%)
    • 11.8 Market opportunity by Distribution Channel
      • Market opportunity by Distribution Channel ($ million)
      • Data Table on Market opportunity by Distribution Channel ($ million)

    12 Customer Landscape

    • 12.1 Customer landscape overview
      • Analysis of price sensitivity, lifecycle, customer purchase basket, adoption rates, and purchase criteria

    13 Geographic Landscape

    • 13.1 Geographic segmentation
      • Chart on Market share by geography 2023-2028 (%)
      • Data Table on Market share by geography 2023-2028 (%)
    • 13.2 Geographic comparison
      • Chart on Geographic comparison
      • Data Table on Geographic comparison
    • 13.3 North America - Market size and forecast 2023-2028
      • Chart on North America - Market size and forecast 2023-2028 ($ million)
      • Data Table on North America - Market size and forecast 2023-2028 ($ million)
      • Chart on North America - Year-over-year growth 2023-2028 (%)
      • Data Table on North America - Year-over-year growth 2023-2028 (%)
    • 13.4 Europe - Market size and forecast 2023-2028
      • Chart on Europe - Market size and forecast 2023-2028 ($ million)
      • Data Table on Europe - Market size and forecast 2023-2028 ($ million)
      • Chart on Europe - Year-over-year growth 2023-2028 (%)
      • Data Table on Europe - Year-over-year growth 2023-2028 (%)
    • 13.5 APAC - Market size and forecast 2023-2028
      • Chart on APAC - Market size and forecast 2023-2028 ($ million)
      • Data Table on APAC - Market size and forecast 2023-2028 ($ million)
      • Chart on APAC - Year-over-year growth 2023-2028 (%)
      • Data Table on APAC - Year-over-year growth 2023-2028 (%)
    • 13.6 South America - Market size and forecast 2023-2028
      • Chart on South America - Market size and forecast 2023-2028 ($ million)
      • Data Table on South America - Market size and forecast 2023-2028 ($ million)
      • Chart on South America - Year-over-year growth 2023-2028 (%)
      • Data Table on South America - Year-over-year growth 2023-2028 (%)
    • 13.7 Middle East and Africa - Market size and forecast 2023-2028
      • Chart on Middle East and Africa - Market size and forecast 2023-2028 ($ million)
      • Data Table on Middle East and Africa - Market size and forecast 2023-2028 ($ million)
      • Chart on Middle East and Africa - Year-over-year growth 2023-2028 (%)
      • Data Table on Middle East and Africa - Year-over-year growth 2023-2028 (%)
    • 13.8 US - Market size and forecast 2023-2028
      • Chart on US - Market size and forecast 2023-2028 ($ million)
      • Data Table on US - Market size and forecast 2023-2028 ($ million)
      • Chart on US - Year-over-year growth 2023-2028 (%)
      • Data Table on US - Year-over-year growth 2023-2028 (%)
    • 13.9 Germany - Market size and forecast 2023-2028
      • Chart on Germany - Market size and forecast 2023-2028 ($ million)
      • Data Table on Germany - Market size and forecast 2023-2028 ($ million)
      • Chart on Germany - Year-over-year growth 2023-2028 (%)
      • Data Table on Germany - Year-over-year growth 2023-2028 (%)
    • 13.10 Italy - Market size and forecast 2023-2028
      • Chart on Italy - Market size and forecast 2023-2028 ($ million)
      • Data Table on Italy - Market size and forecast 2023-2028 ($ million)
      • Chart on Italy - Year-over-year growth 2023-2028 (%)
      • Data Table on Italy - Year-over-year growth 2023-2028 (%)
    • 13.11 France - Market size and forecast 2023-2028
      • Chart on France - Market size and forecast 2023-2028 ($ million)
      • Data Table on France - Market size and forecast 2023-2028 ($ million)
      • Chart on France - Year-over-year growth 2023-2028 (%)
      • Data Table on France - Year-over-year growth 2023-2028 (%)
    • 13.12 China - Market size and forecast 2023-2028
      • Chart on China - Market size and forecast 2023-2028 ($ million)
      • Data Table on China - Market size and forecast 2023-2028 ($ million)
      • Chart on China - Year-over-year growth 2023-2028 (%)
      • Data Table on China - Year-over-year growth 2023-2028 (%)
    • 13.13 Market opportunity by geography
      • Market opportunity by geography ($ million)
      • Data Tables on Market opportunity by geography ($ million)
    • 13.14 Canada - Market size and forecast (2023-2028)
      • Chart on Canada - Market size and forecast (2023-2028) ($ million)
      • Data Table on Canada - Market size and forecast (2023-2028) ($ million)
      • Chart on Canada - Year-over-year growth (2023-2028) (%)
      • Data Table on Canada - Year-over-year growth (2023-2028) (%)
    • 13.15 UK - Market size and forecast (2023-2028)
      • Chart on UK - Market size and forecast (2023-2028) ($ million)
      • Data Table on UK - Market size and forecast (2023-2028) ($ million)
      • Chart on UK - Year-over-year growth (2023-2028) (%)
      • Data Table on UK - Year-over-year growth (2023-2028) (%)
    • 13.16 India - Market size and forecast (2023-2028)
      • Chart on India - Market size and forecast (2023-2028) ($ million)
      • Data Table on India - Market size and forecast (2023-2028) ($ million)
      • Chart on India - Year-over-year growth (2023-2028) (%)
      • Data Table on India - Year-over-year growth (2023-2028) (%)
    • 13.17 Japan - Market size and forecast (2023-2028)
      • Chart on Japan - Market size and forecast (2023-2028) ($ million)
      • Data Table on Japan - Market size and forecast (2023-2028) ($ million)
      • Chart on Japan - Year-over-year growth (2023-2028) (%)
      • Data Table on Japan - Year-over-year growth (2023-2028) (%)
    • 13.18 Brazil - Market size and forecast (2023-2028)
      • Chart on Brazil - Market size and forecast (2023-2028) ($ million)
      • Data Table on Brazil - Market size and forecast (2023-2028) ($ million)
      • Chart on Brazil - Year-over-year growth (2023-2028) (%)
      • Data Table on Brazil - Year-over-year growth (2023-2028) (%)
    • 13.19 Egypt - Market size and forecast (2023-2028)
      • Chart on Egypt - Market size and forecast (2023-2028) ($ million)
      • Data Table on Egypt - Market size and forecast (2023-2028) ($ million)
      • Chart on Egypt - Year-over-year growth (2023-2028) (%)
      • Data Table on Egypt - Year-over-year growth (2023-2028) (%)
    • 13.20 UAE - Market size and forecast (2023-2028)
      • Chart on UAE - Market size and forecast (2023-2028) ($ million)
      • Data Table on UAE - Market size and forecast (2023-2028) ($ million)
      • Chart on UAE - Year-over-year growth (2023-2028) (%)
      • Data Table on UAE - Year-over-year growth (2023-2028) (%)
    • 13.21 Oman - Market size and forecast (2023-2028)
      • Chart on Oman - Market size and forecast (2023-2028) ($ million)
      • Data Table on Oman - Market size and forecast (2023-2028) ($ million)
      • Chart on Oman - Year-over-year growth (2023-2028) (%)
      • Data Table on Oman - Year-over-year growth (2023-2028) (%)
    • 13.22 Argentina - Market size and forecast (2023-2028)
      • Chart on Argentina - Market size and forecast (2023-2028) ($ million)
      • Data Table on Argentina - Market size and forecast (2023-2028) ($ million)
      • Chart on Argentina - Year-over-year growth (2023-2028) (%)
      • Data Table on Argentina - Year-over-year growth (2023-2028) (%)
    • 13.23 KSA - Market size and forecast (2023-2028)
      • Chart on KSA - Market size and forecast (2023-2028) ($ million)
      • Data Table on KSA - Market size and forecast (2023-2028) ($ million)
      • Chart on KSA - Year-over-year growth (2023-2028) (%)
      • Data Table on KSA - Year-over-year growth (2023-2028) (%)
    • 13.24 Rest of World (ROW) - Market size and forecast (2023-2028)
      • Chart on Rest of World (ROW) - Market size and forecast (2023-2028) ($ million)
      • Data Table on Rest of World (ROW) - Market size and forecast (2023-2028) ($ million)
      • Chart on Rest of World (ROW) - Year-over-year growth (2023-2028) (%)
      • Data Table on Rest of World (ROW) - Year-over-year growth (2023-2028) (%)

    14 Drivers, Challenges, and Opportunity/Restraints

    • 14.1 Market drivers
      • 14.2 Market challenges
        • 14.3 Impact of drivers and challenges
          • Impact of drivers and challenges in 2023 and 2028
        • 14.4 Market opportunities/restraints

          15 Competitive Landscape

          • 15.1 Overview
            • 15.2 Competitive Landscape
              • Overview on criticality of inputs and factors of differentiation
            • 15.3 Landscape disruption
              • Overview on factors of disruption
            • 15.4 Industry risks
              • Impact of key risks on business

            16 Competitive Analysis

            • 16.1 Companies profiled
              • Companies covered
            • 16.2 Market positioning of companies
              • Matrix on companies position and classification
            • 16.3 Bliss Unlimited LLC
              • Bliss Unlimited LLC - Overview
              • Bliss Unlimited LLC - Product / Service
              • Bliss Unlimited LLC - Key offerings
            • 16.4 Compassionate Choices Pvt. Ltd.
              • Compassionate Choices Pvt. Ltd. - Overview
              • Compassionate Choices Pvt. Ltd. - Product / Service
              • Compassionate Choices Pvt. Ltd. - Key offerings
            • 16.5 Danone SA
              • Danone SA - Overview
              • Danone SA - Business segments
              • Danone SA - Key news
              • Danone SA - Key offerings
              • Danone SA - Segment focus
            • 16.6 General Mills Inc.
              • General Mills Inc. - Overview
              • General Mills Inc. - Business segments
              • General Mills Inc. - Key news
              • General Mills Inc. - Key offerings
              • General Mills Inc. - Segment focus
            • 16.7 JENIS SPLENDID ICE CREAMS LLC
              • JENIS SPLENDID ICE CREAMS LLC - Overview
              • JENIS SPLENDID ICE CREAMS LLC - Product / Service
              • JENIS SPLENDID ICE CREAMS LLC - Key offerings
            • 16.8 Nestle SA
              • Nestle SA - Overview
              • Nestle SA - Business segments
              • Nestle SA - Key news
              • Nestle SA - Key offerings
              • Nestle SA - Segment focus
            • 16.9 The Brooklyn Creamery
              • The Brooklyn Creamery - Overview
              • The Brooklyn Creamery - Product / Service
              • The Brooklyn Creamery - Key offerings
            • 16.10 Tofutti Brands Inc
              • Tofutti Brands Inc - Overview
              • Tofutti Brands Inc - Product / Service
              • Tofutti Brands Inc - Key offerings
            • 16.11 Unilever PLC
              • Unilever PLC - Overview
              • Unilever PLC - Business segments
              • Unilever PLC - Key offerings
              • Unilever PLC - Segment focus
            • 16.12 Wells Enterprises Inc.
              • Wells Enterprises Inc. - Overview
              • Wells Enterprises Inc. - Product / Service
              • Wells Enterprises Inc. - Key offerings

            17 Appendix

            • 17.1 Scope of the report
              • 17.2 Inclusions and exclusions checklist
                • Inclusions checklist
                • Exclusions checklist
              • 17.3 Currency conversion rates for US$
                • Currency conversion rates for US$
              • 17.4 Research methodology
                • Research methodology
              • 17.5 Data procurement
                • Information sources
              • 17.6 Data validation
                • Data validation
              • 17.7 Validation techniques employed for market sizing
                • Validation techniques employed for market sizing
              • 17.8 Data synthesis
                • Data synthesis
              • 17.9 360 degree market analysis
                • 360 degree market analysis
              • 17.10 List of abbreviations
                • List of abbreviations

              Research Methodology

              Technavio presents a detailed picture of the market by way of study, synthesis, and summation of data from multiple sources. The analysts have presented the various facets of the market with a particular focus on identifying the key industry influencers. The data thus presented is comprehensive, reliable, and the result of extensive research, both primary and secondary.

              INFORMATION SOURCES

              Primary sources

              • Manufacturers and suppliers
              • Channel partners
              • Industry experts
              • Strategic decision makers

              Secondary sources

              • Industry journals and periodicals
              • Government data
              • Financial reports of key industry players
              • Historical data
              • Press releases

              DATA ANALYSIS

              Data Synthesis

              • Collation of data
              • Estimation of key figures
              • Analysis of derived insights

              Data Validation

              • Triangulation with data models
              • Reference against proprietary databases
              • Corroboration with industry experts

              REPORT WRITING

              Qualitative

              • Market drivers
              • Market challenges
              • Market trends
              • Five forces analysis

              Quantitative

              • Market size and forecast
              • Market segmentation
              • Geographical insights
              • Competitive landscape

              Interested in this report?

              Get your sample now to see our research methodology and insights!

              Download Now

              Frequently Asked Questions

              Vegan Ice Cream market growth will increase by $ 1310.9 mn during 2024-2028 .

              The Vegan Ice Cream market is expected to grow at a CAGR of 10% during 2024-2028 .

              Vegan Ice Cream market is segmented by Product( Take home, Impulse, Artisanal) Base Ingredient( Almond Milk, Coconut Milk, Soy Milk, Cashew Milk, Oat Milk)

              Aurora Foods, Bliss Unlimited LLC, Compassionate Choices Pvt. Ltd., Coolhaus, Danone SA, General Mills Inc., JENIS SPLENDID ICE CREAMS LLC, Nestle SA, Over The Moo, The Booja Booja Co. Ltd., The Brooklyn Creamery, Tofutti Brands Inc, Unilever PLC, Valsoia SpA, Wells Enterprises Inc. are a few of the key vendors in the Vegan Ice Cream market.

              North America will register the highest growth rate of 34% among the other regions. Therefore, the Vegan Ice Cream market in North America is expected to garner significant business opportunities for the vendors during the forecast period.

              US, Canada, Germany, UK, Italy, France, China, India, Japan, Brazil, Egypt, UAE, Oman, Argentina, KSA, UAE, Brazil, Rest of World (ROW)

              • Expanding global vegan population baseVeganism is a lifestyle choice that pertains to the practice of abstaining from the use of any products sourced from animals is the driving factor this market.
              • especially food products. The expanding global vegan population base is a trend that can positively influence the growth of the global vegan ice cream market during the forecast period. People are adopting the vegan lifestyle is the driving factor this market.
              • particularly for the health benefits associated with it and for ethical reasons. The number of people adopting veganism and opting for vegan diets has increased by about 300% over the last decade. Foodservice outlets are also adding vegan recipes to their menus to attract vegan consumers. Dairy-free cheese is the driving factor this market.
              • vegetarian burgers is the driving factor this market.
              • and vegetarian beverages are some food offerings available at various eateries. The number of people is the driving factor this market.
              • especially the youth is the driving factor this market.
              • adopting a vegan lifestyle is increasing in the UK. In the US is the driving factor this market.
              • many food startups have started promoting veganism is the driving factor this market.
              • many of which are endorsed by celebrities like Bill Gates. Many celebrities support veganism is the driving factor this market.
              • the most prominent of them being Bill Clinton is the driving factor this market.
              • Mike Tyson is the driving factor this market.
              • Carl Lewis is the driving factor this market.
              • Serena Williams is the driving factor this market.
              • and Venus Williams. Such factors contribute to the global vegan ice cream market growth during the forecast period. is the driving factor this market.

              The Vegan Ice Cream market vendors should focus on grabbing business opportunities from the Take home segment as it accounted for the largest market share in the base year.