Video Conferencing Market Analysis North America, Europe, APAC, South America, Middle East and Africa - US, China, India, Canada, Germany, UK, France, Japan, Australia, Brazil - Size and Forecast 2025-2029

Video Conferencing Market Analysis North America, Europe, APAC, South America, Middle East and Africa - US, China, India, Canada, Germany, UK, France, Japan, Australia, Brazil - Size and Forecast 2025-2029

Published: Jan 2025 194 Pages SKU: IRTNTR77521

Market Overview at a Glance

$8.84 B
Market Opportunity
12.6%
CAGR
11.2
YoY growth 2024-2025(%)

Video Conferencing Market Size 2025-2029

The video conferencing market size is forecast to increase by USD 8.84 billion, at a CAGR of 12.6% between 2024 and 2029.

  • The market is experiencing significant growth due to the increasing globalization and resulting need for effective cross-border communication. This trend is driving the adoption of video conferencing solutions as an essential tool for businesses operating in diverse geographies. Furthermore, the integration of artificial intelligence (AI) in video conferencing technology is revolutionizing the way businesses communicate, offering advanced features such as automated transcription, facial recognition, and language translation. However, the market faces challenges related to data privacy and security concerns. With the increasing use of video conferencing for sensitive business discussions and personal interactions, ensuring secure transmission and storage of data is a top priority.
  • Companies must address these challenges by implementing robust security protocols and transparent data handling practices to build trust and maintain customer confidence. By staying informed of these market dynamics and addressing the challenges effectively, businesses can capitalize on the opportunities presented by the growing market and enhance their communication strategies.

What will be the Size of the Video Conferencing Market during the forecast period?

Video Conferencing Market Size

Explore in-depth regional segment analysis with market size data - historical 2019-2023 and forecasts 2025-2029 - in the full report.  
Request Free Sample

The market continues to evolve, with dynamic market activities shaping its landscape. Video conferencing platforms offer a range of features, including breakout rooms for smaller group discussions, translation services for global communication, and high-definition video quality for enhanced user experience. Video conferencing hardware, from cameras to microphones, ensures optimal audio and video performance. Healthcare video conferencing is a significant application, enabling remote patient monitoring and virtual consultations. Screen sharing and content sharing facilitate collaboration, while real-time transcription and virtual interviews streamline communication. Hybrid work and virtual events are driving the adoption of video conferencing software, which integrates with CRM systems, calendar applications, and collaboration tools.

Pricing models vary, with per-meeting and per-user pricing structures, as well as subscription services. Access control, data privacy, and meeting analytics are essential for enterprise video conferencing, while conferencing bridges and video conferencing gateways ensure seamless connectivity. Meeting moderation tools and collaboration features further enhance user engagement. Video conferencing displays, virtual backgrounds, and file sharing add convenience, while remote control, presentation mode, and meeting recording enable productivity. Virtual training, remote sales, and education video conferencing expand the market's reach, with poll features and usage reports providing valuable insights. Video conferencing security remains a priority, ensuring data privacy and protection.

How is this Video Conferencing Industry segmented?

The video conferencing industry research report provides comprehensive data (region-wise segment analysis), with forecasts and estimates in "USD million" for the period 2025-2029, as well as historical data from 2019-2023 for the following segments.

  • Component
    • Hardware
    • Software
    • Services
  • End-user
    • Large enterprises
    • Small and medium enterprises
  • Geography
    • North America
      • US
      • Canada
    • Europe
      • France
      • Germany
      • UK
    • APAC
      • Australia
      • China
      • India
      • Japan
    • South America
      • Brazil
    • Rest of World (ROW)

By Component Insights

The hardware segment is estimated to witness significant growth during the forecast period.

In the dynamic market, businesses and various industries adopt innovative technologies to enhance communication and collaboration. Cloud-based conferencing solutions enable calendar integrations and per-meeting pricing, making scheduling and cost management more efficient. Participant engagement is a priority, with features such as instant messaging, Q&A, and content sharing fostering interactive experiences. Customer support is ensured through per-user pricing and access control, while data privacy and meeting analytics maintain security and productivity. Video conferencing platforms offer breakout rooms for focused discussions, translation services for global collaboration, and high-definition video and audio quality for immersive experiences. Healthcare video conferencing integrates remote patient monitoring, real-time transcription, and virtual interviews, revolutionizing the healthcare sector.

Hybrid work and virtual events are facilitated through web conferencing, conferencing bridges, and collaboration tools like screen sharing, file sharing, and remote control. Education video conferencing incorporates interactive whiteboards and presentation mode for effective teaching, while enterprise video conferencing caters to large organizations with meeting moderation and CRM integrations. Video conferencing displays, virtual backgrounds, and usage reports provide additional functionalities, ensuring a seamless user experience. Subscription services and video conferencing security features ensure long-term commitment and data protection.

Video Conferencing Market Size

Request Free Sample

The Hardware segment was valued at USD 2.43 billion in 2019 and showed a gradual increase during the forecast period.

Regional Analysis

North America is estimated to contribute 40% to the growth of the global market during the forecast period. Technavio's analysts have elaborately explained the regional trends and drivers that shape the market during the forecast period.

Video Conferencing Market Share by Geography

 Request Free Sample

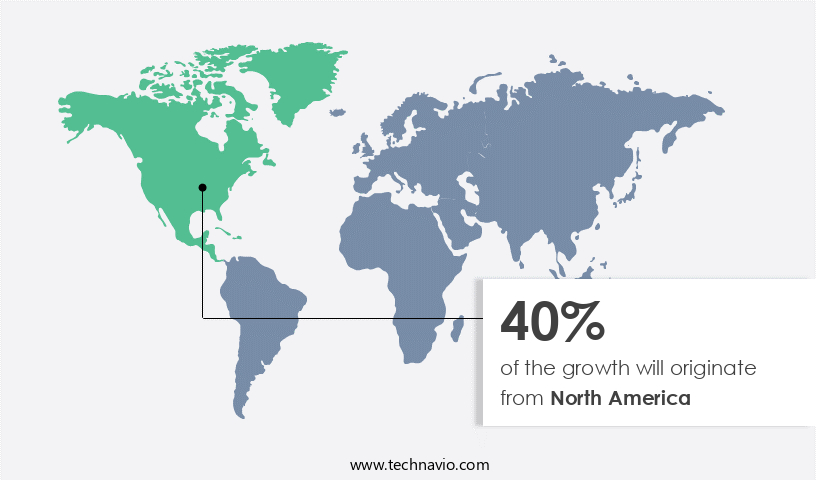
In the dynamic global market, North America emerges as a leading region due to its advanced IT infrastructure and the widespread adoption of digital technologies. The presence of numerous large enterprises, particularly in sectors like information technology, finance, and healthcare, fuels the demand for effective communication and collaboration tools. The COVID-19 pandemic further accelerated the adoption of video conferencing, making it an essential component of remote work solutions across various industries. However, the market faces challenges such as security concerns, interoperability issues, and bandwidth limitations, which require continuous innovation and improvement. Cloud-based conferencing, participant engagement, calendar integrations, per-meeting pricing, instant messaging, Q&A, content sharing, customer support, and per-user pricing are essential features driving market growth.

Video conferencing platforms offer breakout rooms, translation services, and high-quality video and audio to enhance user experience. Healthcare video conferencing, screen sharing, hybrid work, virtual events, real-time transcription, virtual interviews, and collaboration tools are increasingly popular applications. Enterprise video conferencing, conferencing bridges, web conferencing, meeting moderation, and meeting rooms are essential components of the market. Video conferencing displays, virtual backgrounds, file sharing, remote control, presentation mode, meeting recording, virtual training, remote sales, cloud storage, remote work, education video conferencing, poll features, video conferencing integrations, usage reports, subscription services, and video conferencing security are additional features that cater to diverse business needs.

Interactive whiteboards and CRM integrations further enrich the user experience. The market's evolution is influenced by pricing models, including per-meeting and per-user pricing, and the integration of video conferencing gateways. Meeting analytics, subscription services, and usage reports provide valuable insights for businesses. Despite the challenges, the market continues to grow, offering innovative solutions to meet the evolving communication and collaboration needs of businesses.

Market Dynamics

Our researchers analyzed the data with 2024 as the base year, along with the key drivers, trends, and challenges. A holistic analysis of drivers will help companies refine their marketing strategies to gain a competitive advantage.

What are the key market drivers leading to the rise in the adoption of Video Conferencing Industry?

  • The escalating trend of globalization and the resulting necessity for cross-border communication serve as the primary catalyst for market growth. 
  • The market has experienced substantial growth due to the increasing globalization and the resulting need for effective communication solutions that bridge geographical and time zone differences. Video conferencing enables organizations to hold virtual meetings, negotiations, and presentations in real time, enhancing productivity and facilitating faster decision-making and problem-solving. Key features of video conferencing platforms include high-definition video and audio capabilities, screen sharing, instant messaging, Q&A sessions, and calendar integrations. These tools allow for more engaging and interactive meetings, enhancing participant engagement. Cloud-based conferencing solutions offer flexibility and accessibility, enabling users to join meetings from anywhere, at any time, using various devices.
  • Per-meeting pricing and per-user pricing models cater to businesses of all sizes. Access control features ensure data privacy and security, while meeting analytics provide valuable insights for continuous improvement. Additionally, customer support and content sharing functionalities further enrich the user experience. Zoom Video Communications is an example of a market player offering advanced video conferencing features that cater to cross-border communication needs.

What are the market trends shaping the Video Conferencing Industry?

  • The integration of artificial intelligence (AI) in video conferencing is becoming increasingly prevalent, representing a significant market trend. This development is driven by the growing demand for advanced features and efficient communication solutions.
  • The market is experiencing significant growth due to the increasing adoption of advanced AI-driven features. These capabilities, including virtual backgrounds, noise cancellation technology, and real-time transcription services, are transforming the way businesses communicate. Virtual backgrounds enable users to customize their video conferencing environment, providing privacy, professionalism, and branding opportunities. Noise cancellation technology, powered by AI, filters out background noise, ensuring clear and uninterrupted communication in various settings. Transcription services, which convert spoken words into text in real time, facilitate notetaking, accessibility for hearing-impaired participants, and post-meeting documentation. Additionally, video conferencing platforms now offer breakout rooms for smaller group discussions, screen sharing for collaborative work, and translation services for multilingual communication.
  • The shift towards hybrid work and virtual events has further accelerated the demand for video conferencing solutions, making them an essential tool for organizations. The focus on user experience, video quality, and audio quality continues to drive innovation in the market.

What challenges does the Video Conferencing Industry face during its growth?

  • The growth of the video conferencing industry is significantly impacted by data privacy and security concerns, which represent a major challenge that must be addressed to maintain trust and ensure the secure transmission of sensitive information during virtual meetings. 
  • The market faces substantial challenges due to data privacy and security concerns, which can undermine both businesses and individuals. With the rise of remote work and virtual meetings, the risk of data breaches, unauthorized access, and privacy violations has escalated. Instances of uninvited intruders disrupting important or confidential video conferences and other security lapses have underscored the vulnerabilities of these platforms, damaging user trust and confidence. Key issues include the interception of sensitive information during video conferencing, unauthorized access to meetings via shared links or weak authentication measures, and the misuse of user data by service providers. To mitigate these risks, video conferencing solutions are integrating advanced security features such as encryption, two-factor authentication, and access control.
  • Additionally, conferencing providers are focusing on CRM integrations, pricing models, conferencing bridges, web conferencing, meeting moderation, collaboration tools, meeting rooms, video conferencing displays, virtual backgrounds, file sharing, remote control, presentation mode, and other advanced functionalities to enhance user experience and security.

Exclusive Customer Landscape

The video conferencing market forecasting report includes the adoption lifecycle of the market, covering from the innovator's stage to the laggard's stage. It focuses on adoption rates in different regions based on penetration. Furthermore, the video conferencing market report also includes key purchase criteria and drivers of price sensitivity to help companies evaluate and develop their market growth analysis strategies.

Video Conferencing Market Share by Geography

 Customer Landscape

Key Companies & Market Insights

Companies are implementing various strategies, such as strategic alliances, video conferencing market forecast, partnerships, mergers and acquisitions, geographical expansion, and product/service launches, to enhance their presence in the industry.

8x8 Inc. - The company provides video conferencing solutions, including Adobe Connect 12, which enables rapid content creation and deployment utilizing authoring tools like Adobe Captivate and Adobe Presenter. 

The industry research and growth report includes detailed analyses of the competitive landscape of the market and information about key companies, including:

  • 8x8 Inc.
  • Adobe Inc.
  • Amazon.com Inc.
  • Avaya LLC
  • Cisco Systems Inc.
  • Dialpad Inc.
  • Enghouse Systems Ltd.
  • Google LLC
  • Haivision Systems Inc.
  • HP Inc.
  • Huawei Technologies Co. Ltd.
  • Kaltura Inc.
  • Logitech International SA
  • Microsoft Corp.
  • Pexip Holding ASA
  • RingCentral Inc.
  • Sonic Foundry Inc.
  • TIBCO Software Inc.
  • Verizon Communications Inc.
  • Zoom Video Communications Inc.

Qualitative and quantitative analysis of companies has been conducted to help clients understand the wider business environment as well as the strengths and weaknesses of key industry players. Data is qualitatively analyzed to categorize companies as pure play, category-focused, industry-focused, and diversified; it is quantitatively analyzed to categorize companies as dominant, leading, strong, tentative, and weak.

Recent Development and News in Video Conferencing Market

  • In February 2023, Microsoft Teams introduced new features to its video conferencing platform, including background blur and virtual backgrounds, aiming to enhance user experience and privacy (Microsoft Press Release).
  • In May 2023, Google Meet and Zoom signed a partnership agreement, allowing users to schedule and join meetings directly from their Google Calendar, expanding integration options for both platforms (Google Press Release).
  • In October 2024, Cisco Systems acquired IMImobile, a leading mobile communications platform provider, to strengthen its video conferencing offerings and expand its reach into the mobile market (Cisco Press Release).
  • In March 2025, the European Union approved the Data Protection Regulation for video conferencing platforms, setting new data privacy standards and increasing security measures for video conferencing services (European Commission Press Release). These developments underscore the market's ongoing evolution, with a focus on user experience, integration, strategic partnerships, and regulatory compliance

Research Analyst Overview

  • The market continues to evolve, with key players such as Google Meet and Zoom leading the charge. Internet speed emerges as a critical factor, as high-definition video and audio require robust connections. Conference rooms and huddle spaces are being transformed with hardware compatibility for Google Meet hardware and Microsoft Teams Rooms. Augmented and virtual reality conferencing add a new dimension to meetings, while web browser access and mobile apps ensure accessibility. Network requirements and automatic transcription ensure inclusivity and productivity.
  • Support services, including sentiment analysis and language translation, cater to diverse customer needs. Multi-platform support, technical assistance, and training resources further enhance the user experience. Microsoft Teams and Cisco Webex also offer AI-powered conferencing and desktop apps, expanding functionality. Overall, the video conferencing landscape is dynamic, with continuous innovation in hardware, software, and support services.

Dive into Technavio's robust research methodology, blending expert interviews, extensive data synthesis, and validated models for unparalleled Video Conferencing Market insights. See full methodology.

Market Scope

Report Coverage

Details

Page number

194

Base year

2024

Historic period

2019-2023

Forecast period

2025-2029

Growth momentum & CAGR

Accelerate at a CAGR of 12.6%

Market growth 2025-2029

USD 8843.8 million

Market structure

Fragmented

YoY growth 2024-2025(%)

11.2

Key countries

US, China, India, Canada, Germany, UK, France, Japan, Australia, and Brazil

Competitive landscape

Leading Companies, Market Positioning of Companies, Competitive Strategies, and Industry Risks

Request Free Sample

What are the Key Data Covered in this Video Conferencing Market Research and Growth Report?

  • CAGR of the Video Conferencing industry during the forecast period
  • Detailed information on factors that will drive the growth and forecasting between 2025 and 2029
  • Precise estimation of the size of the market and its contribution of the industry in focus to the parent market
  • Accurate predictions about upcoming growth and trends and changes in consumer behaviour
  • Growth of the market across North America, Europe, APAC, South America, and Middle East and Africa
  • Thorough analysis of the market's competitive landscape and detailed information about companies
  • Comprehensive analysis of factors that will challenge the video conferencing market growth of industry companies

We can help! Our analysts can customize this video conferencing market research report to meet your requirements.

Get in touch

1 Executive Summary

  • 1.1 Market overview
    • Executive Summary - Chart on Market Overview
    • Executive Summary - Data Table on Market Overview
    • Executive Summary - Chart on Global Market Characteristics
    • Executive Summary - Chart on Market by Geography
    • Executive Summary - Chart on Market Segmentation by Component
    • Executive Summary - Chart on Market Segmentation by End-user
    • Executive Summary - Chart on Incremental Growth
    • Executive Summary - Data Table on Incremental Growth
    • Executive Summary - Chart on Company Market Positioning

2 Technavio Analysis

  • 2.1 Analysis of price sensitivity, lifecycle, customer purchase basket, adoption rates, and purchase criteria
    • Analysis of price sensitivity, lifecycle, customer purchase basket, adoption rates, and purchase criteria
  • 2.2 Criticality of inputs and Factors of differentiation
    • Overview on criticality of inputs and factors of differentiation
  • 2.3 Factors of disruption
    • Overview on factors of disruption
  • 2.4 Impact of drivers and challenges
    • Impact of drivers and challenges in 2024 and 2029

3 Market Landscape

  • 3.1 Market ecosystem
    • Parent Market
    • Data Table on - Parent Market
  • 3.2 Market characteristics
    • Market characteristics analysis
  • 3.3 Value chain analysis
    • Value chain analysis

4 Market Sizing

  • 4.1 Market definition
    • Offerings of companies included in the market definition
  • 4.2 Market segment analysis
    • Market segments
  • 4.3 Market size 2024
    • 4.4 Market outlook: Forecast for 2024-2029
      • Chart on Global - Market size and forecast 2024-2029 ($ million)
      • Data Table on Global - Market size and forecast 2024-2029 ($ million)
      • Chart on Global Market: Year-over-year growth 2024-2029 (%)
      • Data Table on Global Market: Year-over-year growth 2024-2029 (%)

    5 Historic Market Size

    • 5.1 Global Video Conferencing Market 2019 - 2023
      • Historic Market Size - Data Table on Global Video Conferencing Market 2019 - 2023 ($ million)
    • 5.2 Component segment analysis 2019 - 2023
      • Historic Market Size - Component Segment 2019 - 2023 ($ million)
    • 5.3 End-user segment analysis 2019 - 2023
      • Historic Market Size - End-user Segment 2019 - 2023 ($ million)
    • 5.4 Geography segment analysis 2019 - 2023
      • Historic Market Size - Geography Segment 2019 - 2023 ($ million)
    • 5.5 Country segment analysis 2019 - 2023
      • Historic Market Size - Country Segment 2019 - 2023 ($ million)

    6 Qualitative Analysis

    • 6.1 The AI impact on Global Video Conferencing Market

      7 Five Forces Analysis

      • 7.1 Five forces summary
        • Five forces analysis - Comparison between 2024 and 2029
      • 7.2 Bargaining power of buyers
        • Bargaining power of buyers - Impact of key factors 2024 and 2029
      • 7.3 Bargaining power of suppliers
        • Bargaining power of suppliers - Impact of key factors in 2024 and 2029
      • 7.4 Threat of new entrants
        • Threat of new entrants - Impact of key factors in 2024 and 2029
      • 7.5 Threat of substitutes
        • Threat of substitutes - Impact of key factors in 2024 and 2029
      • 7.6 Threat of rivalry
        • Threat of rivalry - Impact of key factors in 2024 and 2029
      • 7.7 Market condition
        • Chart on Market condition - Five forces 2024 and 2029

      8 Market Segmentation by Component

      • 8.1 Market segments
        • Chart on Component - Market share 2024-2029 (%)
        • Data Table on Component - Market share 2024-2029 (%)
      • 8.2 Comparison by Component
        • Chart on Comparison by Component
        • Data Table on Comparison by Component
      • 8.3 Hardware - Market size and forecast 2024-2029
        • Chart on Hardware - Market size and forecast 2024-2029 ($ million)
        • Data Table on Hardware - Market size and forecast 2024-2029 ($ million)
        • Chart on Hardware - Year-over-year growth 2024-2029 (%)
        • Data Table on Hardware - Year-over-year growth 2024-2029 (%)
      • 8.4 Software - Market size and forecast 2024-2029
        • Chart on Software - Market size and forecast 2024-2029 ($ million)
        • Data Table on Software - Market size and forecast 2024-2029 ($ million)
        • Chart on Software - Year-over-year growth 2024-2029 (%)
        • Data Table on Software - Year-over-year growth 2024-2029 (%)
      • 8.5 Services - Market size and forecast 2024-2029
        • Chart on Services - Market size and forecast 2024-2029 ($ million)
        • Data Table on Services - Market size and forecast 2024-2029 ($ million)
        • Chart on Services - Year-over-year growth 2024-2029 (%)
        • Data Table on Services - Year-over-year growth 2024-2029 (%)
      • 8.6 Market opportunity by Component
        • Market opportunity by Component ($ million)
        • Data Table on Market opportunity by Component ($ million)

      9 Market Segmentation by End-user

      • 9.1 Market segments
        • Chart on End-user - Market share 2024-2029 (%)
        • Data Table on End-user - Market share 2024-2029 (%)
      • 9.2 Comparison by End-user
        • Chart on Comparison by End-user
        • Data Table on Comparison by End-user
      • 9.3 Large enterprises - Market size and forecast 2024-2029
        • Chart on Large enterprises - Market size and forecast 2024-2029 ($ million)
        • Data Table on Large enterprises - Market size and forecast 2024-2029 ($ million)
        • Chart on Large enterprises - Year-over-year growth 2024-2029 (%)
        • Data Table on Large enterprises - Year-over-year growth 2024-2029 (%)
      • 9.4 Small and medium enterprises - Market size and forecast 2024-2029
        • Chart on Small and medium enterprises - Market size and forecast 2024-2029 ($ million)
        • Data Table on Small and medium enterprises - Market size and forecast 2024-2029 ($ million)
        • Chart on Small and medium enterprises - Year-over-year growth 2024-2029 (%)
        • Data Table on Small and medium enterprises - Year-over-year growth 2024-2029 (%)
      • 9.5 Market opportunity by End-user
        • Market opportunity by End-user ($ million)
        • Data Table on Market opportunity by End-user ($ million)

      10 Customer Landscape

      • 10.1 Customer landscape overview
        • Analysis of price sensitivity, lifecycle, customer purchase basket, adoption rates, and purchase criteria

      11 Geographic Landscape

      • 11.1 Geographic segmentation
        • Chart on Market share by geography 2024-2029 (%)
        • Data Table on Market share by geography 2024-2029 (%)
      • 11.2 Geographic comparison
        • Chart on Geographic comparison
        • Data Table on Geographic comparison
      • 11.3 North America - Market size and forecast 2024-2029
        • Chart on North America - Market size and forecast 2024-2029 ($ million)
        • Data Table on North America - Market size and forecast 2024-2029 ($ million)
        • Chart on North America - Year-over-year growth 2024-2029 (%)
        • Data Table on North America - Year-over-year growth 2024-2029 (%)
      • 11.4 Europe - Market size and forecast 2024-2029
        • Chart on Europe - Market size and forecast 2024-2029 ($ million)
        • Data Table on Europe - Market size and forecast 2024-2029 ($ million)
        • Chart on Europe - Year-over-year growth 2024-2029 (%)
        • Data Table on Europe - Year-over-year growth 2024-2029 (%)
      • 11.5 APAC - Market size and forecast 2024-2029
        • Chart on APAC - Market size and forecast 2024-2029 ($ million)
        • Data Table on APAC - Market size and forecast 2024-2029 ($ million)
        • Chart on APAC - Year-over-year growth 2024-2029 (%)
        • Data Table on APAC - Year-over-year growth 2024-2029 (%)
      • 11.6 South America - Market size and forecast 2024-2029
        • Chart on South America - Market size and forecast 2024-2029 ($ million)
        • Data Table on South America - Market size and forecast 2024-2029 ($ million)
        • Chart on South America - Year-over-year growth 2024-2029 (%)
        • Data Table on South America - Year-over-year growth 2024-2029 (%)
      • 11.7 Middle East and Africa - Market size and forecast 2024-2029
        • Chart on Middle East and Africa - Market size and forecast 2024-2029 ($ million)
        • Data Table on Middle East and Africa - Market size and forecast 2024-2029 ($ million)
        • Chart on Middle East and Africa - Year-over-year growth 2024-2029 (%)
        • Data Table on Middle East and Africa - Year-over-year growth 2024-2029 (%)
      • 11.8 US - Market size and forecast 2024-2029
        • Chart on US - Market size and forecast 2024-2029 ($ million)
        • Data Table on US - Market size and forecast 2024-2029 ($ million)
        • Chart on US - Year-over-year growth 2024-2029 (%)
        • Data Table on US - Year-over-year growth 2024-2029 (%)
      • 11.9 China - Market size and forecast 2024-2029
        • Chart on China - Market size and forecast 2024-2029 ($ million)
        • Data Table on China - Market size and forecast 2024-2029 ($ million)
        • Chart on China - Year-over-year growth 2024-2029 (%)
        • Data Table on China - Year-over-year growth 2024-2029 (%)
      • 11.10 India - Market size and forecast 2024-2029
        • Chart on India - Market size and forecast 2024-2029 ($ million)
        • Data Table on India - Market size and forecast 2024-2029 ($ million)
        • Chart on India - Year-over-year growth 2024-2029 (%)
        • Data Table on India - Year-over-year growth 2024-2029 (%)
      • 11.11 Canada - Market size and forecast 2024-2029
        • Chart on Canada - Market size and forecast 2024-2029 ($ million)
        • Data Table on Canada - Market size and forecast 2024-2029 ($ million)
        • Chart on Canada - Year-over-year growth 2024-2029 (%)
        • Data Table on Canada - Year-over-year growth 2024-2029 (%)
      • 11.12 Germany - Market size and forecast 2024-2029
        • Chart on Germany - Market size and forecast 2024-2029 ($ million)
        • Data Table on Germany - Market size and forecast 2024-2029 ($ million)
        • Chart on Germany - Year-over-year growth 2024-2029 (%)
        • Data Table on Germany - Year-over-year growth 2024-2029 (%)
      • 11.13 UK - Market size and forecast 2024-2029
        • Chart on UK - Market size and forecast 2024-2029 ($ million)
        • Data Table on UK - Market size and forecast 2024-2029 ($ million)
        • Chart on UK - Year-over-year growth 2024-2029 (%)
        • Data Table on UK - Year-over-year growth 2024-2029 (%)
      • 11.14 France - Market size and forecast 2024-2029
        • Chart on France - Market size and forecast 2024-2029 ($ million)
        • Data Table on France - Market size and forecast 2024-2029 ($ million)
        • Chart on France - Year-over-year growth 2024-2029 (%)
        • Data Table on France - Year-over-year growth 2024-2029 (%)
      • 11.15 Japan - Market size and forecast 2024-2029
        • Chart on Japan - Market size and forecast 2024-2029 ($ million)
        • Data Table on Japan - Market size and forecast 2024-2029 ($ million)
        • Chart on Japan - Year-over-year growth 2024-2029 (%)
        • Data Table on Japan - Year-over-year growth 2024-2029 (%)
      • 11.16 Australia - Market size and forecast 2024-2029
        • Chart on Australia - Market size and forecast 2024-2029 ($ million)
        • Data Table on Australia - Market size and forecast 2024-2029 ($ million)
        • Chart on Australia - Year-over-year growth 2024-2029 (%)
        • Data Table on Australia - Year-over-year growth 2024-2029 (%)
      • 11.17 Brazil - Market size and forecast 2024-2029
        • Chart on Brazil - Market size and forecast 2024-2029 ($ million)
        • Data Table on Brazil - Market size and forecast 2024-2029 ($ million)
        • Chart on Brazil - Year-over-year growth 2024-2029 (%)
        • Data Table on Brazil - Year-over-year growth 2024-2029 (%)
      • 11.18 Market opportunity by geography
        • Market opportunity by geography ($ million)
        • Data Tables on Market opportunity by geography ($ million)

      12 Drivers, Challenges, and Opportunity/Restraints

      • 12.1 Market drivers
        • 12.2 Market challenges
          • 12.3 Impact of drivers and challenges
            • Impact of drivers and challenges in 2024 and 2029
          • 12.4 Market opportunities/restraints

            13 Competitive Landscape

            • 13.1 Overview
              • 13.2 Competitive Landscape
                • Overview on criticality of inputs and factors of differentiation
              • 13.3 Landscape disruption
                • Overview on factors of disruption
              • 13.4 Industry risks
                • Impact of key risks on business

              14 Competitive Analysis

              • 14.1 Companies profiled
                • Companies covered
              • 14.2 Company ranking index
                • Company ranking index
              • 14.3 Market positioning of companies
                • Matrix on companies position and classification
              • 14.4 Adobe Inc.
                • Adobe Inc. - Overview
                • Adobe Inc. - Business segments
                • Adobe Inc. - Key news
                • Adobe Inc. - Key offerings
                • Adobe Inc. - Segment focus
                • SWOT
              • 14.5 Amazon.com Inc.
                • Amazon.com Inc. - Overview
                • Amazon.com Inc. - Business segments
                • Amazon.com Inc. - Key news
                • Amazon.com Inc. - Key offerings
                • Amazon.com Inc. - Segment focus
                • SWOT
              • 14.6 Avaya LLC
                • Avaya LLC - Overview
                • Avaya LLC - Product / Service
                • Avaya LLC - Key news
                • Avaya LLC - Key offerings
                • SWOT
              • 14.7 Cisco Systems Inc.
                • Cisco Systems Inc. - Overview
                • Cisco Systems Inc. - Business segments
                • Cisco Systems Inc. - Key news
                • Cisco Systems Inc. - Key offerings
                • Cisco Systems Inc. - Segment focus
                • SWOT
              • 14.8 Enghouse Systems Ltd.
                • Enghouse Systems Ltd. - Overview
                • Enghouse Systems Ltd. - Business segments
                • Enghouse Systems Ltd. - Key offerings
                • Enghouse Systems Ltd. - Segment focus
                • SWOT
              • 14.9 Google LLC
                • Google LLC - Overview
                • Google LLC - Product / Service
                • Google LLC - Key offerings
                • SWOT
              • 14.10 HP Inc.
                • HP Inc. - Overview
                • HP Inc. - Business segments
                • HP Inc. - Key news
                • HP Inc. - Key offerings
                • HP Inc. - Segment focus
                • SWOT
              • 14.11 Huawei Technologies Co. Ltd.
                • Huawei Technologies Co. Ltd. - Overview
                • Huawei Technologies Co. Ltd. - Product / Service
                • Huawei Technologies Co. Ltd. - Key news
                • Huawei Technologies Co. Ltd. - Key offerings
                • SWOT
              • 14.12 Kaltura Inc.
                • Kaltura Inc. - Overview
                • Kaltura Inc. - Business segments
                • Kaltura Inc. - Key offerings
                • Kaltura Inc. - Segment focus
                • SWOT
              • 14.13 Microsoft Corp.
                • Microsoft Corp. - Overview
                • Microsoft Corp. - Business segments
                • Microsoft Corp. - Key news
                • Microsoft Corp. - Key offerings
                • Microsoft Corp. - Segment focus
                • SWOT
              • 14.14 Pexip Holding ASA
                • Pexip Holding ASA - Overview
                • Pexip Holding ASA - Product / Service
                • Pexip Holding ASA - Key offerings
                • SWOT
              • 14.15 Sonic Foundry Inc.
                • Sonic Foundry Inc. - Overview
                • Sonic Foundry Inc. - Product / Service
                • Sonic Foundry Inc. - Key offerings
                • SWOT
              • 14.16 TIBCO Software Inc.
                • TIBCO Software Inc. - Overview
                • TIBCO Software Inc. - Product / Service
                • TIBCO Software Inc. - Key offerings
                • SWOT
              • 14.17 Verizon Communications Inc.
                • Verizon Communications Inc. - Overview
                • Verizon Communications Inc. - Business segments
                • Verizon Communications Inc. - Key news
                • Verizon Communications Inc. - Key offerings
                • Verizon Communications Inc. - Segment focus
                • SWOT
              • 14.18 Zoom Video Communications Inc.
                • Zoom Video Communications Inc. - Overview
                • Zoom Video Communications Inc. - Product / Service
                • Zoom Video Communications Inc. - Key news
                • Zoom Video Communications Inc. - Key offerings
                • SWOT

              15 Appendix

              • 15.1 Scope of the report
                • 15.2 Inclusions and exclusions checklist
                  • Inclusions checklist
                  • Exclusions checklist
                • 15.3 Currency conversion rates for US$
                  • Currency conversion rates for US$
                • 15.4 Research methodology
                  • Research methodology
                • 15.5 Data procurement
                  • Information sources
                • 15.6 Data validation
                  • Data validation
                • 15.7 Validation techniques employed for market sizing
                  • Validation techniques employed for market sizing
                • 15.8 Data synthesis
                  • Data synthesis
                • 15.9 360 degree market analysis
                  • 360 degree market analysis
                • 15.10 List of abbreviations
                  • List of abbreviations

                Research Methodology

                Technavio presents a detailed picture of the market by way of study, synthesis, and summation of data from multiple sources. The analysts have presented the various facets of the market with a particular focus on identifying the key industry influencers. The data thus presented is comprehensive, reliable, and the result of extensive research, both primary and secondary.

                INFORMATION SOURCES

                Primary sources

                • Manufacturers and suppliers
                • Channel partners
                • Industry experts
                • Strategic decision makers

                Secondary sources

                • Industry journals and periodicals
                • Government data
                • Financial reports of key industry players
                • Historical data
                • Press releases

                DATA ANALYSIS

                Data Synthesis

                • Collation of data
                • Estimation of key figures
                • Analysis of derived insights

                Data Validation

                • Triangulation with data models
                • Reference against proprietary databases
                • Corroboration with industry experts

                REPORT WRITING

                Qualitative

                • Market drivers
                • Market challenges
                • Market trends
                • Five forces analysis

                Quantitative

                • Market size and forecast
                • Market segmentation
                • Geographical insights
                • Competitive landscape

                Interested in this report?

                Get your sample now to see our research methodology and insights!

                Download Now

                Frequently Asked Questions

                Video Conferencing market growth will increase by $ 8843.8 mn during 2025-2029 .

                The Video Conferencing market is expected to grow at a CAGR of 12.6% during 2025-2029 .

                Video Conferencing market is segmented by Component( Hardware, Software, Services) End-user( Large enterprises, Small and medium enterprises, medium enterprises)

                8x8 Inc., Adobe Inc., Amazon.com Inc., Avaya LLC, Cisco Systems Inc., Dialpad Inc., Enghouse Systems Ltd., Google LLC, Haivision Systems Inc., HP Inc., Huawei Technologies Co. Ltd., Kaltura Inc., Logitech International SA, Microsoft Corp., Pexip Holding ASA, RingCentral Inc., Sonic Foundry Inc., TIBCO Software Inc., Verizon Communications Inc., Zoom Video Communications Inc. are a few of the key vendors in the Video Conferencing market.

                North America will register the highest growth rate of 40% among the other regions. Therefore, the Video Conferencing market in North America is expected to garner significant business opportunities for the vendors during the forecast period.

                US, China, India, Canada, Germany, UK, France, Japan, Australia, Brazil

                • Increasing globalization and need for cross-border communicationIncreasing globalization has contributed significantly to the growth of the global video conferencing market by fostering the need for seamless cross-border communication. As businesses expand their operations internationally is the driving factor this market.
                • the demand for efficient communication tools increases to facilitate collaborations among geographically dispersed teams is the driving factor this market.
                • partners is the driving factor this market.
                • and clients. Video conferencing allows organizations to conduct virtual meetings is the driving factor this market.
                • negotiations is the driving factor this market.
                • and presentations in real time is the driving factor this market.
                • overcoming the limitations of distance and differences in time zones. This enables quicker decision-making is the driving factor this market.
                • faster problem-solving is the driving factor this market.
                • and improved productivity is the driving factor this market.
                • leading to better outcomes for businesses. One market player whose offerings cater to cross-border communication needs is Zoom Video Communications. Zoom platform offers high-quality video and audio capabilities is the driving factor this market.
                • along with features such as screen-sharing is the driving factor this market.
                • chats is the driving factor this market.
                • and virtual backgrounds is the driving factor this market.
                • which enable seamless collaboration across teams or groups located in different places is the driving factor this market.
                • countries is the driving factor this market.
                • or regions. Moreover is the driving factor this market.
                • Zoom cloud-based infrastructure ensures easy scalability and accessibility is the driving factor this market.
                • allowing organizations of all sizes to connect globally without the need for extensive IT resources. As a result is the driving factor this market.
                • Zoom has emerged as a preferred choice for businesses seeking reliable and user-friendly video conferencing solutions to support their global operations. Thus is the driving factor this market.
                • due to the above-mentioned factors is the driving factor this market.
                • the global video conferencing market witness positive growth during the forecast period. is the driving factor this market.

                The Video Conferencing market vendors should focus on grabbing business opportunities from the Hardware segment as it accounted for the largest market share in the base year.