Virtual Events Market Analysis North America, APAC, Europe, Middle East and Africa, South America - US, China, Germany, Japan, Canada, India, UK, France, Italy, Brazil - Size and Forecast 2025-2029

Virtual Events Market Analysis North America, APAC, Europe, Middle East and Africa, South America - US, China, Germany, Japan, Canada, India, UK, France, Italy, Brazil - Size and Forecast 2025-2029

Published: Jan 2025 202 Pages SKU: IRTNTR46707

Market Overview at a Glance

$539.5 Mn
Market Opportunity
26.1%
CAGR
22.6
YoY growth 2024-2025(%)

Virtual Events Market Size 2025-2029

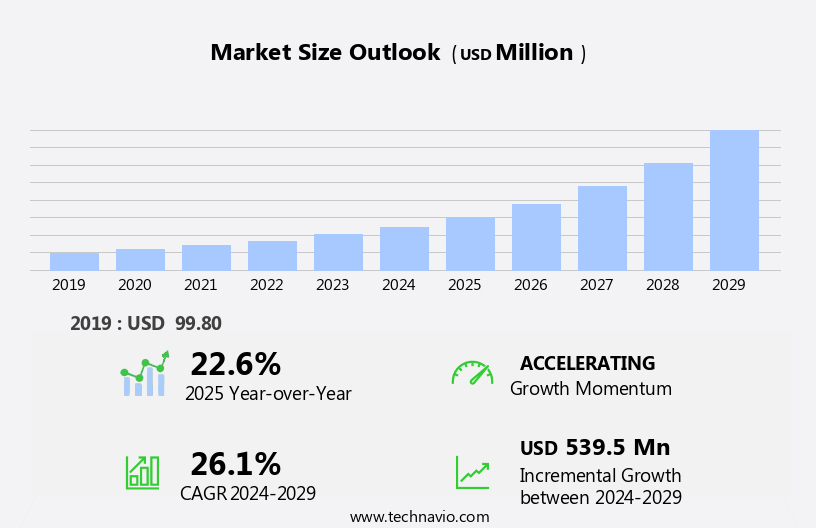
The virtual events market size is forecast to increase by USD 539.5 million, at a CAGR of 26.1% between 2024 and 2029.

  • The market is experiencing significant growth, driven by the increasing number of corporate events transitioning to virtual formats. This shift is fueled by the flexibility and cost savings offered by virtual events, enabling organizations to reach wider audiences and reduce travel expenses. Another key trend is the growing popularity of virtual events in education, as institutions adopt technology-driven solutions to deliver engaging and interactive learning experiences. However, this market faces an emerging threat from open-source virtual events solutions, which may undercut pricing and challenge the business models of established players.
  • Companies seeking to capitalize on market opportunities must focus on delivering superior user experiences, ensuring robust security, and offering innovative features to differentiate themselves. Navigating the challenges of increased competition and maintaining customer loyalty will be crucial for success in the market.

What will be the Size of the Virtual Events Market during the forecast period?

Virtual Events Market Size

Explore in-depth regional segment analysis with market size data - historical 2019-2023 and forecasts 2025-2029 - in the full report.  
Request Free Sample

The market continues to evolve, with dynamic market activities unfolding across various sectors. Seamless integration of user experience (UX) elements, such as virtual backdrops and Q&A modules, enhances attendee engagement in online conferences. Event sponsorship and conversion rates are optimized through email marketing and sponsorship packages. Virtual exhibit booths and virtual tours offer immersive experiences, while attendee engagement tools and virtual workshops facilitate interactive learning. Data analytics and interactive presentations provide valuable insights, enabling effective audience segmentation and event reporting. Virtual trade shows and live streaming services expand reach and accessibility, with high-definition video ensuring optimal audio-visual quality.

Hybrid events incorporate both virtual and physical elements, offering flexibility and convenience. Security features and cybersecurity protocols prioritize attendee privacy and data protection. Registration management, marketing automation, and speaker management streamline event organization. Virtual networking features, such as chat functionality and virtual team building, foster connections. Post-event follow-up and webinar platforms ensure ongoing engagement and lead capture. Social media integration and virtual event ticketing expand reach and accessibility. Bandwidth optimization and polls and surveys facilitate real-time attendee interaction. Event branding, 3D modeling, and virtual career fairs offer unique opportunities for businesses to showcase their offerings. The continuous unfolding of these market activities underscores the evolving nature of the virtual events landscape.

How is this Virtual Events Industry segmented?

The virtual events industry research report provides comprehensive data (region-wise segment analysis), with forecasts and estimates in "USD million" for the period 2025-2029, as well as historical data from 2019-2023 for the following segments.

  • Application
    • UC and C and VC
    • Web conferencing
  • Type
    • Webinar
    • Conference
    • Virtual expo fairs and festivals
    • Entertainment
  • Geography
    • North America
      • US
      • Canada
    • Europe
      • France
      • Germany
      • Italy
      • UK
    • APAC
      • China
      • India
      • Japan
    • South America
      • Brazil
    • Rest of World (ROW)

    By Application Insights

    The uc and c and vc segment is estimated to witness significant growth during the forecast period.

    Virtual events have become a pivotal part of business communication and engagement, offering numerous benefits such as improved accessibility, cost savings, and increased attendee engagement. Virtual training sessions, powered by advanced event management software, enable businesses to deliver immersive learning experiences, integrating CRM systems for seamless data tracking and personalized content strategy. Virtual platforms provide accessibility features for attendees with disabilities, ensuring equal opportunities for participation. Sponsorship packages offer brands new opportunities for exposure, while virtual backdrops and Q&A modules enhance attendee engagement during live sessions. Security features, including cybersecurity protocols, ensure data privacy and protection. Interactive session tools, such as polls and surveys, facilitate real-time audience feedback.

    Email marketing and social media integration expand reach and engagement. High-definition video, live streaming services, and on-demand content provide flexible viewing options. Hybrid events combine the best of in-person and virtual experiences. Data analytics and interactive presentations offer valuable insights, while conversion rates and lead capture tools enable effective marketing automation. Virtual team building, networking features, and chat functionality foster collaboration and community. Virtual exhibit booths, virtual tours, and 3D modeling offer unique opportunities for showcasing products and services. Event branding and speaker management tools ensure a professional and cohesive event experience. Bandwidth optimization and audio-visual quality ensure smooth and uninterrupted delivery of content.

    Virtual career fairs, networking events, and virtual workshops provide opportunities for professional development and skills training. Registration management and attendee engagement tools streamline event planning and management. Webinar platforms offer cost-effective and convenient training solutions. In summary, virtual events have evolved to offer comprehensive solutions for businesses, enabling effective communication, collaboration, and engagement. From virtual training and content delivery to sponsorship opportunities and attendee engagement tools, virtual events provide a versatile and adaptable platform for businesses to connect, learn, and grow.

    Virtual Events Market Size

    Request Free Sample

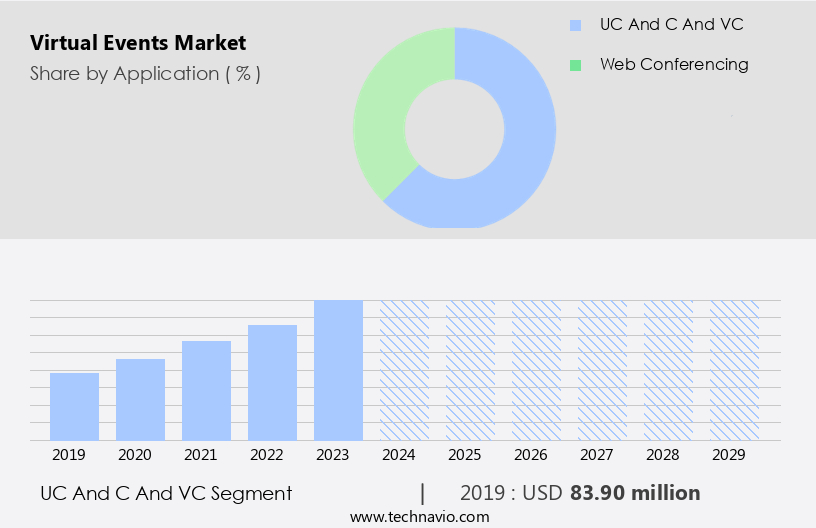
    The UC and C and VC segment was valued at USD 83.90 million in 2019 and showed a gradual increase during the forecast period.
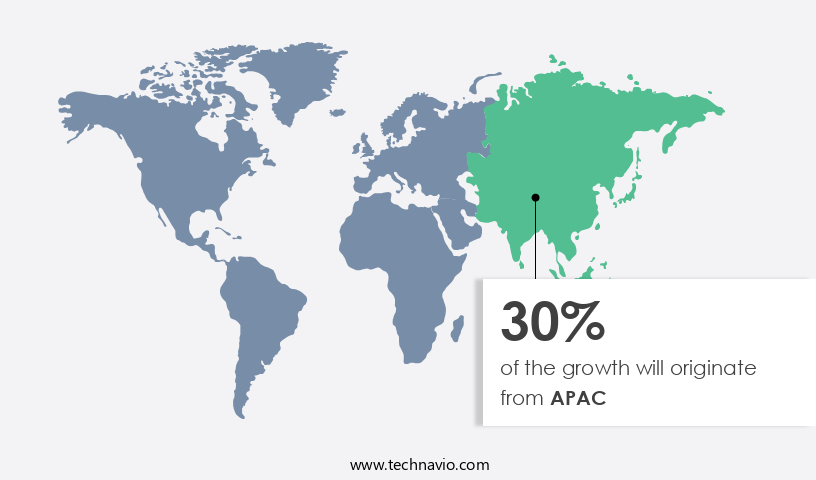
    Regional Analysis

    APAC is estimated to contribute 30% to the growth of the global market during the forecast period.Technavio’s analysts have elaborately explained the regional trends and drivers that shape the market during the forecast period.

    Virtual Events Market Share by Geography

     Request Free Sample

    The market in North America is experiencing significant growth due to the increasing adoption of virtual platforms by IT and retail organizations for hosting global conferences, product launches, and exhibitions. This trend is particularly prominent in North America, which is home to a large number of these companies. The region's entrepreneurial web developer community is also driving demand for cost-effective and user-friendly browser-based communication solutions. Virtual event platforms offer numerous advantages, including integration with CRM systems, accessibility features, content strategy customization, sponsorship packages, and interactive session tools. These platforms also provide email marketing capabilities, event management software, attendee engagement metrics, and user experience enhancements.

    Additionally, virtual events offer data analytics, interactive presentations, live streaming services, virtual concerts, social media integration, virtual event ticketing, and bandwidth optimization. Security features, such as cybersecurity protocols and registration management, are also essential components of these platforms. Furthermore, virtual networking events, chat functionality, post-event follow-up, webinar platforms, virtual team building, event branding, 3D modeling, and virtual tours are becoming increasingly popular. Hybrid events, which combine virtual and in-person components, are also gaining traction. High-definition video and on-demand content are essential features for virtual trade shows and workshops. Overall, the market in North America is expected to continue growing due to the convenience, cost savings, and increased accessibility offered by virtual platforms.

    Market Dynamics

    Our researchers analyzed the data with 2024 as the base year, along with the key drivers, trends, and challenges. A holistic analysis of drivers will help companies refine their marketing strategies to gain a competitive advantage.

    In the dynamic and evolving world of business communication, the market has emerged as a game-changer. This market encompasses a broad spectrum of services, from webinars and online conferences to virtual trade shows and immersive experiences. Virtual event platforms leverage advanced technology, including real-time video conferencing, live streaming, and interactive tools, to facilitate engaging and productive events. Marketers, educators, and businesses increasingly rely on virtual events to reach global audiences, expand their networks, and foster collaboration. Virtual events offer numerous benefits, including cost savings, increased accessibility, and the ability to collect valuable data. Furthermore, they provide opportunities for sponsorships, lead generation, and brand awareness. Virtual events are revolutionizing industries, from healthcare and education to technology and finance, and are set to continue shaping the future of business interactions.

    What are the key market drivers leading to the rise in the adoption of Virtual Events Industry?

    • The increase in the number of corporate events serves as the primary catalyst for market growth. 

    • Virtual events have become an essential component of an organization's marketing and engagement strategy. Instead of physically gathering attendees, businesses now leverage virtual platforms to conduct training sessions, product launches, and client engagement activities. These events offer numerous benefits, such as increased accessibility, integration with CRM systems, and interactive session tools. Virtual training sessions enable organizations to reach a broader audience, regardless of geographical location. Virtual platforms offer integration with CRM systems, allowing businesses to track attendee engagement metrics and follow up on leads effectively. Accessibility features, such as closed captioning and real-time translation, ensure that all attendees can participate fully.
    • Content strategy plays a crucial role in the success of virtual events. Sponsorship packages offer brands an opportunity to showcase their products and services to a targeted audience. Virtual backdrops and custom branding help create a unique event experience. Q&A modules and interactive session tools facilitate engagement and foster meaningful discussions. Security features are essential to protect sensitive information shared during virtual events. Email marketing and event management software help promote events and manage registrations efficiently. Interactive session tools, such as polls and surveys, provide valuable insights and feedback. In conclusion, virtual events offer numerous benefits, including increased accessibility, cost savings, and wider audience reach.
    • By utilizing virtual platforms, organizations can effectively engage with their employees, business partners, and clients, fostering stronger relationships and driving business growth.

    What are the market trends shaping the Virtual Events Industry?

    • The increasing prevalence of virtual events in education signifies a significant market trend. This shift towards digital learning platforms is mandatory for staying current in today's professional educational landscape.

    • Virtual events have gained significant traction in various sectors, including education and business. These digital gatherings offer a user-friendly experience (UX), enabling attendees to engage from anywhere in the world. One of the key advantages of virtual events is their ability to provide access to high-caliber speakers and resources, transcending geographical boundaries. Sponsorship opportunities in virtual events offer brands increased visibility and engagement with their target audience. Moreover, virtual events offer advanced features such as audience segmentation, event reporting, virtual exhibit booths, virtual tours, attendee engagement tools, virtual workshops, and virtual trade shows. These interactive elements enhance the overall experience and facilitate meaningful connections between attendees and exhibitors.
    • Data analytics and interactive presentations further enrich the event experience by providing valuable insights and real-time feedback. Virtual conferences have revolutionized the way businesses interact, allowing for more effective communication and collaboration. With the ability to connect event profiles with social media profiles, virtual events offer increased opportunities for networking and lead generation. By leveraging these features, businesses can optimize their virtual event strategies for higher conversion rates and long-term engagement.

    What challenges does the Virtual Events Industry face during its growth?

    • The emergence of open-source virtual events solutions poses a significant challenge to the industry's growth, as organizations grapple with ensuring security, compatibility, and scalability in their virtual event platforms. 

    • Open-source virtual events present formidable competition for commercial enterprises, offering cost-effective solutions for micro and small-scale businesses and individual users. These freely available software solutions can be downloaded and run on various platforms, making them an attractive alternative to proprietary virtual events with high purchasing and licensing costs. Basic features such as live streaming services, social media integration, virtual event ticketing, bandwidth optimization, high-definition video, polls and surveys, hybrid events, and virtual networking features are commonly available in both open-source and proprietary virtual events.
    • However, the availability of open-source options poses a significant challenge to proprietary event management companies. For individuals planning small-scale events, the cost-effectiveness of open-source virtual events is a compelling advantage. The market dynamics of virtual events continue to evolve, with open-source solutions playing an increasingly important role in the virtual events landscape.

    Exclusive Customer Landscape

    The virtual events market forecasting report includes the adoption lifecycle of the market, covering from the innovator’s stage to the laggard’s stage. It focuses on adoption rates in different regions based on penetration. Furthermore, the virtual events market report also includes key purchase criteria and drivers of price sensitivity to help companies evaluate and develop their market growth analysis strategies.
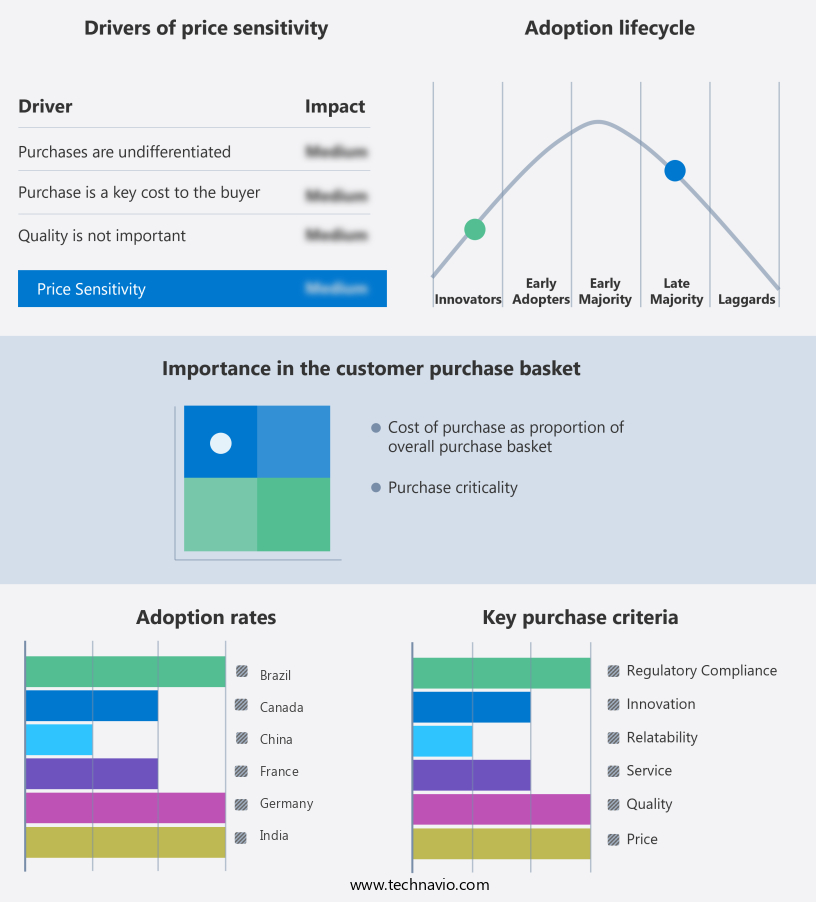
    Virtual Events Market Share by Geography

     Customer Landscape

    Key Companies & Market Insights

    Companies are implementing various strategies, such as strategic alliances, virtual events market forecast, partnerships, mergers and acquisitions, geographical expansion, and product/service launches, to enhance their presence in the industry.

    8x8 Inc. - The company specializes in providing virtual event solutions, including advanced video conferencing capabilities. Our services enable seamless communication and collaboration among remote participants, enhancing engagement and productivity. By leveraging innovative technologies, we ensure high-quality audio and video, secure data transmission, and user-friendly interfaces. Our virtual event services cater to various industries and organizations, offering flexibility and convenience while reducing travel costs and carbon footprint. With a focus on reliability and security, we deliver customizable and scalable solutions tailored to our clients' unique needs.

    The industry research and growth report includes detailed analyses of the competitive landscape of the market and information about key companies, including:

    • 8x8 Inc.
    • Active Network LLC
    • Adobe Inc.
    • ALE International
    • Atlassian Corp Plc
    • Avaya LLC
    • Aventri Inc.
    • Bizzabo
    • Cadence Design Systems Inc.
    • Cisco Systems Inc.
    • Cvent Holding Corp.
    • EventX Ltd.
    • Huawei Technologies Co. Ltd.
    • Hubb
    • International Business Machines Corp.
    • Microsoft Corp.
    • Mitel Networks Corp.
    • Toshiba Corp.
    • Ungerboeck
    • Zoom Video Communications Inc.

    Qualitative and quantitative analysis of companies has been conducted to help clients understand the wider business environment as well as the strengths and weaknesses of key industry players. Data is qualitatively analyzed to categorize companies as pure play, category-focused, industry-focused, and diversified; it is quantitatively analyzed to categorize companies as dominant, leading, strong, tentative, and weak.

    Recent Development and News in Virtual Events Market

    • In January 2024, Cisco Systems announced the acquisition of Socio Labs, a leading virtual events platform provider, for approximately USD320 million. This acquisition aimed to strengthen Cisco's Webex portfolio and expand its offerings in the market (Cisco Press Release, 2024).
    • In March 2024, Microsoft Teams introduced a new virtual events feature, allowing up to 10,000 attendees per event, marking a significant expansion of its capabilities in the virtual events space (Microsoft Tech Community, 2024).
    • In May 2024, Google Meet partnered with Eventbrite, enabling users to register and join virtual events directly from Google Meet. This collaboration aimed to streamline the virtual event registration and attendance process for users (Google Press Release, 2024).
    • In April 2025, Zoom Video Communications announced a strategic partnership with Salesforce to integrate Zoom's virtual events platform with Salesforce's Event Management solution. This partnership aimed to offer a seamless virtual event experience for Salesforce customers (Zoom Press Release, 2025).

    Research Analyst Overview

    • In the dynamic the market, scalability testing plays a crucial role in ensuring seamless experiences for attendees engaging with mobile apps. Personalized experiences are increasingly important, with performance monitoring and accessibility compliance essential for maintaining user engagement. Real-time translation and closed captioning cater to diverse audiences, while subscription models and virtual assistants streamline event registration and management. Cloud-based platforms offer flexibility and reliability, with security audits and disaster recovery ensuring data protection. Analytics dashboards and data visualization tools provide valuable insights, enabling process automation and customer service through API integrations and automated workflows.
    • Licensing models and technical support cater to various business needs, while multi-lingual support and payment gateways facilitate global reach. Voice recognition and reporting tools further enhance the virtual event experience, making it an indispensable tool for businesses in today's digital landscape.

    Dive into Technavio’s robust research methodology, blending expert interviews, extensive data synthesis, and validated models for unparalleled Virtual Events Market insights. See full methodology.

    Market Scope

    Report Coverage

    Details

    Page number

    202

    Base year

    2024

    Historic period

    2019-2023

    Forecast period

    2025-2029

    Growth momentum & CAGR

    Accelerate at a CAGR of 26.1%

    Market growth 2025-2029

    USD 539.5 million

    Market structure

    Fragmented

    YoY growth 2024-2025(%)

    22.6

    Key countries

    US, China, Germany, Japan, Canada, India, UK, France, Italy, and Brazil

    Competitive landscape

    Leading Companies, Market Positioning of Companies, Competitive Strategies, and Industry Risks

    Request Free Sample

    What are the Key Data Covered in this Virtual Events Market Research and Growth Report?

    • CAGR of the Virtual Events industry during the forecast period
    • Detailed information on factors that will drive the growth and forecasting between 2025 and 2029
    • Precise estimation of the size of the market and its contribution of the industry in focus to the parent market
    • Accurate predictions about upcoming growth and trends and changes in consumer behaviour
    • Growth of the market across North America, APAC, Europe, Middle East and Africa, and South America
    • Thorough analysis of the market’s competitive landscape and detailed information about companies
    • Comprehensive analysis of factors that will challenge the virtual events market growth of industry companies

    We can help! Our analysts can customize this virtual events market research report to meet your requirements.

    Get in touch


    1 Executive Summary

    • 1.1 Market overview
      • Executive Summary - Chart on Market Overview
      • Executive Summary - Data Table on Market Overview
      • Executive Summary - Chart on Global Market Characteristics
      • Executive Summary - Chart on Market by Geography
      • Executive Summary - Chart on Market Segmentation by Application
      • Executive Summary - Chart on Market Segmentation by Type
      • Executive Summary - Chart on Incremental Growth
      • Executive Summary - Data Table on Incremental Growth
      • Executive Summary - Chart on Company Market Positioning

    2 Technavio Analysis

    • 2.1 Analysis of price sensitivity, lifecycle, customer purchase basket, adoption rates, and purchase criteria
      • Analysis of price sensitivity, lifecycle, customer purchase basket, adoption rates, and purchase criteria
    • 2.2 Criticality of inputs and Factors of differentiation
      • Overview on criticality of inputs and factors of differentiation
    • 2.3 Factors of disruption
      • Overview on factors of disruption
    • 2.4 Impact of drivers and challenges
      • Impact of drivers and challenges in 2024 and 2029

    3 Market Landscape

    • 3.1 Market ecosystem
      • Parent Market
      • Data Table on - Parent Market
    • 3.2 Market characteristics
      • Market characteristics analysis
    • 3.3 Value chain analysis
      • Value chain analysis

    4 Market Sizing

    • 4.1 Market definition
      • Offerings of companies included in the market definition
    • 4.2 Market segment analysis
      • Market segments
    • 4.3 Market size 2024
      • 4.4 Market outlook: Forecast for 2024-2029
        • Chart on Global - Market size and forecast 2024-2029 ($ million)
        • Data Table on Global - Market size and forecast 2024-2029 ($ million)
        • Chart on Global Market: Year-over-year growth 2024-2029 (%)
        • Data Table on Global Market: Year-over-year growth 2024-2029 (%)

      5 Historic Market Size

      • 5.1 Global Virtual Events Market 2019 - 2023
        • Historic Market Size - Data Table on Global Virtual Events Market 2019 - 2023 ($ million)
      • 5.2 Application segment analysis 2019 - 2023
        • Historic Market Size - Application Segment 2019 - 2023 ($ million)
      • 5.3 Type segment analysis 2019 - 2023
        • Historic Market Size - Type Segment 2019 - 2023 ($ million)
      • 5.4 Geography segment analysis 2019 - 2023
        • Historic Market Size - Geography Segment 2019 - 2023 ($ million)
      • 5.5 Country segment analysis 2019 - 2023
        • Historic Market Size - Country Segment 2019 - 2023 ($ million)

      6 Qualitative Analysis

      • 6.1 Impact of AI in virtual events market

        7 Five Forces Analysis

        • 7.1 Five forces summary
          • Five forces analysis - Comparison between 2024 and 2029
        • 7.2 Bargaining power of buyers
          • Bargaining power of buyers - Impact of key factors 2024 and 2029
        • 7.3 Bargaining power of suppliers
          • Bargaining power of suppliers - Impact of key factors in 2024 and 2029
        • 7.4 Threat of new entrants
          • Threat of new entrants - Impact of key factors in 2024 and 2029
        • 7.5 Threat of substitutes
          • Threat of substitutes - Impact of key factors in 2024 and 2029
        • 7.6 Threat of rivalry
          • Threat of rivalry - Impact of key factors in 2024 and 2029
        • 7.7 Market condition
          • Chart on Market condition - Five forces 2024 and 2029

        8 Market Segmentation by Application

        • 8.1 Market segments
          • Chart on Application - Market share 2024-2029 (%)
          • Data Table on Application - Market share 2024-2029 (%)
        • 8.2 Comparison by Application
          • Chart on Comparison by Application
          • Data Table on Comparison by Application
        • 8.3 UC and C and VC - Market size and forecast 2024-2029
          • Chart on UC and C and VC - Market size and forecast 2024-2029 ($ million)
          • Data Table on UC and C and VC - Market size and forecast 2024-2029 ($ million)
          • Chart on UC and C and VC - Year-over-year growth 2024-2029 (%)
          • Data Table on UC and C and VC - Year-over-year growth 2024-2029 (%)
        • 8.4 Web conferencing - Market size and forecast 2024-2029
          • Chart on Web conferencing - Market size and forecast 2024-2029 ($ million)
          • Data Table on Web conferencing - Market size and forecast 2024-2029 ($ million)
          • Chart on Web conferencing - Year-over-year growth 2024-2029 (%)
          • Data Table on Web conferencing - Year-over-year growth 2024-2029 (%)
        • 8.5 Market opportunity by Application
          • Market opportunity by Application ($ million)
          • Data Table on Market opportunity by Application ($ million)

        9 Market Segmentation by Type

        • 9.1 Market segments
          • Chart on Type - Market share 2024-2029 (%)
          • Data Table on Type - Market share 2024-2029 (%)
        • 9.2 Comparison by Type
          • Chart on Comparison by Type
          • Data Table on Comparison by Type
        • 9.3 Webinar - Market size and forecast 2024-2029
          • Chart on Webinar - Market size and forecast 2024-2029 ($ million)
          • Data Table on Webinar - Market size and forecast 2024-2029 ($ million)
          • Chart on Webinar - Year-over-year growth 2024-2029 (%)
          • Data Table on Webinar - Year-over-year growth 2024-2029 (%)
        • 9.4 Conference - Market size and forecast 2024-2029
          • Chart on Conference - Market size and forecast 2024-2029 ($ million)
          • Data Table on Conference - Market size and forecast 2024-2029 ($ million)
          • Chart on Conference - Year-over-year growth 2024-2029 (%)
          • Data Table on Conference - Year-over-year growth 2024-2029 (%)
        • 9.5 Virtual expo fairs and festivals - Market size and forecast 2024-2029
          • Chart on Virtual expo fairs and festivals - Market size and forecast 2024-2029 ($ million)
          • Data Table on Virtual expo fairs and festivals - Market size and forecast 2024-2029 ($ million)
          • Chart on Virtual expo fairs and festivals - Year-over-year growth 2024-2029 (%)
          • Data Table on Virtual expo fairs and festivals - Year-over-year growth 2024-2029 (%)
        • 9.6 Entertainment - Market size and forecast 2024-2029
          • Chart on Entertainment - Market size and forecast 2024-2029 ($ million)
          • Data Table on Entertainment - Market size and forecast 2024-2029 ($ million)
          • Chart on Entertainment - Year-over-year growth 2024-2029 (%)
          • Data Table on Entertainment - Year-over-year growth 2024-2029 (%)
        • 9.7 Market opportunity by Type
          • Market opportunity by Type ($ million)
          • Data Table on Market opportunity by Type ($ million)

        10 Customer Landscape

        • 10.1 Customer landscape overview
          • Analysis of price sensitivity, lifecycle, customer purchase basket, adoption rates, and purchase criteria

        11 Geographic Landscape

        • 11.1 Geographic segmentation
          • Chart on Market share by geography 2024-2029 (%)
          • Data Table on Market share by geography 2024-2029 (%)
        • 11.2 Geographic comparison
          • Chart on Geographic comparison
          • Data Table on Geographic comparison
        • 11.3 North America - Market size and forecast 2024-2029
          • Chart on North America - Market size and forecast 2024-2029 ($ million)
          • Data Table on North America - Market size and forecast 2024-2029 ($ million)
          • Chart on North America - Year-over-year growth 2024-2029 (%)
          • Data Table on North America - Year-over-year growth 2024-2029 (%)
        • 11.4 APAC - Market size and forecast 2024-2029
          • Chart on APAC - Market size and forecast 2024-2029 ($ million)
          • Data Table on APAC - Market size and forecast 2024-2029 ($ million)
          • Chart on APAC - Year-over-year growth 2024-2029 (%)
          • Data Table on APAC - Year-over-year growth 2024-2029 (%)
        • 11.5 Europe - Market size and forecast 2024-2029
          • Chart on Europe - Market size and forecast 2024-2029 ($ million)
          • Data Table on Europe - Market size and forecast 2024-2029 ($ million)
          • Chart on Europe - Year-over-year growth 2024-2029 (%)
          • Data Table on Europe - Year-over-year growth 2024-2029 (%)
        • 11.6 Middle East and Africa - Market size and forecast 2024-2029
          • Chart on Middle East and Africa - Market size and forecast 2024-2029 ($ million)
          • Data Table on Middle East and Africa - Market size and forecast 2024-2029 ($ million)
          • Chart on Middle East and Africa - Year-over-year growth 2024-2029 (%)
          • Data Table on Middle East and Africa - Year-over-year growth 2024-2029 (%)
        • 11.7 South America - Market size and forecast 2024-2029
          • Chart on South America - Market size and forecast 2024-2029 ($ million)
          • Data Table on South America - Market size and forecast 2024-2029 ($ million)
          • Chart on South America - Year-over-year growth 2024-2029 (%)
          • Data Table on South America - Year-over-year growth 2024-2029 (%)
        • 11.8 US - Market size and forecast 2024-2029
          • Chart on US - Market size and forecast 2024-2029 ($ million)
          • Data Table on US - Market size and forecast 2024-2029 ($ million)
          • Chart on US - Year-over-year growth 2024-2029 (%)
          • Data Table on US - Year-over-year growth 2024-2029 (%)
        • 11.9 China - Market size and forecast 2024-2029
          • Chart on China - Market size and forecast 2024-2029 ($ million)
          • Data Table on China - Market size and forecast 2024-2029 ($ million)
          • Chart on China - Year-over-year growth 2024-2029 (%)
          • Data Table on China - Year-over-year growth 2024-2029 (%)
        • 11.10 Japan - Market size and forecast 2024-2029
          • Chart on Japan - Market size and forecast 2024-2029 ($ million)
          • Data Table on Japan - Market size and forecast 2024-2029 ($ million)
          • Chart on Japan - Year-over-year growth 2024-2029 (%)
          • Data Table on Japan - Year-over-year growth 2024-2029 (%)
        • 11.11 Germany - Market size and forecast 2024-2029
          • Chart on Germany - Market size and forecast 2024-2029 ($ million)
          • Data Table on Germany - Market size and forecast 2024-2029 ($ million)
          • Chart on Germany - Year-over-year growth 2024-2029 (%)
          • Data Table on Germany - Year-over-year growth 2024-2029 (%)
        • 11.12 Canada - Market size and forecast 2024-2029
          • Chart on Canada - Market size and forecast 2024-2029 ($ million)
          • Data Table on Canada - Market size and forecast 2024-2029 ($ million)
          • Chart on Canada - Year-over-year growth 2024-2029 (%)
          • Data Table on Canada - Year-over-year growth 2024-2029 (%)
        • 11.13 India - Market size and forecast 2024-2029
          • Chart on India - Market size and forecast 2024-2029 ($ million)
          • Data Table on India - Market size and forecast 2024-2029 ($ million)
          • Chart on India - Year-over-year growth 2024-2029 (%)
          • Data Table on India - Year-over-year growth 2024-2029 (%)
        • 11.14 UK - Market size and forecast 2024-2029
          • Chart on UK - Market size and forecast 2024-2029 ($ million)
          • Data Table on UK - Market size and forecast 2024-2029 ($ million)
          • Chart on UK - Year-over-year growth 2024-2029 (%)
          • Data Table on UK - Year-over-year growth 2024-2029 (%)
        • 11.15 France - Market size and forecast 2024-2029
          • Chart on France - Market size and forecast 2024-2029 ($ million)
          • Data Table on France - Market size and forecast 2024-2029 ($ million)
          • Chart on France - Year-over-year growth 2024-2029 (%)
          • Data Table on France - Year-over-year growth 2024-2029 (%)
        • 11.16 Italy - Market size and forecast 2024-2029
          • Chart on Italy - Market size and forecast 2024-2029 ($ million)
          • Data Table on Italy - Market size and forecast 2024-2029 ($ million)
          • Chart on Italy - Year-over-year growth 2024-2029 (%)
          • Data Table on Italy - Year-over-year growth 2024-2029 (%)
        • 11.17 Brazil - Market size and forecast 2024-2029
          • Chart on Brazil - Market size and forecast 2024-2029 ($ million)
          • Data Table on Brazil - Market size and forecast 2024-2029 ($ million)
          • Chart on Brazil - Year-over-year growth 2024-2029 (%)
          • Data Table on Brazil - Year-over-year growth 2024-2029 (%)
        • 11.18 Market opportunity by geography
          • Market opportunity by geography ($ million)
          • Data Tables on Market opportunity by geography ($ million)

        12 Drivers, Challenges, and Opportunity/Restraints

        • 12.1 Market drivers
          • 12.2 Market challenges
            • 12.3 Impact of drivers and challenges
              • Impact of drivers and challenges in 2024 and 2029
            • 12.4 Market opportunities/restraints

              13 Competitive Landscape

              • 13.1 Overview
                • 13.2 Competitive Landscape
                  • Overview on criticality of inputs and factors of differentiation
                • 13.3 Landscape disruption
                  • Overview on factors of disruption
                • 13.4 Industry risks
                  • Impact of key risks on business

                14 Competitive Analysis

                • 14.1 Companies profiled
                  • Companies covered
                • 14.2 Company ranking index
                  • Company ranking index
                • 14.3 Market positioning of companies
                  • Matrix on companies position and classification
                • 8x8 Inc.
                  • 8x8 Inc. - Overview
                  • 8x8 Inc. - Product / Service
                  • 8x8 Inc. - Key news
                  • 8x8 Inc. - Key offerings
                  • SWOT
                • 14.5 Active Network LLC
                  • Active Network LLC - Overview
                  • Active Network LLC - Product / Service
                  • Active Network LLC - Key offerings
                  • SWOT
                • 14.6 Adobe Inc.
                  • Adobe Inc. - Overview
                  • Adobe Inc. - Business segments
                  • Adobe Inc. - Key news
                  • Adobe Inc. - Key offerings
                  • Adobe Inc. - Segment focus
                  • SWOT
                • 14.7 ALE International
                  • ALE International - Overview
                  • ALE International - Product / Service
                  • ALE International - Key offerings
                  • SWOT
                • 14.8 Atlassian Corp Plc
                  • Atlassian Corp Plc - Overview
                  • Atlassian Corp Plc - Product / Service
                  • Atlassian Corp Plc - Key news
                  • Atlassian Corp Plc - Key offerings
                  • SWOT
                • 14.9 Avaya LLC
                  • Avaya LLC - Overview
                  • Avaya LLC - Product / Service
                  • Avaya LLC - Key news
                  • Avaya LLC - Key offerings
                  • SWOT
                • 14.10 Aventri Inc.
                  • Aventri Inc. - Overview
                  • Aventri Inc. - Product / Service
                  • Aventri Inc. - Key news
                  • Aventri Inc. - Key offerings
                  • SWOT
                • 14.11 Bizzabo
                  • Bizzabo - Overview
                  • Bizzabo - Product / Service
                  • Bizzabo - Key offerings
                  • SWOT
                • 14.12 Cisco Systems Inc.
                  • Cisco Systems Inc. - Overview
                  • Cisco Systems Inc. - Business segments
                  • Cisco Systems Inc. - Key news
                  • Cisco Systems Inc. - Key offerings
                  • Cisco Systems Inc. - Segment focus
                  • SWOT
                • 14.13 Cvent Holding Corp.
                  • Cvent Holding Corp. - Overview
                  • Cvent Holding Corp. - Product / Service
                  • Cvent Holding Corp. - Key news
                  • Cvent Holding Corp. - Key offerings
                  • SWOT
                • 14.14 Huawei Technologies Co. Ltd.
                  • Huawei Technologies Co. Ltd. - Overview
                  • Huawei Technologies Co. Ltd. - Product / Service
                  • Huawei Technologies Co. Ltd. - Key news
                  • Huawei Technologies Co. Ltd. - Key offerings
                  • SWOT
                • 14.15 International Business Machines Corp.
                  • International Business Machines Corp. - Overview
                  • International Business Machines Corp. - Business segments
                  • International Business Machines Corp. - Key news
                  • International Business Machines Corp. - Key offerings
                  • International Business Machines Corp. - Segment focus
                  • SWOT
                • 14.16 Microsoft Corp.
                  • Microsoft Corp. - Overview
                  • Microsoft Corp. - Business segments
                  • Microsoft Corp. - Key news
                  • Microsoft Corp. - Key offerings
                  • Microsoft Corp. - Segment focus
                  • SWOT
                • 14.17 Ungerboeck
                  • Ungerboeck - Overview
                  • Ungerboeck - Product / Service
                  • Ungerboeck - Key offerings
                  • SWOT
                • 14.18 Zoom Video Communications Inc.
                  • Zoom Video Communications Inc. - Overview
                  • Zoom Video Communications Inc. - Product / Service
                  • Zoom Video Communications Inc. - Key news
                  • Zoom Video Communications Inc. - Key offerings
                  • SWOT

                15 Appendix

                • 15.1 Scope of the report
                  • 15.2 Inclusions and exclusions checklist
                    • Inclusions checklist
                    • Exclusions checklist
                  • 15.3 Currency conversion rates for US$
                    • Currency conversion rates for US$
                  • 15.4 Research methodology
                    • Research methodology
                  • 15.5 Data procurement
                    • Information sources
                  • 15.6 Data validation
                    • Data validation
                  • 15.7 Validation techniques employed for market sizing
                    • Validation techniques employed for market sizing
                  • 15.8 Data synthesis
                    • Data synthesis
                  • 15.9 360 degree market analysis
                    • 360 degree market analysis
                  • 15.10 List of abbreviations
                    • List of abbreviations

                  Research Methodology

                  Technavio presents a detailed picture of the market by way of study, synthesis, and summation of data from multiple sources. The analysts have presented the various facets of the market with a particular focus on identifying the key industry influencers. The data thus presented is comprehensive, reliable, and the result of extensive research, both primary and secondary.

                  INFORMATION SOURCES

                  Primary sources

                  • Manufacturers and suppliers
                  • Channel partners
                  • Industry experts
                  • Strategic decision makers

                  Secondary sources

                  • Industry journals and periodicals
                  • Government data
                  • Financial reports of key industry players
                  • Historical data
                  • Press releases

                  DATA ANALYSIS

                  Data Synthesis

                  • Collation of data
                  • Estimation of key figures
                  • Analysis of derived insights

                  Data Validation

                  • Triangulation with data models
                  • Reference against proprietary databases
                  • Corroboration with industry experts

                  REPORT WRITING

                  Qualitative

                  • Market drivers
                  • Market challenges
                  • Market trends
                  • Five forces analysis

                  Quantitative

                  • Market size and forecast
                  • Market segmentation
                  • Geographical insights
                  • Competitive landscape

                  Interested in this report?

                  Get your sample now to see our research methodology and insights!

                  Download Now

                  Frequently Asked Questions

                  Virtual Events market growth will increase by $ 539.5 mn during 2025-2029 .

                  The Virtual Events market is expected to grow at a CAGR of 26.1% during 2025-2029 .

                  Virtual Events market is segmented by Application( UC and C and VC, Web conferencing, video conferencing, Web conferencing) Type( Webinar, Conference, Virtual expo fairs and festivals, Entertainment, South America)

                  8x8 Inc., Active Network LLC, Adobe Inc., ALE International, Atlassian Corp Plc, Avaya LLC, Aventri Inc., Bizzabo, Cadence Design Systems Inc., Cisco Systems Inc., Cvent Holding Corp., EventX Ltd., Huawei Technologies Co. Ltd., Hubb, International Business Machines Corp., Microsoft Corp., Mitel Networks Corp., Toshiba Corp., Ungerboeck, Zoom Video Communications Inc. are a few of the key vendors in the Virtual Events market.

                  APAC will register the highest growth rate of 30% among the other regions. Therefore, the Virtual Events market in APAC is expected to garner significant business opportunities for the vendors during the forecast period.

                  US, China, Germany, Japan, Canada, India, UK, France, Italy, Brazil

                  • Rise in number of corporate eventsOrganizations hold corporate events for their employees is the driving factor this market.
                  • business partners is the driving factor this market.
                  • and clients. Events are also organized to launch and promote new products and to celebrate the success of the existing products and services. In addition is the driving factor this market.
                  • events are organized to nurture customer relationships and to foster client relations. Delegates expect meetings and events to be organized with efficient time management. Organizations use virtual events to ensure efficiency is the driving factor this market.
                  • save advertising costs is the driving factor this market.
                  • and have a wider audience reach. Enterprises arrange corporate events for employees is the driving factor this market.
                  • business partners is the driving factor this market.
                  • and existing and future clients. Thus is the driving factor this market.
                  • organizations use virtual events as they are an efficient and cost-effective way to save advertising costs and reach out to the maximum number of viewers. An increase in the number of corporate events is the driving factor this market.
                  • such as conferences is the driving factor this market.
                  • training is the driving factor this market.
                  • seminars is the driving factor this market.
                  • and fundraisers is the driving factor this market.
                  • is driving the global virtual events market. On an average is the driving factor this market.
                  • organizations host five to seven events per year. These number of meetings and events have resulted in direct revenue contributions to the US economy. is the driving factor this market.

                  The Virtual Events market vendors should focus on grabbing business opportunities from the UC and C and VC segment as it accounted for the largest market share in the base year.