Virtualized Evolved Packet Core (Vepc) Market Analysis North America, APAC, Europe, Middle East and Africa, South America - US, China, Germany, Japan, UK - Size and Forecast 2024-2028

Virtualized Evolved Packet Core (Vepc) Market Analysis North America, APAC, Europe, Middle East and Africa, South America - US, China, Germany, Japan, UK - Size and Forecast 2024-2028

Published: Aug 2024 183 Pages SKU: IRTNTR45314

Market Overview at a Glance

$210.65 B
Market Opportunity
78.25%
CAGR
63.63
YoY growth 2023-2024(%)

Virtualized Evolved Packet Core (Vepc) Market Size 2024-2028

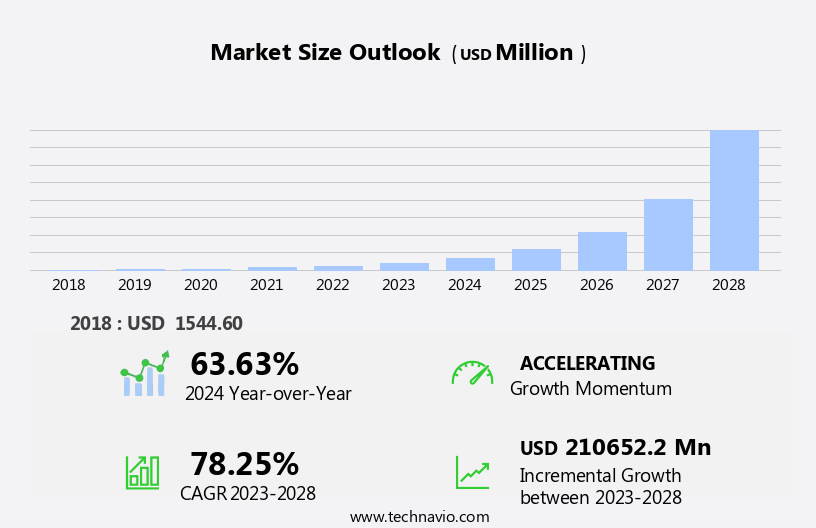
The virtualized evolved packet core (vepc) market size is forecast to increase by USD 210.65 billion at a CAGR of 78.25% between 2023 and 2028.

  • The market is experiencing significant growth due to the increasing adoption of multimedia services and the deployment of 5G infrastructure. The proliferation of multimedia content, such as high-definition videos and real-time applications, is driving the need for more efficient and flexible network solutions. Vepc offers these benefits by enabling network virtualization, allowing for the creation of agile and scalable networks that can effectively manage the increasing data traffic. However, the deployment of vEpc solutions is not without complications. The complexity of integrating vEpc with existing networks and ensuring interoperability with various companies and technologies poses a challenge.
  • Additionally, the high cost of implementation and the need for specialized skills and expertise can hinder market growth. Despite these challenges, the potential benefits of vEpc, including improved network performance, increased flexibility, and reduced operational costs, make it an attractive option for communication service providers and enterprises seeking to capitalize on the growing demand for advanced network solutions. Companies looking to enter or expand their presence in the vEpc market must focus on addressing these challenges and providing innovative solutions to meet the evolving needs of their customers.

What will be the Size of the Virtualized Evolved Packet Core (Vepc) Market during the forecast period?

Virtualized Evolved Packet Core (Vepc) Market Size

 Request Free Sample

  • The Virtualized Evolved Packet Core (VPEC) market is experiencing significant growth as the Internet of Things (IoT) and 5G technologies continue to proliferate. Connected devices, such as those from Lemko, are driving data traffic in various sectors, including telecommunications and enterprise applications. Polaris Networks and other companies are addressing security concerns in the VPEC market by implementing Software-Defined Networking (SDN) and Long-Term Evolution (LTE) frameworks. Xingtera and Telrad Networks are key players in the 5G infrastructure market, providing solutions for data-intensive applications like video streaming and online gaming. Enterprises are increasingly relying on voice and data services, cloud computing, and mobile networks for real-time data transmission.
  • Parallel Wireless and Tecore are addressing bandwidth-intensive activities by offering innovative VPEC solutions. The IoT sector's growth is expected to continue, fueled by the increasing demand for seamless and reliable connectivity. 5G's ability to support massive data transmission and low latency makes it an essential component of the VPEC market's evolution.

How is this Virtualized Evolved Packet Core (Vepc) Industry segmented?

The virtualized evolved packet core (vepc) industry research report provides comprehensive data (region-wise segment analysis), with forecasts and estimates in "USD million" for the period 2024-2028, as well as historical data from 2018-2022 for the following segments.

  • Component
    • Solutions
    • Services
  • Application
    • LTE/VoLTE/VoWiFi
    • MPN and MVNO
    • IoT and M2M
    • BWA
  • Geography
    • North America
      • US
    • Europe
      • Germany
      • UK
    • Middle East and Africa
      • APAC
        • China
        • Japan
      • South America
        • Rest of World (ROW)

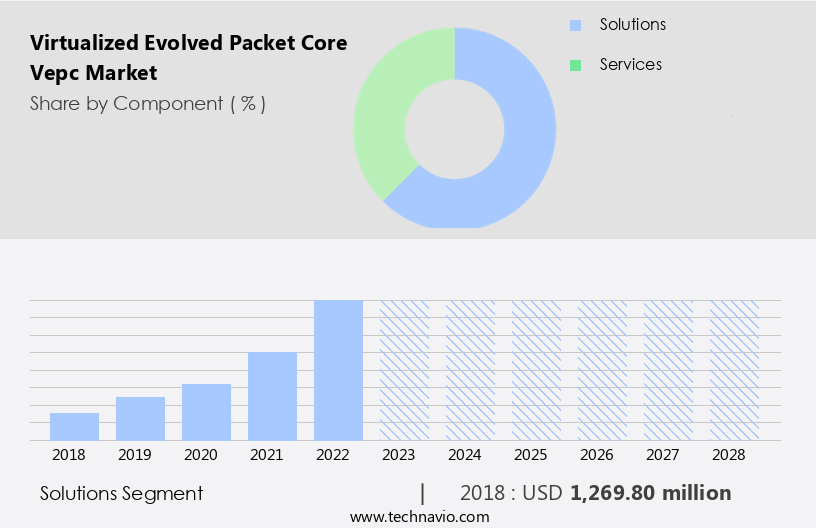
        By Component Insights

        The solutions segment is estimated to witness significant growth during the forecast period.

        The market encompasses a variety of software and hardware solutions offered by companies for deploying and managing vEPC networks. These solutions incorporate functionalities such as Mobility Management Entity (MME), Serving Gateway (SGW), Packet Data Network Gateway (PGW), and other network functions. The software components include virtualized instances of these elements, enabling control, management, and processing capabilities for handling subscriber traffic and services. In the telecommunications sector, network virtualization through vEPC is gaining traction due to the increasing demand for flexibility and network capacity. This is particularly relevant for 5G infrastructure and data-intensive applications like cloud computing, multimedia services, and Machine-to-Machine (M2M) devices.

        Prominent companies like Xingtera, Polaris Networks, Druid Software, Cumucore, and Tech Mahindra are actively contributing to the vEPC market with their innovative solutions. These solutions cater to various industries, including telecommunications operators, service providers, ISPs, enterprises, and IoT sector players. The vEPC market is witnessing significant growth due to the integration of Virtualization Infrastructure (NFVI), SDN, and cloud packet core technologies. These advancements provide the necessary flexibility and network performance for handling bandwidth-intensive activities and real-time data transmission. Security concerns and the need for seamless integration with legacy infrastructure are key challenges in the vEPC market. companies like Parallel Wireless, Athonet, and Affirmed Networks are addressing these challenges by offering solutions that ensure secure network operations and seamless integration with existing infrastructure.

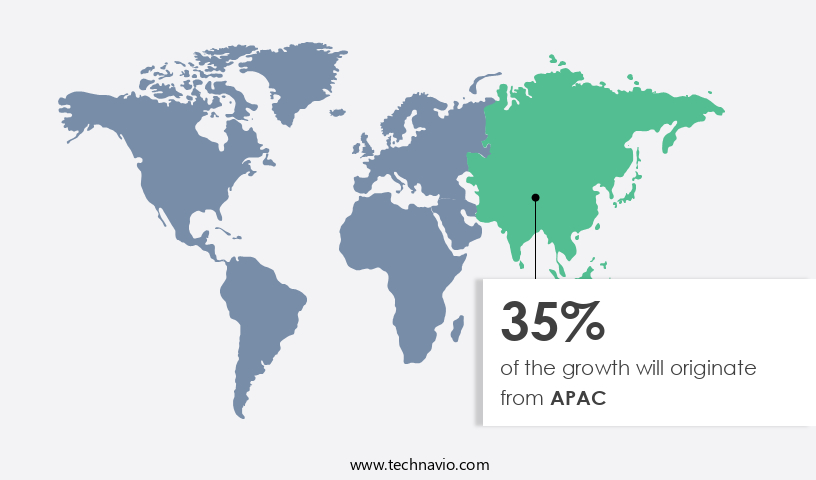
        In the APAC region, the vEPC market is expected to grow significantly due to the increasing adoption of 5G technology and wireless broadband services. This growth is driven by the increasing number of connected devices and the demand for cloud-based services.

        Virtualized Evolved Packet Core (Vepc) Market Size

        Get a glance at the market report of share of various segments Request Free Sample

        The Solutions segment was valued at USD 1.27 billion in 2018 and showed a gradual increase during the forecast period.

        Regional Analysis

        APAC is estimated to contribute 35% to the growth of the global market during the forecast period.Technavio’s analysts have elaborately explained the regional trends and drivers that shape the market during the forecast period.

        Virtualized Evolved Packet Core (Vepc) Market Share by Geography

        For more insights on the market size of various regions, Request Free Sample

        The vEPC market in North America is experiencing notable growth, driven by advanced telecommunications infrastructure and high mobile network penetration. Factors fueling this expansion include the increasing adoption of 4G and 5G networks, the growing demand for efficient mobile data management, and the necessity for network virtualization and flexibility. Major technology companies and telecommunication service providers, such as Xingtera, Polaris Networks, Druid Software, Cumucore, and Tech Mahindra, are key players in this market. They offer vEPC solutions to network operators, enabling them to enhance network performance, scalability, and agility. The vEPC market's growth is further propelled by the integration of IoT, cloud computing, and multimedia services, which generate significant data traffic.

        Additionally, security concerns and the need for increased network capacity are driving the adoption of virtualization technologies like SDN and NFV infrastructure (NFVi). Companies like Parallel Wireless, Mavenir, and Affirmed Networks are also contributing to the market's growth by offering innovative solutions for cellular networks, VoLTE, and real-time data transmission. Overall, the vEPC market in North America is evolving to accommodate the demands of bandwidth-intensive activities, data-intensive applications, and the increasing number of connected devices.

        Market Dynamics

        Our researchers analyzed the data with 2023 as the base year, along with the key drivers, trends, and challenges. A holistic analysis of drivers will help companies refine their marketing strategies to gain a competitive advantage.

        What are the key market drivers leading to the rise in the adoption of Virtualized Evolved Packet Core (Vepc) Industry?

        • Rising use of multimedia services is the key driver of the market. 

        • The increasing usage of multimedia services, including watching, reading, streaming, and posting content, has led to a significant rise in mobile data traffic. In 2022, the average daily time spent on social media was approximately 147 minutes, representing a 63% increase compared to 2012. This trend is driven by the availability of multimedia services on mobile devices and the increasing volume of on-demand content due to digital media. As of March 2024, there were over 5.35 billion internet users worldwide. To accommodate this growing demand, network operators must expand their bandwidth. Virtualized Evolved Packet Core (Vepc) technology plays a crucial role in addressing this challenge by providing a more efficient and scalable network infrastructure.
        • Vepc enables network operators to virtualize their core network functions, reducing costs, improving performance, and enhancing network flexibility. This technology is expected to witness substantial growth due to the increasing demand for high-speed and reliable network services.

        What are the market trends shaping the Virtualized Evolved Packet Core (Vepc) Industry?

        • Deployment of 5G infrastructure is the upcoming market trend. 

        • The telecommunications industry has witnessed significant technological advancements, most notably the rollout of 5G infrastructure. The increasing adoption of Internet of Things (IoT) technology has led to a substantial rise in data traffic, compelling Mobile Network Operators (MNOs) to enhance their networks. By December 2023, India had deployed over 400,000 5G base stations, representing a 7.7-fold increase from the beginning of the year. Software-defined air interfaces are integrated into 5G network architectures, and vEPC (Virtualized Evolved Packet Core) is a crucial component in this evolution.
        • VEPC enables MNOs to efficiently utilize radio resources and increase network capacity, making it an essential element for 5G networks. Faster data transfer and on-demand network services are key benefits of 5G, and the implementation of vEPC is expected to drive market growth during the forecast period.

        What challenges does the Virtualized Evolved Packet Core (Vepc) Industry face during its growth?

        • Complications associated with deployment of vEPC solution is a key challenge affecting the industry growth. 

        • The implementation of Virtualized Evolved Packet Core (vEPC) solutions poses intricate challenges for telecommunications and IT networks. One of the primary considerations is meeting the stringent demands for mobile broadband service availability, including coverage and capacity. Real-time performance monitoring is essential for managing a mix of traditional and cloud-based communication infrastructure. However, IT networks and cloud-based enterprises are not designed to accommodate the stringent regulations related to mobile core network requirements. Government regulations in telecommunication networks, such as maintaining network functionality during nodal failure, add complexity to vEPC deployment.
        • These regulations present a challenge for integrating vEPC into existing IT and telecommunications infrastructure. Despite these complications, vEPC offers numerous benefits, including improved network efficiency, reduced costs, and enhanced service agility. As the market for vEPC continues to evolve, addressing these challenges will be crucial for successful implementation.

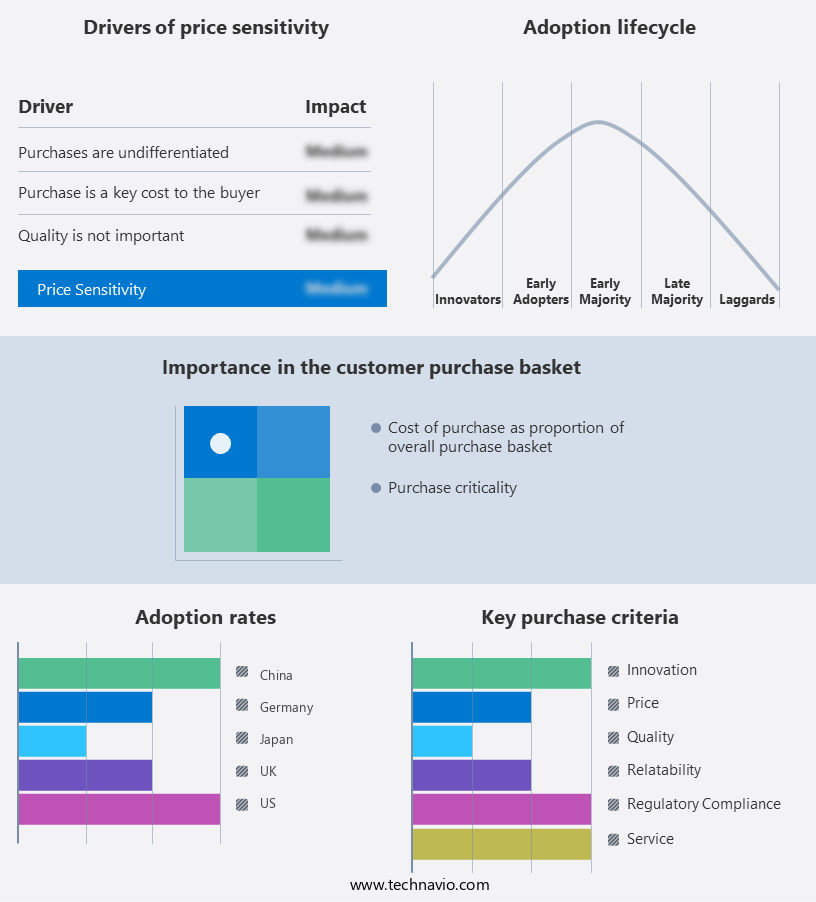
        Exclusive Customer Landscape

        The virtualized evolved packet core (vepc) market forecasting report includes the adoption lifecycle of the market, covering from the innovator’s stage to the laggard’s stage. It focuses on adoption rates in different regions based on penetration. Furthermore, the virtualized evolved packet core (vepc) market report also includes key purchase criteria and drivers of price sensitivity to help companies evaluate and develop their market growth analysis strategies.

        Virtualized Evolved Packet Core (Vepc) Market Share by Geography

         Customer Landscape

        Key Companies & Market Insights

        Companies are implementing various strategies, such as strategic alliances, virtualized evolved packet core (vepc) market forecast, partnerships, mergers and acquisitions, geographical expansion, and product/service launches, to enhance their presence in the industry.

        Athonet Srl - The company specializes in the development and distribution of innovative sports products, catering to diverse consumer needs and preferences. Our offerings span various categories, including equipment, apparel, and nutrition, all designed to enhance athletic performance and promote an active lifestyle. Through rigorous research and development, we continually push the boundaries of sports technology to deliver cutting-edge solutions that meet the evolving demands of modern athletes. Our commitment to quality and customer satisfaction sets us apart in the industry.

        The industry research and growth report includes detailed analyses of the competitive landscape of the market and information about key companies, including:

        • Athonet Srl
        • Cassava Technologies
        • Cisco Systems Inc.
        • Cumucore Oy
        • Druid Software
        • Huawei Technologies Co., Ltd.
        • International Business Machines Corp.
        • IPLOOK Technologies
        • Mavenir Systems Inc.
        • Microsoft Corp.
        • Mitel Networks Corp.
        • Motorola Solutions Inc.
        • NEC Corp.
        • Nokia Corp.
        • Parallel Wireless Inc.
        • Samsung Electronics Co. Ltd.
        • Tech Mahindra Ltd.
        • Telefonaktiebolaget LM Ericsson
        • Twilio Inc.
        • ZTE Corp.

        Qualitative and quantitative analysis of companies has been conducted to help clients understand the wider business environment as well as the strengths and weaknesses of key industry players. Data is qualitatively analyzed to categorize companies as pure play, category-focused, industry-focused, and diversified; it is quantitatively analyzed to categorize companies as dominant, leading, strong, tentative, and weak.

        Research Analyst Overview

        The market is experiencing significant growth as network virtualization technologies continue to gain traction in the telecommunications sector. VEPC, a key component of Network Functions Virtualization (NFV) infrastructure (NFVI), enables the separation of control and user planes, allowing for increased flexibility and efficiency in managing voice and data traffic. The adoption of VEPC is driven by several factors, including the increasing demand for SDN solutions and the integration of IoT devices in various industries. The proliferation of 5G infrastructure and the shift towards cloud computing are also major catalysts for the market's expansion. Prominent companies in the telecommunications sector are investing heavily in VEPC technology to enhance network capacity and improve network performance.

        Xingtera, Polaris Networks, Tecore, Druid Software, and Cumucore are some of the key players in the VEPC market. These companies offer innovative solutions to address the bandwidth-intensive activities and real-time data transmission requirements of various applications, including multimedia services, online gaming, and M2M devices. The VEPC market is particularly relevant to mobile networks, as it enables the virtualization of CSPS and VoLTE functions, thereby reducing the reliance on legacy infrastructure. Telecommunication operators and service providers are increasingly turning to VEPC to address the growing demand for cloud-based services and wireless broadband. The APAC region is expected to be a major contributor to the growth of the VEPC market, driven by the increasing adoption of 5G technology and the rising number of connected devices.

        The flexibility offered by VEPC solutions is particularly attractive to ISPs and enterprises, as it enables them to optimize their network resources and improve network security. However, the adoption of VEPC is not without challenges. Security concerns related to data privacy and network security are major concerns for telecom operators and service providers. Ensuring the seamless integration of VEPC with existing network infrastructure and ensuring network performance during bandwidth-intensive activities are also key challenges. Despite these challenges, the VEPC market is expected to continue its growth trajectory, driven by the increasing demand for 5G networks, the proliferation of IoT devices, and the shift towards cloud-based services.

        The market is expected to witness significant innovation in the coming years, with companies focusing on developing advanced VEPC solutions to address the evolving needs of the telecommunications sector. In summary, the market is experiencing significant growth, driven by the increasing adoption of network virtualization technologies and the integration of IoT devices in various industries. The market is expected to continue its growth trajectory, driven by the increasing demand for 5G networks, the proliferation of IoT devices, and the shift towards cloud-based services. The flexibility offered by VEPC solutions is particularly attractive to telecom operators and service providers, enabling them to optimize their network resources and improve network performance.

        However, security concerns and the challenges of integrating VEPC with existing network infrastructure are major challenges that need to be addressed.

        Market Scope

        Report Coverage

        Details

        Page number

        183

        Base year

        2023

        Historic period

        2018-2022

        Forecast period

        2024-2028

        Growth momentum & CAGR

        Accelerate at a CAGR of 78.25%

        Market growth 2024-2028

        USD 210652.2 million

        Market structure

        Fragmented

        YoY growth 2023-2024(%)

        63.63

        Key countries

        US, China, Germany, Japan, and UK

        Competitive landscape

        Leading Companies, Market Positioning of Companies, Competitive Strategies, and Industry Risks

        Request Free Sample

        What are the Key Data Covered in this Virtualized Evolved Packet Core (Vepc) Market Research and Growth Report?

        • CAGR of the Virtualized Evolved Packet Core (Vepc) industry during the forecast period
        • Detailed information on factors that will drive the growth and forecasting between 2024 and 2028
        • Precise estimation of the size of the market and its contribution of the industry in focus to the parent market
        • Accurate predictions about upcoming growth and trends and changes in consumer behaviour
        • Growth of the market across North America, APAC, Europe, Middle East and Africa, and South America
        • Thorough analysis of the market’s competitive landscape and detailed information about companies
        • Comprehensive analysis of factors that will challenge the virtualized evolved packet core (vepc) market growth of industry companies

        We can help! Our analysts can customize this virtualized evolved packet core (vepc) market research report to meet your requirements.

        Get in touch


        1 Executive Summary

        • 1.1 Market overview
          • Executive Summary - Chart on Market Overview
          • Executive Summary - Data Table on Market Overview
          • Executive Summary - Chart on Global Market Characteristics
          • Executive Summary - Chart on Market by Geography
          • Executive Summary - Chart on Market Segmentation by Component
          • Executive Summary - Chart on Market Segmentation by Application
          • Executive Summary - Chart on Incremental Growth
          • Executive Summary - Data Table on Incremental Growth
          • Executive Summary - Chart on Company Market Positioning

        2 Market Landscape

        • 2.1 Market ecosystem
          • Parent Market
          • Data Table on - Parent Market
        • 2.2 Market characteristics
          • Market characteristics analysis
        • 2.3 Value chain analysis
          • Value Chain Analysis

        3 Market Sizing

        • 3.1 Market definition
          • Offerings of companies included in the market definition
        • 3.2 Market segment analysis
          • Market segments
        • 3.3 Market size 2023
          • 3.4 Market outlook: Forecast for 2023-2028
            • Chart on Global - Market size and forecast 2023-2028 ($ million)
            • Data Table on Global - Market size and forecast 2023-2028 ($ million)
            • Chart on Global Market: Year-over-year growth 2023-2028 (%)
            • Data Table on Global Market: Year-over-year growth 2023-2028 (%)

          4 Historic Market Size

          • 4.1 Global Virtualized Evolved Packet Core (VEPC) Market 2018 - 2022
            • Historic Market Size - Data Table on Global Virtualized Evolved Packet Core (VEPC) Market 2018 - 2022 ($ million)
          • 4.2 Component segment analysis 2018 - 2022
            • Historic Market Size - Component Segment 2018 - 2022 ($ million)
          • 4.3 Application segment analysis 2018 - 2022
            • Historic Market Size - Application Segment 2018 - 2022 ($ million)
          • 4.4 Geography segment analysis 2018 - 2022
            • Historic Market Size - Geography Segment 2018 - 2022 ($ million)
          • 4.5 Country segment analysis 2018 - 2022
            • Historic Market Size - Country Segment 2018 - 2022 ($ million)

          5 Five Forces Analysis

          • 5.1 Five forces summary
            • Five forces analysis - Comparison between 2023 and 2028
          • 5.2 Bargaining power of buyers
            • Bargaining power of buyers - Impact of key factors 2023 and 2028
          • 5.3 Bargaining power of suppliers
            • Bargaining power of suppliers - Impact of key factors in 2023 and 2028
          • 5.4 Threat of new entrants
            • Threat of new entrants - Impact of key factors in 2023 and 2028
          • 5.5 Threat of substitutes
            • Threat of substitutes - Impact of key factors in 2023 and 2028
          • 5.6 Threat of rivalry
            • Threat of rivalry - Impact of key factors in 2023 and 2028
          • 5.7 Market condition
            • Chart on Market condition - Five forces 2023 and 2028

          6 Market Segmentation by Component

          • 6.1 Market segments
            • Chart on Component - Market share 2023-2028 (%)
            • Data Table on Component - Market share 2023-2028 (%)
          • 6.2 Comparison by Component
            • Chart on Comparison by Component
            • Data Table on Comparison by Component
          • 6.3 Solutions - Market size and forecast 2023-2028
            • Chart on Solutions - Market size and forecast 2023-2028 ($ million)
            • Data Table on Solutions - Market size and forecast 2023-2028 ($ million)
            • Chart on Solutions - Year-over-year growth 2023-2028 (%)
            • Data Table on Solutions - Year-over-year growth 2023-2028 (%)
          • 6.4 Services - Market size and forecast 2023-2028
            • Chart on Services - Market size and forecast 2023-2028 ($ million)
            • Data Table on Services - Market size and forecast 2023-2028 ($ million)
            • Chart on Services - Year-over-year growth 2023-2028 (%)
            • Data Table on Services - Year-over-year growth 2023-2028 (%)
          • 6.5 Market opportunity by Component
            • Market opportunity by Component ($ million)
            • Data Table on Market opportunity by Component ($ million)

          7 Market Segmentation by Application

          • 7.1 Market segments
            • Chart on Application - Market share 2023-2028 (%)
            • Data Table on Application - Market share 2023-2028 (%)
          • 7.2 Comparison by Application
            • Chart on Comparison by Application
            • Data Table on Comparison by Application
          • 7.3 LTE/VoLTE/VoWiFi - Market size and forecast 2023-2028
            • Chart on LTE/VoLTE/VoWiFi - Market size and forecast 2023-2028 ($ million)
            • Data Table on LTE/VoLTE/VoWiFi - Market size and forecast 2023-2028 ($ million)
            • Chart on LTE/VoLTE/VoWiFi - Year-over-year growth 2023-2028 (%)
            • Data Table on LTE/VoLTE/VoWiFi - Year-over-year growth 2023-2028 (%)
          • 7.4 MPN and MVNO - Market size and forecast 2023-2028
            • Chart on MPN and MVNO - Market size and forecast 2023-2028 ($ million)
            • Data Table on MPN and MVNO - Market size and forecast 2023-2028 ($ million)
            • Chart on MPN and MVNO - Year-over-year growth 2023-2028 (%)
            • Data Table on MPN and MVNO - Year-over-year growth 2023-2028 (%)
          • 7.5 IoT and M2M - Market size and forecast 2023-2028
            • Chart on IoT and M2M - Market size and forecast 2023-2028 ($ million)
            • Data Table on IoT and M2M - Market size and forecast 2023-2028 ($ million)
            • Chart on IoT and M2M - Year-over-year growth 2023-2028 (%)
            • Data Table on IoT and M2M - Year-over-year growth 2023-2028 (%)
          • 7.6 BWA - Market size and forecast 2023-2028
            • Chart on BWA - Market size and forecast 2023-2028 ($ million)
            • Data Table on BWA - Market size and forecast 2023-2028 ($ million)
            • Chart on BWA - Year-over-year growth 2023-2028 (%)
            • Data Table on BWA - Year-over-year growth 2023-2028 (%)
          • 7.7 Market opportunity by Application
            • Market opportunity by Application ($ million)
            • Data Table on Market opportunity by Application ($ million)

          8 Customer Landscape

          • 8.1 Customer landscape overview
            • Analysis of price sensitivity, lifecycle, customer purchase basket, adoption rates, and purchase criteria

          9 Geographic Landscape

          • 9.1 Geographic segmentation
            • Chart on Market share by geography 2023-2028 (%)
            • Data Table on Market share by geography 2023-2028 (%)
          • 9.2 Geographic comparison
            • Chart on Geographic comparison
            • Data Table on Geographic comparison
          • 9.3 North America - Market size and forecast 2023-2028
            • Chart on North America - Market size and forecast 2023-2028 ($ million)
            • Data Table on North America - Market size and forecast 2023-2028 ($ million)
            • Chart on North America - Year-over-year growth 2023-2028 (%)
            • Data Table on North America - Year-over-year growth 2023-2028 (%)
          • 9.4 APAC - Market size and forecast 2023-2028
            • Chart on APAC - Market size and forecast 2023-2028 ($ million)
            • Data Table on APAC - Market size and forecast 2023-2028 ($ million)
            • Chart on APAC - Year-over-year growth 2023-2028 (%)
            • Data Table on APAC - Year-over-year growth 2023-2028 (%)
          • 9.5 Europe - Market size and forecast 2023-2028
            • Chart on Europe - Market size and forecast 2023-2028 ($ million)
            • Data Table on Europe - Market size and forecast 2023-2028 ($ million)
            • Chart on Europe - Year-over-year growth 2023-2028 (%)
            • Data Table on Europe - Year-over-year growth 2023-2028 (%)
          • 9.6 Middle East and Africa - Market size and forecast 2023-2028
            • Chart on Middle East and Africa - Market size and forecast 2023-2028 ($ million)
            • Data Table on Middle East and Africa - Market size and forecast 2023-2028 ($ million)
            • Chart on Middle East and Africa - Year-over-year growth 2023-2028 (%)
            • Data Table on Middle East and Africa - Year-over-year growth 2023-2028 (%)
          • 9.7 South America - Market size and forecast 2023-2028
            • Chart on South America - Market size and forecast 2023-2028 ($ million)
            • Data Table on South America - Market size and forecast 2023-2028 ($ million)
            • Chart on South America - Year-over-year growth 2023-2028 (%)
            • Data Table on South America - Year-over-year growth 2023-2028 (%)
          • 9.8 US - Market size and forecast 2023-2028
            • Chart on US - Market size and forecast 2023-2028 ($ million)
            • Data Table on US - Market size and forecast 2023-2028 ($ million)
            • Chart on US - Year-over-year growth 2023-2028 (%)
            • Data Table on US - Year-over-year growth 2023-2028 (%)
          • 9.9 China - Market size and forecast 2023-2028
            • Chart on China - Market size and forecast 2023-2028 ($ million)
            • Data Table on China - Market size and forecast 2023-2028 ($ million)
            • Chart on China - Year-over-year growth 2023-2028 (%)
            • Data Table on China - Year-over-year growth 2023-2028 (%)
          • 9.10 Germany - Market size and forecast 2023-2028
            • Chart on Germany - Market size and forecast 2023-2028 ($ million)
            • Data Table on Germany - Market size and forecast 2023-2028 ($ million)
            • Chart on Germany - Year-over-year growth 2023-2028 (%)
            • Data Table on Germany - Year-over-year growth 2023-2028 (%)
          • 9.11 Japan - Market size and forecast 2023-2028
            • Chart on Japan - Market size and forecast 2023-2028 ($ million)
            • Data Table on Japan - Market size and forecast 2023-2028 ($ million)
            • Chart on Japan - Year-over-year growth 2023-2028 (%)
            • Data Table on Japan - Year-over-year growth 2023-2028 (%)
          • 9.12 UK - Market size and forecast 2023-2028
            • Chart on UK - Market size and forecast 2023-2028 ($ million)
            • Data Table on UK - Market size and forecast 2023-2028 ($ million)
            • Chart on UK - Year-over-year growth 2023-2028 (%)
            • Data Table on UK - Year-over-year growth 2023-2028 (%)
          • 9.13 Market opportunity by geography
            • Market opportunity by geography ($ million)
            • Data Tables on Market opportunity by geography ($ million)

          10 Drivers, Challenges, and Opportunity/Restraints

          • 10.1 Market drivers
            • 10.2 Market challenges
              • 10.3 Impact of drivers and challenges
                • Impact of drivers and challenges in 2023 and 2028
              • 10.4 Market opportunities/restraints

                11 Competitive Landscape

                • 11.1 Overview
                  • 11.2 Competitive Landscape
                    • Overview on criticality of inputs and factors of differentiation
                  • 11.3 Landscape disruption
                    • Overview on factors of disruption
                  • 11.4 Industry risks
                    • Impact of key risks on business

                  12 Competitive Analysis

                  • 12.1 Companies profiled
                    • Companies covered
                  • 12.2 Market positioning of companies
                    • Matrix on companies position and classification
                  • 12.3 Athonet Srl
                    • Athonet Srl - Overview
                    • Athonet Srl - Product / Service
                    • Athonet Srl - Key offerings
                  • 12.4 Cassava Technologies
                    • Cassava Technologies - Overview
                    • Cassava Technologies - Product / Service
                    • Cassava Technologies - Key offerings
                  • 12.5 Cisco Systems Inc.
                    • Cisco Systems Inc. - Overview
                    • Cisco Systems Inc. - Business segments
                    • Cisco Systems Inc. - Key news
                    • Cisco Systems Inc. - Key offerings
                    • Cisco Systems Inc. - Segment focus
                  • 12.6 Cumucore Oy
                    • Cumucore Oy - Overview
                    • Cumucore Oy - Product / Service
                    • Cumucore Oy - Key offerings
                  • 12.7 Huawei Technologies Co., Ltd.
                    • Huawei Technologies Co., Ltd. - Overview
                    • Huawei Technologies Co., Ltd. - Product / Service
                    • Huawei Technologies Co., Ltd. - Key news
                    • Huawei Technologies Co., Ltd. - Key offerings
                  • 12.8 International Business Machines Corp.
                    • International Business Machines Corp. - Overview
                    • International Business Machines Corp. - Business segments
                    • International Business Machines Corp. - Key news
                    • International Business Machines Corp. - Key offerings
                    • International Business Machines Corp. - Segment focus
                  • 12.9 IPLOOK Technologies
                    • IPLOOK Technologies - Overview
                    • IPLOOK Technologies - Product / Service
                    • IPLOOK Technologies - Key offerings
                  • 12.10 Mavenir Systems Inc.
                    • Mavenir Systems Inc. - Overview
                    • Mavenir Systems Inc. - Product / Service
                    • Mavenir Systems Inc. - Key offerings
                  • 12.11 Microsoft Corp.
                    • Microsoft Corp. - Overview
                    • Microsoft Corp. - Business segments
                    • Microsoft Corp. - Key news
                    • Microsoft Corp. - Key offerings
                    • Microsoft Corp. - Segment focus
                  • 12.12 NEC Corp.
                    • NEC Corp. - Overview
                    • NEC Corp. - Business segments
                    • NEC Corp. - Key news
                    • NEC Corp. - Key offerings
                    • NEC Corp. - Segment focus
                  • 12.13 Nokia Corp.
                    • Nokia Corp. - Overview
                    • Nokia Corp. - Business segments
                    • Nokia Corp. - Key news
                    • Nokia Corp. - Key offerings
                    • Nokia Corp. - Segment focus
                  • 12.14 Samsung Electronics Co. Ltd.
                    • Samsung Electronics Co. Ltd. - Overview
                    • Samsung Electronics Co. Ltd. - Business segments
                    • Samsung Electronics Co. Ltd. - Key news
                    • Samsung Electronics Co. Ltd. - Key offerings
                    • Samsung Electronics Co. Ltd. - Segment focus
                  • 12.15 Telefonaktiebolaget LM Ericsson
                    • Telefonaktiebolaget LM Ericsson - Overview
                    • Telefonaktiebolaget LM Ericsson - Business segments
                    • Telefonaktiebolaget LM Ericsson - Key news
                    • Telefonaktiebolaget LM Ericsson - Key offerings
                    • Telefonaktiebolaget LM Ericsson - Segment focus
                  • 12.16 Twilio Inc.
                    • Twilio Inc. - Overview
                    • Twilio Inc. - Product / Service
                    • Twilio Inc. - Key news
                    • Twilio Inc. - Key offerings
                  • 12.17 ZTE Corp.
                    • ZTE Corp. - Overview
                    • ZTE Corp. - Business segments
                    • ZTE Corp. - Key offerings
                    • ZTE Corp. - Segment focus

                  13 Appendix

                  • 13.1 Scope of the report
                    • 13.2 Inclusions and exclusions checklist
                      • Inclusions checklist
                      • Exclusions checklist
                    • 13.3 Currency conversion rates for US$
                      • Currency conversion rates for US$
                    • 13.4 Research methodology
                      • Research methodology
                    • 13.5 Data procurement
                      • Information sources
                    • 13.6 Data validation
                      • Data validation
                    • 13.7 Validation techniques employed for market sizing
                      • Validation techniques employed for market sizing
                    • 13.8 Data synthesis
                      • Data synthesis
                    • 13.9 360 degree market analysis
                      • 360 degree market analysis
                    • 13.10 List of abbreviations
                      • List of abbreviations

                    Research Methodology

                    Technavio presents a detailed picture of the market by way of study, synthesis, and summation of data from multiple sources. The analysts have presented the various facets of the market with a particular focus on identifying the key industry influencers. The data thus presented is comprehensive, reliable, and the result of extensive research, both primary and secondary.

                    INFORMATION SOURCES

                    Primary sources

                    • Manufacturers and suppliers
                    • Channel partners
                    • Industry experts
                    • Strategic decision makers

                    Secondary sources

                    • Industry journals and periodicals
                    • Government data
                    • Financial reports of key industry players
                    • Historical data
                    • Press releases

                    DATA ANALYSIS

                    Data Synthesis

                    • Collation of data
                    • Estimation of key figures
                    • Analysis of derived insights

                    Data Validation

                    • Triangulation with data models
                    • Reference against proprietary databases
                    • Corroboration with industry experts

                    REPORT WRITING

                    Qualitative

                    • Market drivers
                    • Market challenges
                    • Market trends
                    • Five forces analysis

                    Quantitative

                    • Market size and forecast
                    • Market segmentation
                    • Geographical insights
                    • Competitive landscape

                    Interested in this report?

                    Get your sample now to see our research methodology and insights!

                    Download Now

                    Frequently Asked Questions

                    Virtualized Evolved Packet Core (Vepc) market growth will increase by $ 210652.2 mn during 2024-2028.

                    The Virtualized Evolved Packet Core (Vepc) market is expected to grow at a CAGR of 78.25% during 2024-2028.

                    Virtualized Evolved Packet Core (Vepc) market is segmented by Component( Solutions, Services, IoT and M2M, BWA) Application( LTE/VoLTE/VoWiFi, MPN and MVNO, IoT and M2M, BWA, South America)

                    Athonet Srl, Cassava Technologies, Cisco Systems Inc., Cumucore Oy, Druid Software, Huawei Technologies Co., Ltd., International Business Machines Corp., IPLOOK Technologies, Mavenir Systems Inc., Microsoft Corp., Mitel Networks Corp., Motorola Solutions Inc., NEC Corp., Nokia Corp., Parallel Wireless Inc., Samsung Electronics Co. Ltd., Tech Mahindra Ltd., Telefonaktiebolaget LM Ericsson, Twilio Inc., ZTE Corp. are a few of the key vendors in the Virtualized Evolved Packet Core (Vepc) market.

                    APAC will register the highest growth rate of 35% among the other regions. Therefore, the Virtualized Evolved Packet Core (Vepc) market in APAC is expected to garner significant business opportunities for the vendors during the forecast period.

                    US, China, Germany, Japan, UK

                    • Rising use of multimedia servicesWatching is the driving factor this market.
                    • reading is the driving factor this market.
                    • streaming is the driving factor this market.
                    • and posting media content refer to the use of multimedia services. In 2022 is the driving factor this market.
                    • the average time spent on social media was around 147 minutes per day is the driving factor this market.
                    • which increased to around 63% when compared with 2012. The use of multimedia services is rising rapidly due to the following:Availability of access to multimedia services on mobile devicesRising volume of on-demand content due to the availability of digital mediaThe use of smartphones enables people to access their preferred multimedia services. As of March 2024 is the driving factor this market.
                    • there were 5.35 billion internet users worldwide. The rising use of multimedia services increases mobile data traffic is the driving factor this market.
                    • which requires network operators to expand their bandwidth. Therefore is the driving factor this market.
                    • they will implement vEPC to provide smartphones with better LTE services. Therefore is the driving factor this market.
                    • the rising use of multimedia services is expected to drive the growth of the global vEPC market during the forecast period. is the driving factor this market.

                    The Virtualized Evolved Packet Core (Vepc) market vendors should focus on grabbing business opportunities from the Solutions segment as it accounted for the largest market share in the base year.