
Water Risk Intelligence Software Market Size and Growth Forecast 2026-2030
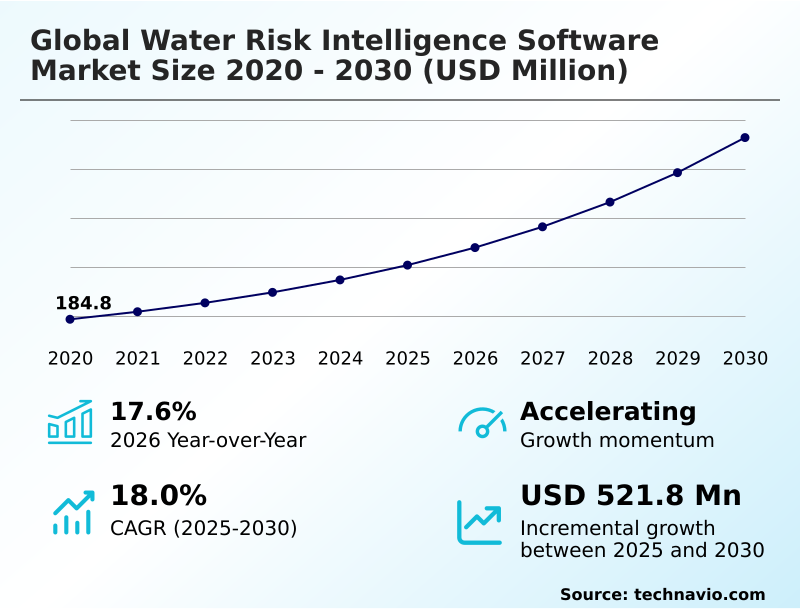
The Water Risk Intelligence Software Market size was valued at USD 406.3 million in 2025 growing at a CAGR of 18% during the forecast period 2026-2030.
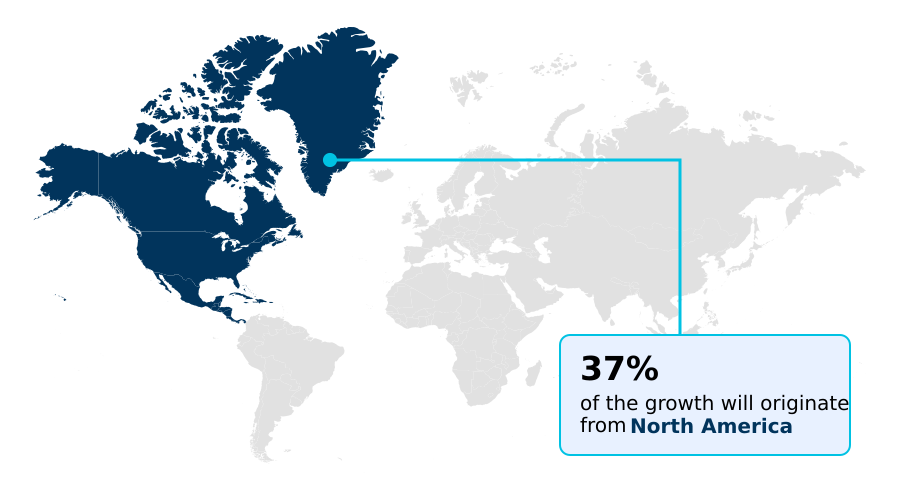
North America accounts for 37% of incremental growth during the forecast period. The Physical water risk analytics segment by Type was valued at USD 141.1 million in 2024, while the Cloud based segment holds the largest revenue share by Deployment.
The market is projected to grow by USD 743.3 million from 2020 to 2030, with USD 521.8 million of the growth expected during the forecast period of 2025 to 2030.
Get Key Insights on Market Forecast (PDF) Request Free Sample
Water Risk Intelligence Software Market Overview
The water risk intelligence software market is expanding at a year-over-year rate of 17.6%, propelled by the convergence of escalating climate volatility and stringent regulatory pressures. Organizations are moving beyond reactive measures, adopting platforms that utilize machine learning algorithms and predictive climate modeling for water scarcity assessment and flood potential analysis. This involves detailed hydrological modeling powered by real-time sensor integration and satellite remote sensing. For instance, a multinational food and beverage corporation can implement a supply chain water auditing system to monitor the water intensity of raw material production in real-time, enabling immediate adjustments to its water reclamation process optimization in regions identified through water stress mapping. This proactive stance is essential for mitigating regulatory compliance risk and fulfilling environmental social governance reporting mandates, which now demand granular, basin-level intelligence on corporate water footprinting. The technology, including digital twin water systems and high-resolution remote sensing, provides this precision, helping to quantify asset-level failure probability and manage risks like aquifer depletion and contamination plumes.
Drivers, Trends, and Challenges in the Water Risk Intelligence Software Market
The strategic integration of water risk analytics into core business functions is becoming standard practice. For financial officers, the focus is now on quantifying financial impacts of water scarcity and integrating water stress into financial balance sheets, a process streamlined by new data-sharing partnerships that automate reporting in line with frameworks like the Taskforce on Nature-related Financial Disclosures.
Operationally, assessing water risk in enterprise resource planning systems allows companies to identify hidden vulnerabilities in global supply chains before they escalate. In the public sector, real-time flood risk analytics for urban planning are critical.
For example, a Dutch water authority can use a digital twin to simulate storm surges, improving response times significantly compared to older models that took days to run. Similarly, AI-driven predictive maintenance for water networks is enabling municipal utilities to address potential pipe failures before they occur, reducing non-revenue water losses.
In agriculture, satellite-based water quality monitoring for agriculture provides farmers with precise data on nutrient runoff and soil health, optimizing fertilizer use and protecting local ecosystems.
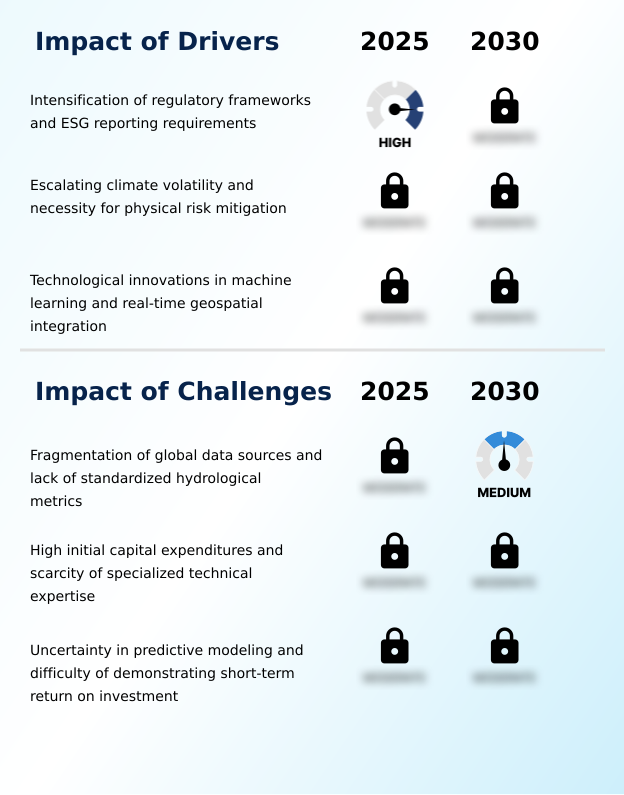
Primary Growth Driver: The intensification of global regulatory frameworks and environmental, social, and governance (ESG) reporting requirements is a primary driver for the adoption of water risk intelligence software.
Intensifying regulatory frameworks and environmental, social, and governance (ESG) reporting requirements are major market drivers, compelling corporations to provide verifiable data on their hydrological footprints.
With North America expected to contribute around 37% of market growth, compliance with mandates like the EU's Corporate Sustainability Reporting Directive necessitates automated solutions for tracking regulatory compliance risk. Escalating climate volatility also forces a move toward predictive intelligence.
For example, emergency frameworks in drought-prone regions now require industrial users to implement systems for real-time consumption tracking.
This demand for detailed water stress mapping and consumption data is pushing organizations to invest in sophisticated analytical software to ensure operational resilience and maintain their license to operate.
Emerging Market Trend: The proliferation of generative AI and hyper-local predictive modeling is driving a transition from descriptive analytics to interactive predictive environments in water risk intelligence.
A primary market trend is the shift toward proactive risk management, enabled by hyper-local predictive modeling and generative AI climate simulation. These technologies move beyond regional forecasts to provide site-specific insights, which are crucial for industries like semiconductor manufacturing. A key development is the use of natural language interfaces, democratizing access to complex hydrological data for non-technical decision-makers.
This allows executives to query systems for water availability scenarios conversationally. Another emerging area is the development of new financial instruments, such as parametric water-scarcity insurance products, which rely on high-fidelity, real-time data to automate claims for sectors like agriculture, demonstrating the expanding application of these platforms.
Key Industry Challenge: The fragmentation of global data sources and a lack of standardized hydrological metrics present a primary challenge to the scalability and reliability of water risk intelligence platforms.
A significant challenge hindering market growth is the fragmentation of global data sources and the lack of standardized hydrological metrics, which complicates the development of universally reliable software. This data inconsistency limits the effectiveness of uncertainty in predictive modeling, particularly across international borders.
Another major barrier is the high initial capital expenditure required for implementation, including hardware upgrades and the integration of IoT connectivity. These costs, coupled with a scarcity of specialized technical expertise, often place advanced solutions out of reach for small and medium-sized enterprises.
For municipal utilities, the business case can be difficult to prove, as demonstrating a short-term ROI for investments aimed at long-term goals like non-revenue water loss reduction remains a persistent challenge.
Explore Full Market Dynamics Analysis Request Free Sample
Water Risk Intelligence Software Market Segmentation
The water risk intelligence software industry research report provides comprehensive data including region-wise segment analysis, with forecasts and analysis for the period 2026-2030, as well as historical data from 2020-2024 for the following segments.
Type Segment Analysis
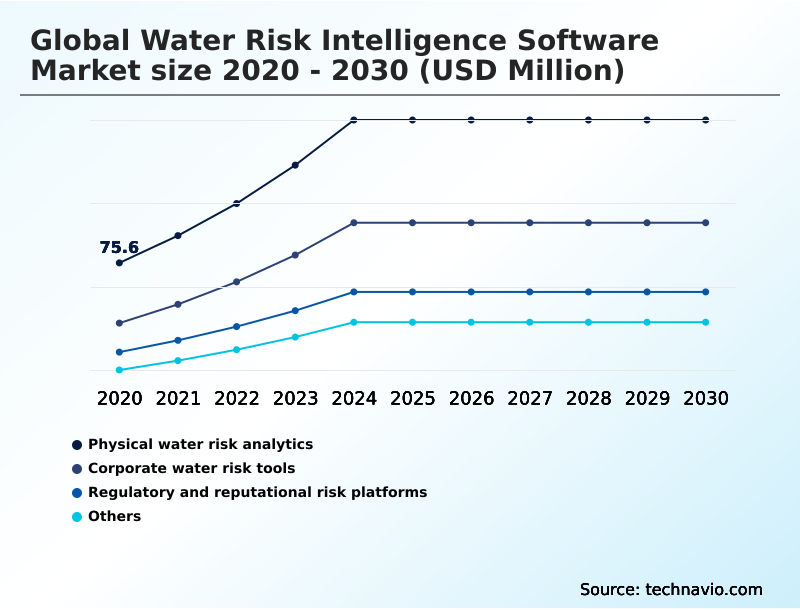
The physical water risk analytics segment is estimated to witness significant growth during the forecast period.
Physical water risk analytics, accounting for over 40% of the market, forms the foundational layer for quantifying hydrological hazards.
These platforms utilize advanced hydrological modeling, integrating vast streams of geospatial data and high-resolution remote sensing feeds to assess flood potential and water scarcity.
The core function is to transition from historical analysis to predictive climate modeling, enabling asset-heavy industries like manufacturing and energy to evaluate asset-level failure probability with greater precision.
For procurement decision-makers, the value lies in moving beyond national-level data to secure basin-level intelligence.
This granularity is critical for site selection and designing resilience strategies, allowing for more targeted risk mitigation efforts based on the unique characteristics of specific river basins and groundwater reservoirs.
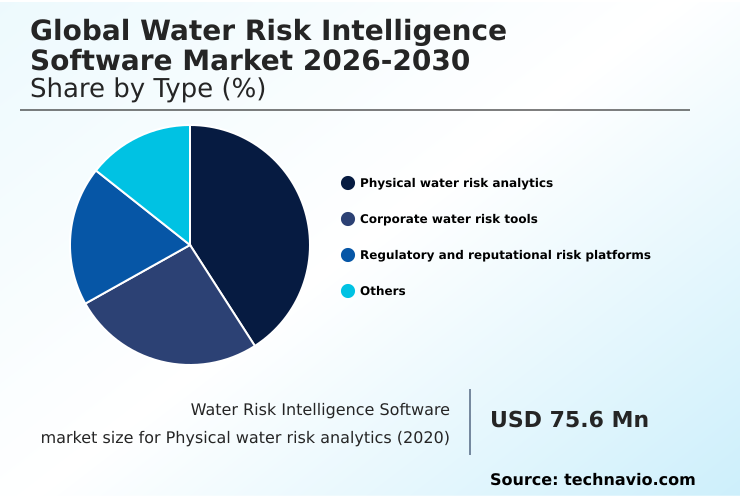
The Physical water risk analytics segment was valued at USD 141.1 million in 2024 and showed a gradual increase during the forecast period.
Water Risk Intelligence Software Market by Region: North America Leads with 37% Growth Share
North America is estimated to contribute 37% to the growth of the global market during the forecast period.
North America and Europe are mature markets, driven by stringent regulations and the need to modernize aging infrastructure, together accounting for over 60% of growth opportunities.
In the US, for instance, escalating climate volatility in regions like the Colorado River Basin drives demand for real-time consumption tracking and basin-level intelligence.
In contrast, APAC is a region of rapid growth, fueled by industrialization and the critical need for sustainable resource management.
Countries like China and India are investing heavily in water stress mapping and aquifer depletion modeling to address severe scarcity and pollution issues.
These regional differences require software providers to offer highly localized solutions, from optimizing water reclamation process optimization in arid manufacturing zones to managing large-scale agricultural water use.
Customer Landscape Analysis for the Water Risk Intelligence Software Market
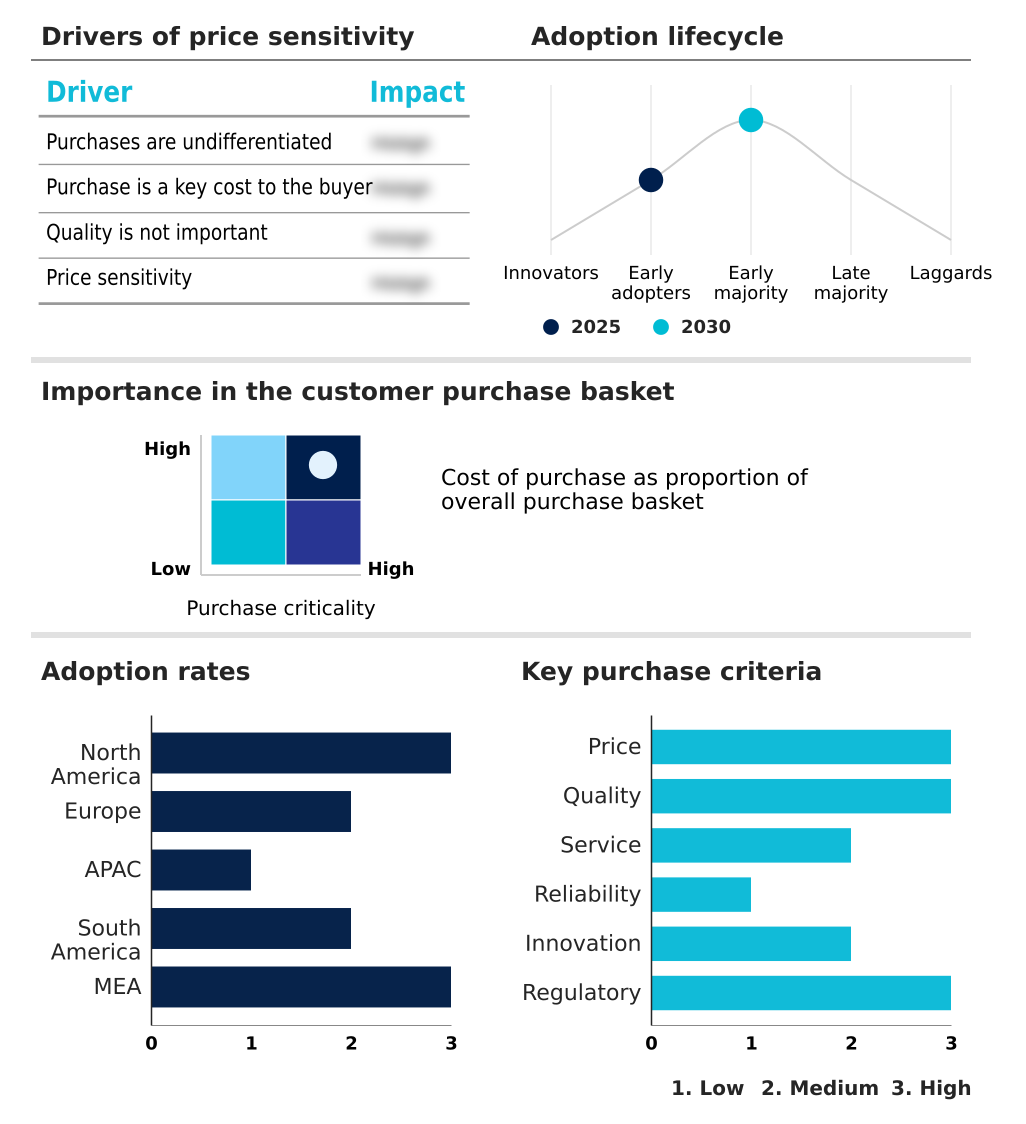
The water risk intelligence software market forecasting report includes the adoption lifecycle of the market, covering from the innovator’s stage to the laggard’s stage. It focuses on adoption rates in different regions based on penetration. Furthermore, the water risk intelligence software market report also includes key purchase criteria and drivers of price sensitivity to help companies evaluate and develop their market growth analysis strategies.
Competitive Landscape of the Water Risk Intelligence Software Market
Companies are implementing various strategies, such as strategic alliances, partnerships, mergers and acquisitions, geographical expansion, and product/service launches, to enhance their presence in the water risk intelligence software market industry.
Arcadis N.V. - Provides AI-driven predictive analytics for water network asset management, climate risk assessment, and resilience planning for utility infrastructure.
The industry research and growth report includes detailed analyses of the competitive landscape of the market and information about key companies, including:
- Arcadis N.V.
- Bentley Systems Inc.
- DNV Group AS
- Ecolab Inc.
- Fugro NV
- IBM Corp.
- Jacobs Solutions Inc.
- Jupiter Intelligence. Inc
- KETOS INC.
- Microsoft Corp.
- Moodys Corp.
- MSCI Inc.
- S and P Global Inc.
- SAP SE
- Schneider Electric SE
- Stantec Inc.
- SUEZ SA
- Veolia Environment SA
- Verisk Analytics Inc.
- Xylem Inc.
Qualitative and quantitative analysis of companies has been conducted to help clients understand the wider business environment as well as the strengths and weaknesses of key industry players. Data is qualitatively analyzed to categorize companies as pure play, category-focused, industry-focused, and diversified; it is quantitatively analyzed to categorize companies as dominant, leading, strong, tentative, and weak.
Recent Developments in the Water Risk Intelligence Software Market
- In April, 2025, Schneider Electric expanded its digital portfolio by incorporating a generative AI module within its resource advisor software, enabling stakeholders to generate predictive water availability scenarios through conversational commands.
- In September, 2025, SAP SE finalized a data-sharing partnership with the risk intelligence firm Waterplan to automate the inclusion of hydrological stress metrics and financial impact assessments directly into corporate financial balance sheets.
- In October, 2025, Xylem announced the deployment of a new generative AI module in its infrastructure analytics suite, allowing users to generate thousands of hypothetical climate scenarios for urban water networks in minutes.
- In June, 2025, Planet Labs PBC launched its first high-resolution hyperspectral satellites, providing water risk intelligence platforms with the capability to track chemical pollutants and moisture changes at a granular level.
Research Analyst Overview: Water Risk Intelligence Software Market
The market's momentum is shifting from generalized environmental social governance reporting to financially quantified risk management, a boardroom-level concern. While physical water risk analytics remains the largest market segment, accounting for over 40% of demand, the key development is how this data is being used.
Decision-makers are now leveraging detailed hydrological modeling and high-resolution remote sensing not just for operational resilience but for strategic financial planning. Compliance with mandates like the European Financial Reporting Advisory Group's standards, which require basin-level intelligence, is forcing companies to invest in platforms capable of sophisticated water scarcity assessment and flood potential analysis.
This involves machine learning algorithms that can determine asset-level failure probability and inform capital allocation. The ability to perform supply chain water auditing and quantify regulatory compliance risk in real-time is no longer a niche capability but a core component of modern corporate strategy and a critical vendor qualification criterion.
Dive into Technavio’s robust research methodology, blending expert interviews, extensive data synthesis, and validated models for unparalleled Water Risk Intelligence Software Market insights. See full methodology.
| Market Scope | |
|---|---|
| Page number | 318 |
| Base year | 2025 |
| Historic period | 2020-2024 |
| Forecast period | 2026-2030 |
| Growth momentum & CAGR | Accelerate at a CAGR of 18% |
| Market growth 2026-2030 | USD 521.8 million |
| Market structure | Fragmented |
| YoY growth 2025-2026(%) | 17.6% |
| Key countries | US, Canada, Mexico, Germany, UK, France, Italy, Spain, The Netherlands, China, India, Japan, South Korea, Australia, Indonesia, Brazil, Argentina, Colombia, Saudi Arabia, UAE, South Africa, Israel and Turkey |
| Competitive landscape | Leading Companies, Market Positioning of Companies, Competitive Strategies, and Industry Risks |
Water Risk Intelligence Software Market: Key Questions Answered in This Report
-
What is the expected growth of the Water Risk Intelligence Software Market between 2026 and 2030?
-
The Water Risk Intelligence Software Market is expected to grow by USD 521.8 million during 2026-2030, registering a CAGR of 18%. Year-over-year growth in 2026 is estimated at 17.6%%. This acceleration is shaped by intensification of regulatory frameworks and esg reporting requirements, which is intensifying demand across multiple end-use verticals covered in the report.
-
-
What segmentation does the market report cover?
-
The report is segmented by Type (Physical water risk analytics, Corporate water risk tools, Regulatory and reputational risk platforms, and Others), Deployment (Cloud based, and On premises), End-user (Financial institutions, Industrial users, Government, and Others) and Geography (North America, Europe, APAC, South America, Middle East and Africa). Among these, the Physical water risk analytics segment is estimated to witness significant growth during the forecast period, driven by rising adoption across key application areas. Each segment includes detailed qualitative and quantitative analysis, along with historical data from 2020-2024 and forecasts through 2030 with year-over-year growth rates.
-
-
Which regions are analyzed in the report?
-
The report covers North America, Europe, APAC, South America and Middle East and Africa. North America is estimated to contribute 37% to market growth during the forecast period. Country-level analysis includes US, Canada, Mexico, Germany, UK, France, Italy, Spain, The Netherlands, China, India, Japan, South Korea, Australia, Indonesia, Brazil, Argentina, Colombia, Saudi Arabia, UAE, South Africa, Israel and Turkey, with dedicated market size tables and year-over-year growth for each.
-
-
What are the key growth drivers and market challenges?
-
The primary driver is intensification of regulatory frameworks and esg reporting requirements, which is accelerating investment and industry demand. The main challenge is fragmentation of global data sources and lack of standardized hydrological metrics, creating operational barriers for key market participants. The report quantifies the impact of each driver and challenge across 2026 and 2030 with comparative analysis.
-
-
Who are the major players in the Water Risk Intelligence Software Market?
-
Key vendors include Arcadis N.V., Bentley Systems Inc., DNV Group AS, Ecolab Inc., Fugro NV, IBM Corp., Jacobs Solutions Inc., Jupiter Intelligence. Inc, KETOS INC., Microsoft Corp., Moodys Corp., MSCI Inc., S and P Global Inc., SAP SE, Schneider Electric SE, Stantec Inc., SUEZ SA, Veolia Environment SA, Verisk Analytics Inc. and Xylem Inc.. The report provides qualitative and quantitative analysis categorizing companies as dominant, leading, strong, tentative, and weak based on their market positioning. Company profiles include business segment analysis, SWOT assessment, key offerings, and recent strategic developments.
-
Water Risk Intelligence Software Market Research Insights
The market's dynamics are increasingly shaped by the demand for highly granular, predictive insights. The cloud-based deployment model is significantly larger than on-premise, reflecting the need for scalable platforms that can perform complex tasks like aquifer depletion modeling and real-time contamination plume prediction.
As mandated by frameworks like the EU's Corporate Sustainability Reporting Directive, organizations require tools for detailed groundwater depletion analysis and surface water level monitoring to report on their environmental impact accurately. This shift is not merely for compliance; it is a strategic response to operational risks.
Advanced software now offers capabilities such as soil moisture tracking for agriculture and generative AI climate simulation, enabling more resilient planning and resource management across industries.
We can help! Our analysts can customize this water risk intelligence software market research report to meet your requirements.
 RIA -
RIA - 
