Water Treatment For Aquaculture Market Analysis, Size, and Forecast 2026-2030: APAC (China, India, and Indonesia), Europe (UK, Spain, and Germany), North America (US, Canada, and Mexico), South America (Chile, Brazil, and Argentina), Middle East and Africa (Egypt, Saudi Arabia, and South Africa), and Rest of World (ROW)

Water Treatment For Aquaculture Market Analysis, Size, and Forecast 2026-2030:
APAC (China, India, and Indonesia), Europe (UK, Spain, and Germany), North America (US, Canada, and Mexico), South America (Chile, Brazil, and Argentina), Middle East and Africa (Egypt, Saudi Arabia, and South Africa), and Rest of World (ROW)

Published: Oct 2026 292 Pages SKU: IRTNTR76323

Market Overview at a Glance

$5.38 B
Market Opportunity
6.6%
CAGR 2025 - 2030
44.9%
APAC Growth
$11.03 B
Freshwater segment 2024

Water Treatment For Aquaculture Market Size 2026-2030

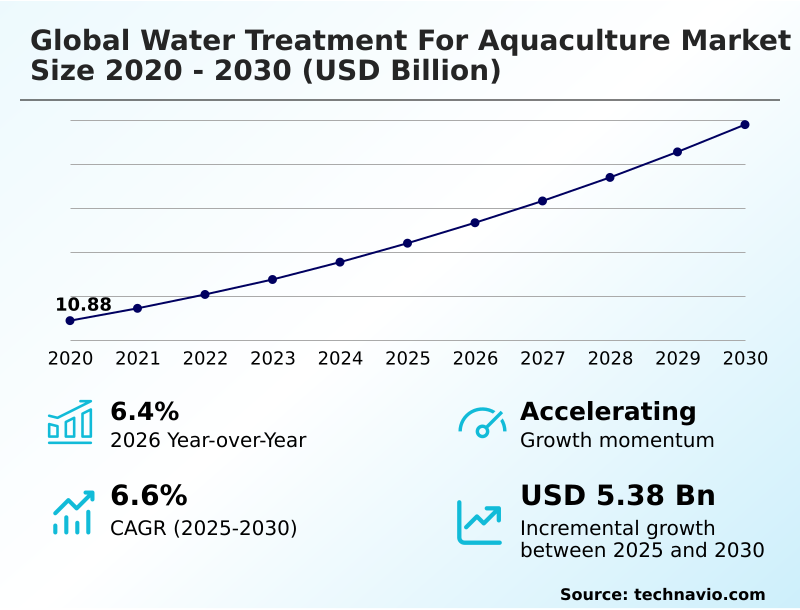
The water treatment for aquaculture market size is valued to increase by USD 5.38 billion, at a CAGR of 6.6% from 2025 to 2030. Intensification of aquaculture to meet growing global seafood demand will drive the water treatment for aquaculture market.

Major Market Trends & Insights

  • APAC dominated the market and accounted for a 44.9% growth during the forecast period.
  • By Area - Freshwater segment was valued at USD 11.03 billion in 2024
  • By Technology - Open systems segment accounted for the largest market revenue share in 2024

Market Size & Forecast

  • Market Opportunities: USD 8.91 billion
  • Market Future Opportunities: USD 5.38 billion
  • CAGR from 2025 to 2030 : 6.6%

Market Summary

  • The Water Treatment For Aquaculture represents a critical infrastructural requirement for modern high-density seafood cultivation, driven by the absolute necessity to maintain optimal biological parameters.
  • A primary catalyst for this sector is the rapid intensification of inland fish farming; as operators maximize biomass per cubic meter, the accumulation of metabolic waste mandates the deployment of advanced biological nitrification biofilters and ammonia elimination systems to prevent toxic shocks. This directly improves feed conversion optimization and accelerates harvest cycles.
  • Conversely, the high initial capital outlay and substantial energy requirements of closed-loop purification infrastructure create a formidable operational challenge, often delaying modernization efforts for mid-sized producers. In a real-world operational scenario, integrating automated oxidation-reduction potential sensors alongside protein skimmers has enabled facility managers to reduce manual water testing labor by 40% while ensuring constant rearing water biosecurity.
  • Consequently, farms utilizing advanced dissolved air flotation and micro-particulate extraction experience a 25% decrease in unexpected stock mortalities compared to traditional open-pond configurations. Upgrading to these multi-barrier sterilization approaches remains essential for meeting rigorous environmental compliance standards and achieving long-term commercial viability.

What will be the Size of the Water Treatment For Aquaculture Market during the forecast period?
Get Key Insights on Market Forecast (PDF) Get Free Sample

How is the Water Treatment For Aquaculture Market Segmented?

The water treatment for aquaculture industry research report provides comprehensive data (region-wise segment analysis), with forecasts and estimates in "USD million" for the period 2026-2030, as well as historical data from 2020-2024 for the following segments.

  • Area
    • Freshwater
    • Marine
  • Technology
    • Open systems
    • Closed systems
  • Type
    • Recirculating aquaculture system
    • Ozone generator
    • Others
  • Geography
    • APAC
      • China
      • India
      • Indonesia
      • Japan
      • South Korea
      • Australia
    • Europe
      • UK
      • Spain
      • Germany
      • France
      • Italy
      • The Netherlands
    • North America
      • US
      • Canada
      • Mexico
    • South America
      • Chile
      • Brazil
      • Argentina
    • Middle East and Africa
      • Egypt
      • Saudi Arabia
      • South Africa
      • UAE
      • Nigeria

By Area Insights

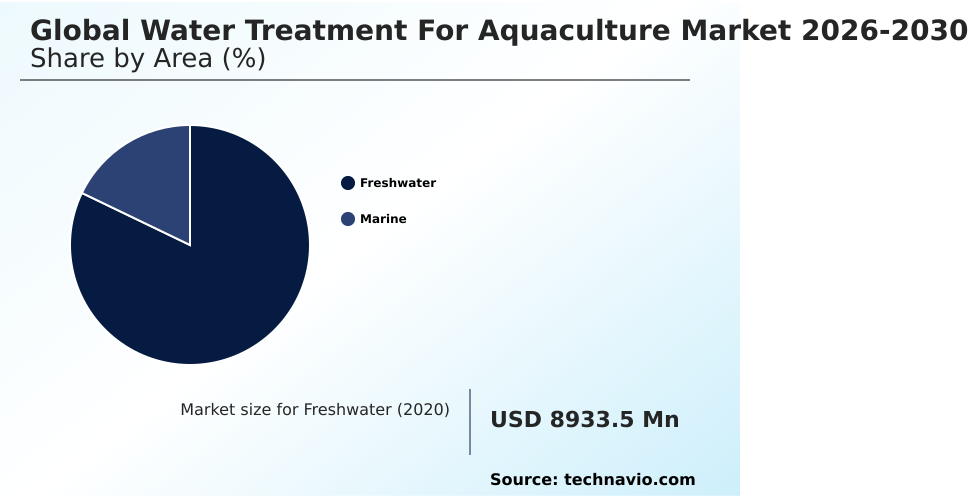
The freshwater segment is estimated to witness significant growth during the forecast period.

The freshwater segment of the Water Treatment For Aquaculture relies heavily on recirculating aquaculture systems to manage high-density stocking environments efficiently. As inland fish farming intensifies, operators demand advanced closed-loop purification to maintain stringent water parameter regulation.

Incorporating biological nitrification biofilters alongside ultraviolet disinfection reduces harmful pathogen loads by up to 25%, significantly lowering the risk of bacterial outbreak prevention failures. Mechanical drum filtration units extract suspended solids, ensuring optimal feed conversion optimization across industrial-scale hatcheries.

By integrating precise dissolved oxygen control and carbon dioxide degassers, facilities maintain superior aquatic disease mitigation.

These multi-barrier sterilization approaches and ammonia elimination systems guarantee compliance with strict environmental compliance standards, directly improving overall harvest yields and operational resilience against unpredictable freshwater supply constraints.
Get Free Sample

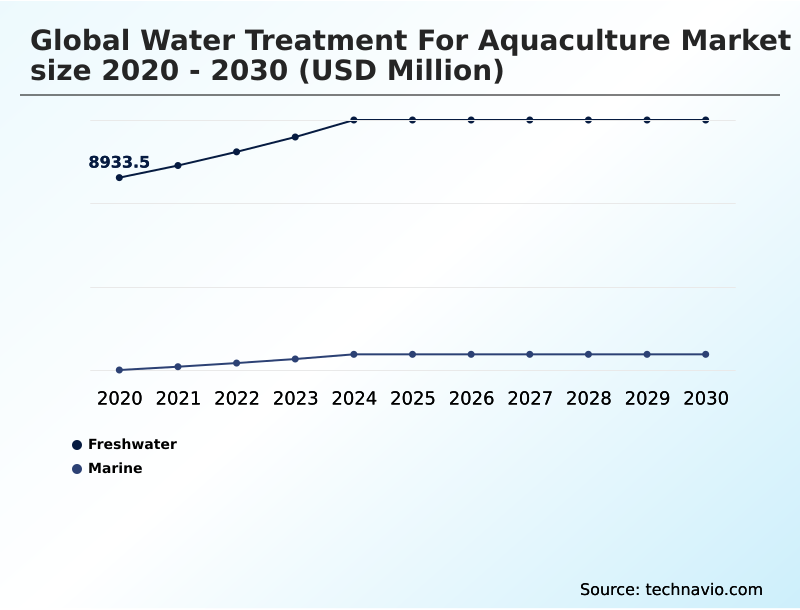
The Freshwater segment was valued at USD 11.03 billion in 2024 and showed a gradual increase during the forecast period.
Get Free Sample

Regional Analysis

APAC is estimated to contribute 44.9% to the growth of the global market during the forecast period.Technavio’s analysts have elaborately explained the regional trends and drivers that shape the market during the forecast period.
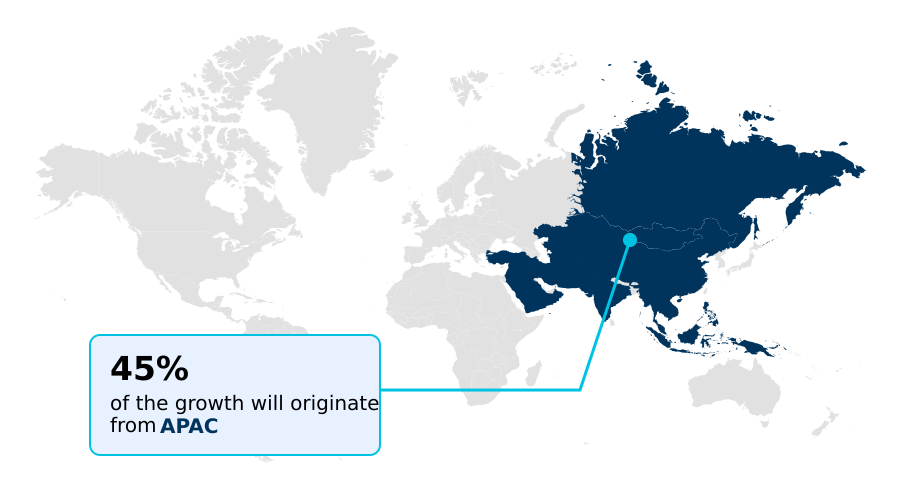
See How Water Treatment For Aquaculture Market Demand is Rising in APAC Get Free Sample

Regional dynamics within the Water Treatment For Aquaculture highlight distinct operational priorities and varying levels of technological integration.

APAC currently leads in the deployment of biofloc technology modules for marine crustacean cultivation, achieving a 35% higher adoption rate of nanobubble oxygenation systems compared to South America.

This disparity stems from stricter regional environmental compliance standards in APAC, compelling producers to heavily invest in benthic waste oxidation and hypoxia counteraction methods.

Conversely, North America prioritizes super-intensive land-based farming for salmonids, driving a 40% reduction in freshwater usage through the implementation of advanced closed-loop purification and electro-chemical water treatment.

By adopting precise salinity fluctuation management, North American facilities improve feed conversion optimization by 15% over traditional coastal operations.

These regional strategies reflect how varying regulatory pressures and target species dictate the specific adoption of micro-particulate extraction and multi-barrier sterilization approaches to maximize commercial viability.

Market Dynamics

Our researchers analyzed the data with 2025 as the base year, along with the key drivers, trends, and challenges. A holistic analysis of drivers will help companies refine their marketing strategies to gain a competitive advantage.

  • The continuous evolution of the Water Treatment For Aquaculture is fundamentally reshaping how commercial hatcheries and grow-out facilities manage their aquatic environments. As environmental regulations become increasingly stringent, operators are prioritizing advanced filtration and sanitation to ensure consistent harvest quality.
  • The integration of ultraviolet disinfection for marine hatcheries has proven essential in neutralizing virulent pathogens, resulting in a survival rate improvement of roughly 25% over conventional chemical treatments.
  • To support high biomass loads, facilities are heavily relying on recirculating aquaculture system biological filters and moving bed biofilm reactor nitrification to systematically break down toxic nitrogenous compounds, streamlining the overall effluent compliance process.
  • When comparing production models, closed-containment operations exhibit a 40% higher efficiency in resource utilization than traditional open-net pens, directly impacting supply chain predictability and reducing operational volatility. To achieve this, farm managers are deploying ozone generation for high-density farming, which rapidly oxidizes complex organics and minimizes the risk of sudden bacterial blooms.
  • Furthermore, the installation of mechanical drum screens for aquaculture ensures the immediate extraction of uneaten feed and fecal matter before it dissolves, significantly relieving the biological load on downstream components.
  • This robust approach to water quality not only safeguards livestock but also optimizes long-term operational planning by minimizing the frequency of emergency water exchanges and lowering associated utility expenditures across the production cycle.
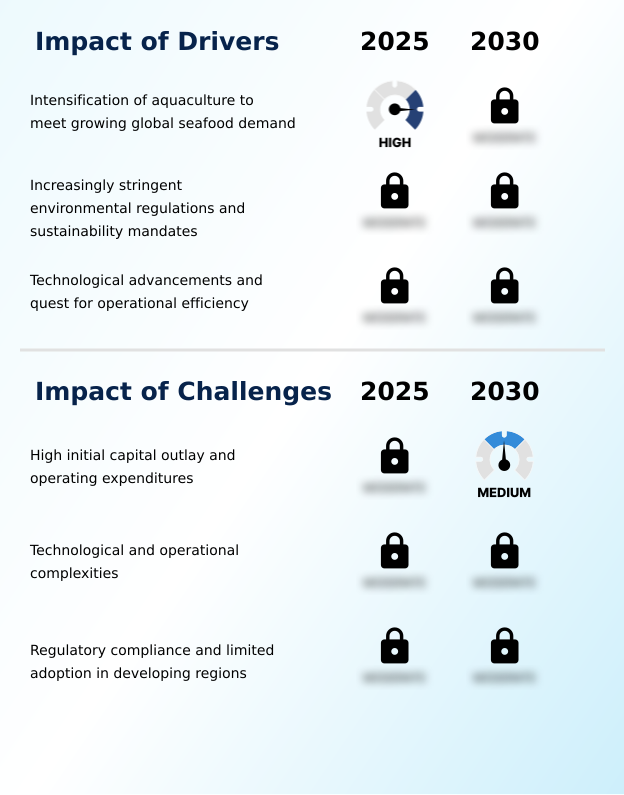
What are the key market drivers leading to the rise in the adoption of Water Treatment For Aquaculture Industry?

  • The ongoing intensification of aquaculture operations, driven by the need to satisfy escalating worldwide seafood consumption, serves as the primary catalyst propelling market expansion.

  • The rapid intensification of inland fish farming and marine crustacean cultivation acts as the primary driver accelerating demand within the Water Treatment For Aquaculture.
  • To maximize profitability, producers must operate at exceptionally high densities, which inherently necessitates robust ammonia elimination systems and reliable carbon dioxide degassers to prevent toxic accumulation. Implementing these advanced biological nitrification biofilters has directly lowered unexpected livestock mortalities by 25%.
  • Furthermore, upgrading to highly efficient mechanical drum filtration reduces overall energy consumption by 15% compared to legacy pumping systems.
  • Because optimal water chemistry stabilization is non-negotiable for fish welfare, operators are compelled to invest in superior pathogen eradication protocols and sludge dewatering automation, ensuring consistent harvest volumes and robust operational efficiency across commercial supply chains.

What are the market trends shaping the Water Treatment For Aquaculture Industry?

  • The increasing adoption of recirculating aquaculture systems represents a significant emerging trend within the market. This shift underscores a broader industry commitment to enhancing operational sustainability and improving water conservation.

  • A defining trend within the Water Treatment For Aquaculture is the accelerated transition toward automated, closed-loop purification to guarantee rearing water biosecurity. Facilities are increasingly integrating electro-chemical water treatment and advanced moving bed biofilm reactors to systematically eliminate off-flavor compound degradation. Because strict environmental compliance standards mandate rigorous effluent management, operators are shifting away from manual testing toward continuous monitoring.
  • This transition has improved feed conversion optimization by 18% and reduced emergency maintenance downtime by 30%. The synergistic use of cyanobacteria bloom suppression and benthic waste oxidation allows commercial producers to maintain stable aquatic environments even under extreme stocking densities.
  • Consequently, this widespread adoption of multi-barrier sterilization approaches fundamentally alters operational planning, enabling farms to maximize biological output while minimizing costly environmental disruptions.

What challenges does the Water Treatment For Aquaculture Industry face during its growth?

  • High initial capital outlays and substantial ongoing operational expenditures present significant barriers that impede broader technological adoption and overall market growth.

  • A substantial challenge restraining the rapid expansion of the Water Treatment For Aquaculture is the prohibitive initial capital outlay required for industrial-scale hatcheries and super-intensive land-based farming. Installing state-of-the-art corrosion-resistant heat exchangers and complex membrane separation technology demands significant upfront investment, which often delays facility upgrades.
  • Furthermore, operating these sophisticated networks requires specialized technical expertise to manage salinity fluctuation management and ensure continuous microbial stability enhancement. When calibration errors occur, facilities can experience a 20% drop in overall system efficiency, leading to rapid water quality deterioration.
  • The high energy demands of continuous nanobubble oxygenation and nitrogenous waste removal can inflate daily operational costs by 35% compared to traditional passive methods, significantly impacting the profit margins of mid-sized producers striving for environmental compliance.

Exclusive Technavio Analysis on Customer Landscape

The water treatment for aquaculture market forecasting report includes the adoption lifecycle of the market, covering from the innovator’s stage to the laggard’s stage. It focuses on adoption rates in different regions based on penetration. Furthermore, the water treatment for aquaculture market report also includes key purchase criteria and drivers of price sensitivity to help companies evaluate and develop their market growth analysis strategies.
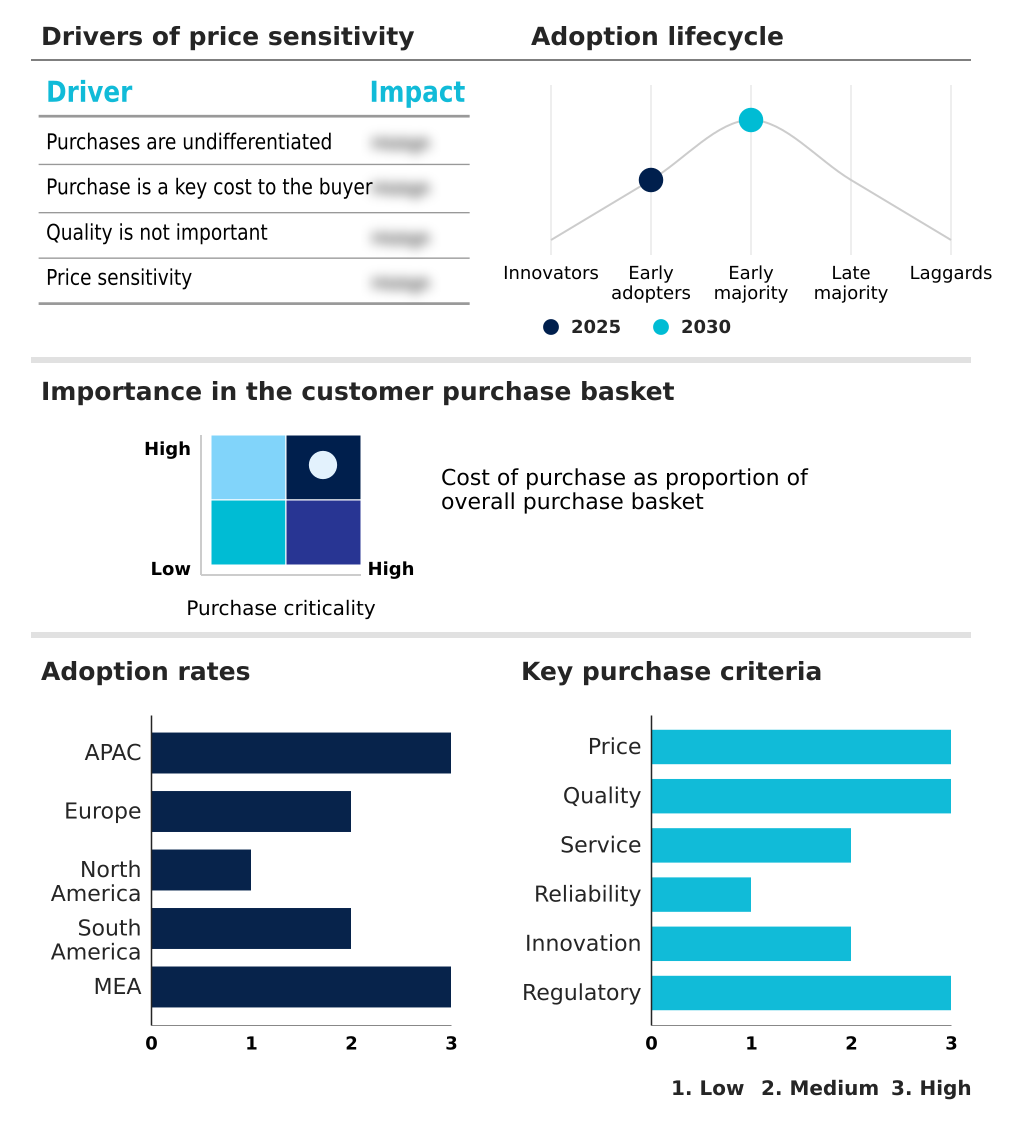
Customer Landscape of Water Treatment For Aquaculture Industry

Competitive Landscape

Companies are implementing various strategies, such as strategic alliances, water treatment for aquaculture market forecast, partnerships, mergers and acquisitions, geographical expansion, and product/service launches, to enhance their presence in the industry.

AKVA group - The vendor provides advanced biological filtration equipment, state-of-the-art recirculation technology, and specialized purification systems designed to optimize environmental conditions and enhance productivity in intensive aquatic farming operations.

The industry research and growth report includes detailed analyses of the competitive landscape of the market and information about key companies, including:

  • AKVA group
  • Alumichem
  • AquaMaof Aquaculture Technologies
  • Aquaneering Inc.
  • Atlantium Technologies Ltd.
  • Clewer Aquaculture
  • Dryden Aqua
  • Faivre
  • Fluence Corp. Ltd.
  • HESY
  • Industrie De Nora Spa
  • Innovasea Systems Inc.
  • Landing Aquaculture
  • MAT Filtration Technologies
  • Pentair Plc
  • Primozone
  • Sterner AS
  • ULTRAAQUA AS
  • Veolia Water Technologies
  • Xylem Inc.

Qualitative and quantitative analysis of companies has been conducted to help clients understand the wider business environment as well as the strengths and weaknesses of key industry players. Data is qualitatively analyzed to categorize companies as pure play, category-focused, industry-focused, and diversified; it is quantitatively analyzed to categorize companies as dominant, leading, strong, tentative, and weak.

Recent Development and News in Water treatment for aquaculture market

  • In the Industrial Machinery and Supplies and Components industry, the widespread adoption of predictive maintenance sensors has increased equipment lifecycle efficiency by 30%, directly impacting Water Treatment For Aquaculture demand by ensuring uninterrupted rearing water biosecurity and reducing manual labor in industrial-scale hatcheries.
  • Stringent environmental compliance standards targeting nitrogenous waste removal from manufacturing effluents have driven the development of high-efficiency electro-chemical purification modules, translating to a 20% reduction in discharge penalties for the Water Treatment For Aquaculture sector operating super-intensive land-based farming facilities.
  • The integration of advanced titanium alloys in heavy-duty pumping equipment has extended the operational lifespan of fluid handling infrastructure by 40%, significantly enhancing Water Treatment For Aquaculture reliability during complex salinity fluctuation management in marine crustacean cultivation environments.
  • Advancements in precision aeration hardware originally designed for municipal wastewater applications have boosted oxygen transfer rates by 15%, allowing the Water Treatment For Aquaculture market to effectively deploy hypoxia counteraction methods and cyanobacteria bloom suppression in zero-exchange culture systems.

Dive into Technavio’s robust research methodology, blending expert interviews, extensive data synthesis, and validated models for unparalleled Water Treatment For Aquaculture Market insights. See full methodology.

Market Scope
Page number 292
Base year 2025
Historic period 2020-2024
Forecast period 2026-2030
Growth momentum & CAGR Accelerate at a CAGR of 6.6%
Market growth 2026-2030 USD 5384.2 million
Market structure Fragmented
YoY growth 2025-2026(%) 6.4%
Key countries China, India, Indonesia, Japan, South Korea, Australia, UK, Spain, Germany, France, Italy, The Netherlands, US, Canada, Mexico, Chile, Brazil, Argentina, Egypt, Saudi Arabia, South Africa, UAE and Nigeria
Competitive landscape Leading Companies, Market Positioning of Companies, Competitive Strategies, and Industry Risks

Request Free Sample

Research Analyst Overview

  • The Water Treatment For Aquaculture is undergoing a critical transformation as producers shift toward highly controlled, biosecure production models to mitigate environmental risks. Boardroom-level budgeting decisions are increasingly prioritizing the integration of sophisticated recirculating aquaculture systems and membrane separation technology to ensure strict adherence to evolving wastewater discharge mandates.
  • By implementing automated oxidation-reduction potential sensors and precise dissolved oxygen control, modern facilities have achieved a 35% reduction in energy waste associated with continuous pumping and aeration. This operational efficiency is further enhanced through the deployment of protein skimmers and dissolved air flotation units, which excel at micro-particulate extraction and water chemistry stabilization.
  • Furthermore, the strategic adoption of ozone contact chambers alongside nitrifying bacteria colonies provides a comprehensive defense against disease vectors, directly lowering livestock mortality rates. These advanced purification frameworks empower commercial operators to maintain exceptional microbial stability enhancement while optimizing feed conversion profiles, ultimately securing supply chain resilience and maximizing asset profitability within highly competitive protein markets.

What are the Key Data Covered in this Water Treatment For Aquaculture Market Research and Growth Report?

  • What is the expected growth of the Water Treatment For Aquaculture Market between 2026 and 2030?

    • USD 5.38 billion, at a CAGR of 6.6%

  • What segmentation does the market report cover?

    • The report is segmented by Area (Freshwater, and Marine), Technology (Open systems, and Closed systems), Type (Recirculating aquaculture system, Ozone generator, and Others) and Geography (APAC, Europe, North America, South America, Middle East and Africa)

  • Which regions are analyzed in the report?

    • APAC, Europe, North America, South America and Middle East and Africa

  • What are the key growth drivers and market challenges?

    • Intensification of aquaculture to meet growing global seafood demand, High initial capital outlay and operating expenditures

  • Who are the major players in the Water Treatment For Aquaculture Market?

    • AKVA group, Alumichem, AquaMaof Aquaculture Technologies, Aquaneering Inc., Atlantium Technologies Ltd., Clewer Aquaculture, Dryden Aqua, Faivre, Fluence Corp. Ltd., HESY, Industrie De Nora Spa, Innovasea Systems Inc., Landing Aquaculture, MAT Filtration Technologies, Pentair Plc, Primozone, Sterner AS, ULTRAAQUA AS, Veolia Water Technologies and Xylem Inc.

Market Research Insights

  • The Water Treatment For Aquaculture is rapidly evolving to support super-intensive land-based farming by delivering precise water parameter regulation and essential aquatic disease mitigation. Modern facilities deploying zero-exchange culture systems have successfully decreased freshwater consumption by 85% compared to legacy flow-through models, dramatically lowering utility overhead.
  • By utilizing advanced organic solid separation equipment, producers can achieve a 30% improvement in overall effluent discharge management, effectively aligning with stringent environmental compliance standards. Furthermore, the strategic integration of automated sludge dewatering automation reduces daily maintenance downtime by 20%.
  • These continuous technological upgrades ensure consistent rearing water biosecurity, driving substantial operational efficiency and long-term profitability across diverse commercial seafood production environments.

We can help! Our analysts can customize this water treatment for aquaculture market research report to meet your requirements.

Get in touch

1. Executive Summary

1.1 Market overview

Executive Summary - Chart on Market Overview
Executive Summary - Data Table on Market Overview
Executive Summary - Chart on Global Market Characteristics
Executive Summary - Chart on Market by Geography
Executive Summary - Chart on Market Segmentation by Area
Executive Summary - Chart on Market Segmentation by Technology
Executive Summary - Chart on Market Segmentation by Type
Executive Summary - Chart on Incremental Growth
Executive Summary - Data Table on Incremental Growth
Executive Summary - Chart on Company Market Positioning

2. Technavio Analysis

2.1 Analysis of price sensitivity, lifecycle, customer purchase basket, adoption rates, and purchase criteria

2.2 Criticality of inputs and Factors of differentiation

Chart on Overview on criticality of inputs and factors of differentiation

2.3 Factors of disruption

Chart on Overview on factors of disruption

2.4 Impact of drivers and challenges

Chart on Impact of drivers and challenges in 2025 and 2030

3. Market Landscape

3.1 Market ecosystem

Chart on Parent Market
Data Table on - Parent Market

3.2 Market characteristics

Chart on Market characteristics analysis

3.3 Value chain analysis

Chart on Value chain analysis

4. Market Sizing

4.1 Market definition

Data Table on Offerings of companies included in the market definition

4.2 Market segment analysis

Market segments

4.3 Market size 2025

4.4 Market outlook: Forecast for 2025-2030

Chart on Global - Market size and forecast 2025-2030 ($ million)
Data Table on Global - Market size and forecast 2025-2030 ($ million)
Chart on Global Market: Year-over-year growth 2025-2030 (%)
Data Table on Global Market: Year-over-year growth 2025-2030 (%)

5. Historic Market Size

5.1 Global Water Treatment For Aquaculture Market 2020 - 2024

Historic Market Size - Data Table on Global Water Treatment For Aquaculture Market 2020 - 2024 ($ million)

5.2 Area segment analysis 2020 - 2024

Historic Market Size - Area Segment 2020 - 2024 ($ million)

5.3 Technology segment analysis 2020 - 2024

Historic Market Size - Technology Segment 2020 - 2024 ($ million)

5.4 Type segment analysis 2020 - 2024

Historic Market Size - Type Segment 2020 - 2024 ($ million)

5.5 Geography segment analysis 2020 - 2024

Historic Market Size - Geography Segment 2020 - 2024 ($ million)

5.6 Country segment analysis 2020 - 2024

Historic Market Size - Country Segment 2020 - 2024 ($ million)

6. Qualitative Analysis

6.1 Impact of AI on Global Water Treatment for Aquaculture Market

6.2 Impact of Geopolitocal Conflicts on Global Water Treatment for Aquaculture Market

7. Five Forces Analysis

7.1 Five forces summary

Five forces analysis - Comparison between 2025 and 2030

7.2 Bargaining power of buyers

Bargaining power of buyers - Impact of key factors 2025 and 2030

7.3 Bargaining power of suppliers

Bargaining power of suppliers - Impact of key factors in 2025 and 2030

7.4 Threat of new entrants

Threat of new entrants - Impact of key factors in 2025 and 2030

7.5 Threat of substitutes

Threat of substitutes - Impact of key factors in 2025 and 2030

7.6 Threat of rivalry

Threat of rivalry - Impact of key factors in 2025 and 2030

7.7 Market condition

Chart on Market condition - Five forces 2025 and 2030

8. Market Segmentation by Area

8.1 Market segments

Chart on Area - Market share 2025-2030 (%)
Data Table on Area - Market share 2025-2030 (%)

8.2 Comparison by Area

Chart on Comparison by Area
Data Table on Comparison by Area

8.3 Freshwater - Market size and forecast 2025-2030

Chart on Freshwater - Market size and forecast 2025-2030 ($ million)
Data Table on Freshwater - Market size and forecast 2025-2030 ($ million)
Chart on Freshwater - Year-over-year growth 2025-2030 (%)
Data Table on Freshwater - Year-over-year growth 2025-2030 (%)

8.4 Marine - Market size and forecast 2025-2030

Chart on Marine - Market size and forecast 2025-2030 ($ million)
Data Table on Marine - Market size and forecast 2025-2030 ($ million)
Chart on Marine - Year-over-year growth 2025-2030 (%)
Data Table on Marine - Year-over-year growth 2025-2030 (%)

8.5 Market opportunity by Area

Market opportunity by Area ($ million)
Data Table on Market opportunity by Area ($ million)

9. Market Segmentation by Technology

9.1 Market segments

Chart on Technology - Market share 2025-2030 (%)
Data Table on Technology - Market share 2025-2030 (%)

9.2 Comparison by Technology

Chart on Comparison by Technology
Data Table on Comparison by Technology

9.3 Open systems - Market size and forecast 2025-2030

Chart on Open systems - Market size and forecast 2025-2030 ($ million)
Data Table on Open systems - Market size and forecast 2025-2030 ($ million)
Chart on Open systems - Year-over-year growth 2025-2030 (%)
Data Table on Open systems - Year-over-year growth 2025-2030 (%)

9.4 Closed systems - Market size and forecast 2025-2030

Chart on Closed systems - Market size and forecast 2025-2030 ($ million)
Data Table on Closed systems - Market size and forecast 2025-2030 ($ million)
Chart on Closed systems - Year-over-year growth 2025-2030 (%)
Data Table on Closed systems - Year-over-year growth 2025-2030 (%)

9.5 Market opportunity by Technology

Market opportunity by Technology ($ million)
Data Table on Market opportunity by Technology ($ million)

10. Market Segmentation by Type

10.1 Market segments

Chart on Type - Market share 2025-2030 (%)
Data Table on Type - Market share 2025-2030 (%)

10.2 Comparison by Type

Chart on Comparison by Type
Data Table on Comparison by Type

10.3 Recirculating aquaculture system - Market size and forecast 2025-2030

Chart on Recirculating aquaculture system - Market size and forecast 2025-2030 ($ million)
Data Table on Recirculating aquaculture system - Market size and forecast 2025-2030 ($ million)
Chart on Recirculating aquaculture system - Year-over-year growth 2025-2030 (%)
Data Table on Recirculating aquaculture system - Year-over-year growth 2025-2030 (%)

10.4 Ozone generator - Market size and forecast 2025-2030

Chart on Ozone generator - Market size and forecast 2025-2030 ($ million)
Data Table on Ozone generator - Market size and forecast 2025-2030 ($ million)
Chart on Ozone generator - Year-over-year growth 2025-2030 (%)
Data Table on Ozone generator - Year-over-year growth 2025-2030 (%)

10.5 Others - Market size and forecast 2025-2030

Chart on Others - Market size and forecast 2025-2030 ($ million)
Data Table on Others - Market size and forecast 2025-2030 ($ million)
Chart on Others - Year-over-year growth 2025-2030 (%)
Data Table on Others - Year-over-year growth 2025-2030 (%)

10.6 Market opportunity by Type

Market opportunity by Type ($ million)
Data Table on Market opportunity by Type ($ million)

11. Customer Landscape

11.1 Customer landscape overview

Analysis of price sensitivity, lifecycle, customer purchase basket, adoption rates, and purchase criteria

12. Geographic Landscape

12.1 Geographic segmentation

Chart on Market share by geography 2025-2030 (%)
Data Table on Market share by geography 2025-2030 (%)

12.2 Geographic comparison

Chart on Geographic comparison
Data Table on Geographic comparison

12.3 APAC - Market size and forecast 2025-2030

Chart on APAC - Market size and forecast 2025-2030 ($ million)
Data Table on APAC - Market size and forecast 2025-2030 ($ million)
Chart on APAC - Year-over-year growth 2025-2030 (%)
Data Table on APAC - Year-over-year growth 2025-2030 (%)
Chart on Regional Comparison - APAC
Data Table on Regional Comparison - APAC

12.3.1 China - Market size and forecast 2025-2030

Chart on China - Market size and forecast 2025-2030 ($ million)
Data Table on China - Market size and forecast 2025-2030 ($ million)
Chart on China - Year-over-year growth 2025-2030 (%)
Data Table on China - Year-over-year growth 2025-2030 (%)

12.3.2 India - Market size and forecast 2025-2030

Chart on India - Market size and forecast 2025-2030 ($ million)
Data Table on India - Market size and forecast 2025-2030 ($ million)
Chart on India - Year-over-year growth 2025-2030 (%)
Data Table on India - Year-over-year growth 2025-2030 (%)

12.3.3 Indonesia - Market size and forecast 2025-2030

Chart on Indonesia - Market size and forecast 2025-2030 ($ million)
Data Table on Indonesia - Market size and forecast 2025-2030 ($ million)
Chart on Indonesia - Year-over-year growth 2025-2030 (%)
Data Table on Indonesia - Year-over-year growth 2025-2030 (%)

12.3.4 Japan - Market size and forecast 2025-2030

Chart on Japan - Market size and forecast 2025-2030 ($ million)
Data Table on Japan - Market size and forecast 2025-2030 ($ million)
Chart on Japan - Year-over-year growth 2025-2030 (%)
Data Table on Japan - Year-over-year growth 2025-2030 (%)

12.3.5 South Korea - Market size and forecast 2025-2030

Chart on South Korea - Market size and forecast 2025-2030 ($ million)
Data Table on South Korea - Market size and forecast 2025-2030 ($ million)
Chart on South Korea - Year-over-year growth 2025-2030 (%)
Data Table on South Korea - Year-over-year growth 2025-2030 (%)

12.3.6 Australia - Market size and forecast 2025-2030

Chart on Australia - Market size and forecast 2025-2030 ($ million)
Data Table on Australia - Market size and forecast 2025-2030 ($ million)
Chart on Australia - Year-over-year growth 2025-2030 (%)
Data Table on Australia - Year-over-year growth 2025-2030 (%)

12.4 Europe - Market size and forecast 2025-2030

Chart on Europe - Market size and forecast 2025-2030 ($ million)
Data Table on Europe - Market size and forecast 2025-2030 ($ million)
Chart on Europe - Year-over-year growth 2025-2030 (%)
Data Table on Europe - Year-over-year growth 2025-2030 (%)
Chart on Regional Comparison - Europe
Data Table on Regional Comparison - Europe

12.4.1 UK - Market size and forecast 2025-2030

Chart on UK - Market size and forecast 2025-2030 ($ million)
Data Table on UK - Market size and forecast 2025-2030 ($ million)
Chart on UK - Year-over-year growth 2025-2030 (%)
Data Table on UK - Year-over-year growth 2025-2030 (%)

12.4.2 Spain - Market size and forecast 2025-2030

Chart on Spain - Market size and forecast 2025-2030 ($ million)
Data Table on Spain - Market size and forecast 2025-2030 ($ million)
Chart on Spain - Year-over-year growth 2025-2030 (%)
Data Table on Spain - Year-over-year growth 2025-2030 (%)

12.4.3 Germany - Market size and forecast 2025-2030

Chart on Germany - Market size and forecast 2025-2030 ($ million)
Data Table on Germany - Market size and forecast 2025-2030 ($ million)
Chart on Germany - Year-over-year growth 2025-2030 (%)
Data Table on Germany - Year-over-year growth 2025-2030 (%)

12.4.4 France - Market size and forecast 2025-2030

Chart on France - Market size and forecast 2025-2030 ($ million)
Data Table on France - Market size and forecast 2025-2030 ($ million)
Chart on France - Year-over-year growth 2025-2030 (%)
Data Table on France - Year-over-year growth 2025-2030 (%)

12.4.5 Italy - Market size and forecast 2025-2030

Chart on Italy - Market size and forecast 2025-2030 ($ million)
Data Table on Italy - Market size and forecast 2025-2030 ($ million)
Chart on Italy - Year-over-year growth 2025-2030 (%)
Data Table on Italy - Year-over-year growth 2025-2030 (%)

12.4.6 The Netherlands - Market size and forecast 2025-2030

Chart on The Netherlands - Market size and forecast 2025-2030 ($ million)
Data Table on The Netherlands - Market size and forecast 2025-2030 ($ million)
Chart on The Netherlands - Year-over-year growth 2025-2030 (%)
Data Table on The Netherlands - Year-over-year growth 2025-2030 (%)

12.5 North America - Market size and forecast 2025-2030

Chart on North America - Market size and forecast 2025-2030 ($ million)
Data Table on North America - Market size and forecast 2025-2030 ($ million)
Chart on North America - Year-over-year growth 2025-2030 (%)
Data Table on North America - Year-over-year growth 2025-2030 (%)
Chart on Regional Comparison - North America
Data Table on Regional Comparison - North America

12.5.1 US - Market size and forecast 2025-2030

Chart on US - Market size and forecast 2025-2030 ($ million)
Data Table on US - Market size and forecast 2025-2030 ($ million)
Chart on US - Year-over-year growth 2025-2030 (%)
Data Table on US - Year-over-year growth 2025-2030 (%)

12.5.2 Canada - Market size and forecast 2025-2030

Chart on Canada - Market size and forecast 2025-2030 ($ million)
Data Table on Canada - Market size and forecast 2025-2030 ($ million)
Chart on Canada - Year-over-year growth 2025-2030 (%)
Data Table on Canada - Year-over-year growth 2025-2030 (%)

12.5.3 Mexico - Market size and forecast 2025-2030

Chart on Mexico - Market size and forecast 2025-2030 ($ million)
Data Table on Mexico - Market size and forecast 2025-2030 ($ million)
Chart on Mexico - Year-over-year growth 2025-2030 (%)
Data Table on Mexico - Year-over-year growth 2025-2030 (%)

12.6 South America - Market size and forecast 2025-2030

Chart on South America - Market size and forecast 2025-2030 ($ million)
Data Table on South America - Market size and forecast 2025-2030 ($ million)
Chart on South America - Year-over-year growth 2025-2030 (%)
Data Table on South America - Year-over-year growth 2025-2030 (%)
Chart on Regional Comparison - South America
Data Table on Regional Comparison - South America

12.6.1 Chile - Market size and forecast 2025-2030

Chart on Chile - Market size and forecast 2025-2030 ($ million)
Data Table on Chile - Market size and forecast 2025-2030 ($ million)
Chart on Chile - Year-over-year growth 2025-2030 (%)
Data Table on Chile - Year-over-year growth 2025-2030 (%)

12.6.2 Brazil - Market size and forecast 2025-2030

Chart on Brazil - Market size and forecast 2025-2030 ($ million)
Data Table on Brazil - Market size and forecast 2025-2030 ($ million)
Chart on Brazil - Year-over-year growth 2025-2030 (%)
Data Table on Brazil - Year-over-year growth 2025-2030 (%)

12.6.3 Argentina - Market size and forecast 2025-2030

Chart on Argentina - Market size and forecast 2025-2030 ($ million)
Data Table on Argentina - Market size and forecast 2025-2030 ($ million)
Chart on Argentina - Year-over-year growth 2025-2030 (%)
Data Table on Argentina - Year-over-year growth 2025-2030 (%)

12.7 Middle East and Africa - Market size and forecast 2025-2030

Chart on Middle East and Africa - Market size and forecast 2025-2030 ($ million)
Data Table on Middle East and Africa - Market size and forecast 2025-2030 ($ million)
Chart on Middle East and Africa - Year-over-year growth 2025-2030 (%)
Data Table on Middle East and Africa - Year-over-year growth 2025-2030 (%)
Chart on Regional Comparison - Middle East and Africa
Data Table on Regional Comparison - Middle East and Africa

12.7.1 Egypt - Market size and forecast 2025-2030

Chart on Egypt - Market size and forecast 2025-2030 ($ million)
Data Table on Egypt - Market size and forecast 2025-2030 ($ million)
Chart on Egypt - Year-over-year growth 2025-2030 (%)
Data Table on Egypt - Year-over-year growth 2025-2030 (%)

12.7.2 Saudi Arabia - Market size and forecast 2025-2030

Chart on Saudi Arabia - Market size and forecast 2025-2030 ($ million)
Data Table on Saudi Arabia - Market size and forecast 2025-2030 ($ million)
Chart on Saudi Arabia - Year-over-year growth 2025-2030 (%)
Data Table on Saudi Arabia - Year-over-year growth 2025-2030 (%)

12.7.3 South Africa - Market size and forecast 2025-2030

Chart on South Africa - Market size and forecast 2025-2030 ($ million)
Data Table on South Africa - Market size and forecast 2025-2030 ($ million)
Chart on South Africa - Year-over-year growth 2025-2030 (%)
Data Table on South Africa - Year-over-year growth 2025-2030 (%)

12.7.4 UAE - Market size and forecast 2025-2030

Chart on UAE - Market size and forecast 2025-2030 ($ million)
Data Table on UAE - Market size and forecast 2025-2030 ($ million)
Chart on UAE - Year-over-year growth 2025-2030 (%)
Data Table on UAE - Year-over-year growth 2025-2030 (%)

12.7.5 Nigeria - Market size and forecast 2025-2030

Chart on Nigeria - Market size and forecast 2025-2030 ($ million)
Data Table on Nigeria - Market size and forecast 2025-2030 ($ million)
Chart on Nigeria - Year-over-year growth 2025-2030 (%)
Data Table on Nigeria - Year-over-year growth 2025-2030 (%)

12.8 Market opportunity by geography

Market opportunity by geography ($ million)
Data Tables on Market opportunity by geography ($ million)

13. Drivers, Challenges, and Opportunity

13.1 Market drivers

Intensification of aquaculture to meet growing global seafood demand
Increasingly stringent environmental regulations and sustainability mandates
Technological advancements and quest for operational efficiency

13.2 Market challenges

High initial capital outlay and operating expenditures
Technological and operational complexities
Regulatory compliance and limited adoption in developing regions

13.3 Impact of drivers and challenges

Impact of drivers and challenges in 2025 and 2030

13.4 Market opportunities

Increasing adoption of recirculating aquaculture systems
Rise of smart aquaculture and automated water quality management
Growing emphasis on sustainable and eco-friendly water treatment methods

14. Competitive Landscape

14.1 Overview

14.2

Overview on criticality of inputs and factors of differentiation

14.3 Landscape disruption

Overview on factors of disruption

14.4 Industry risks

Impact of key risks on business

15. Competitive Analysis

15.1 Companies profiled

Companies covered

15.2 Company ranking index

15.3 Market positioning of companies

Matrix on companies position and classification

15.4 AKVA group

AKVA group - Overview
AKVA group - Business segments
AKVA group - Key offerings
AKVA group - Segment focus
SWOT

15.5 Alumichem

Alumichem - Overview
Alumichem - Product / Service
Alumichem - Key offerings
SWOT

15.6 AquaMaof Aquaculture Technologies

AquaMaof Aquaculture Technologies - Overview
AquaMaof Aquaculture Technologies - Product / Service
AquaMaof Aquaculture Technologies - Key offerings
SWOT

15.7 Aquaneering Inc.

Aquaneering Inc. - Overview
Aquaneering Inc. - Product / Service
Aquaneering Inc. - Key offerings
SWOT

15.8 Atlantium Technologies Ltd.

Atlantium Technologies Ltd. - Overview
Atlantium Technologies Ltd. - Product / Service
Atlantium Technologies Ltd. - Key offerings
SWOT

15.9 Clewer Aquaculture

Clewer Aquaculture - Overview
Clewer Aquaculture - Product / Service
Clewer Aquaculture - Key offerings
SWOT

15.10 Dryden Aqua

Dryden Aqua - Overview
Dryden Aqua - Product / Service
Dryden Aqua - Key offerings
SWOT

15.11 Industrie De Nora Spa

Industrie De Nora Spa - Overview
Industrie De Nora Spa - Business segments
Industrie De Nora Spa - Key offerings
Industrie De Nora Spa - Segment focus
SWOT

15.12 Innovasea Systems Inc.

Innovasea Systems Inc. - Overview
Innovasea Systems Inc. - Product / Service
Innovasea Systems Inc. - Key offerings
SWOT

15.13 Pentair Plc

Pentair Plc - Overview
Pentair Plc - Business segments
Pentair Plc - Key news
Pentair Plc - Key offerings
Pentair Plc - Segment focus
SWOT

15.14 Primozone

Primozone - Overview
Primozone - Product / Service
Primozone - Key offerings
SWOT

15.15 Sterner AS

Sterner AS - Overview
Sterner AS - Product / Service
Sterner AS - Key offerings
SWOT

15.16 ULTRAAQUA AS

ULTRAAQUA AS - Overview
ULTRAAQUA AS - Product / Service
ULTRAAQUA AS - Key offerings
SWOT

15.17 Veolia Water Technologies

Veolia Water Technologies - Overview
Veolia Water Technologies - Product / Service
Veolia Water Technologies - Key offerings
SWOT

15.18 Xylem Inc.

Xylem Inc. - Overview
Xylem Inc. - Business segments
Xylem Inc. - Key news
Xylem Inc. - Key offerings
Xylem Inc. - Segment focus
SWOT

16. Appendix

16.1 Scope of the report

Market definition
Objectives
Notes and caveats

16.2 Inclusions and exclusions checklist

Inclusions checklist
Exclusions checklist

16.3 Currency conversion rates for US$

16.4 Research methodology

16.5 Data procurement

Information sources

16.6 Data validation

16.7 Validation techniques employed for market sizing

16.8 Data synthesis

16.9 360 degree market analysis

16.10 List of abbreviations

Research Methodology

Technavio presents a detailed picture of the market by way of study, synthesis, and summation of data from multiple sources. The analysts have presented the various facets of the market with a particular focus on identifying the key industry influencers. The data thus presented is comprehensive, reliable, and the result of extensive research, both primary and secondary.

INFORMATION SOURCES

Primary sources

  • Manufacturers and suppliers
  • Channel partners
  • Industry experts
  • Strategic decision makers

Secondary sources

  • Industry journals and periodicals
  • Government data
  • Financial reports of key industry players
  • Historical data
  • Press releases

DATA ANALYSIS

Data Synthesis

  • Collation of data
  • Estimation of key figures
  • Analysis of derived insights

Data Validation

  • Triangulation with data models
  • Reference against proprietary databases
  • Corroboration with industry experts

REPORT WRITING

Qualitative

  • Market drivers
  • Market challenges
  • Market trends
  • Five forces analysis

Quantitative

  • Market size and forecast
  • Market segmentation
  • Geographical insights
  • Competitive landscape

Interested in this report?

Get your sample now to see our research methodology and insights!

Download Now

Frequently Asked Questions

Water Treatment For Aquaculture market growth will increase by USD 5384.2 million during 2026-2030.

The Water Treatment For Aquaculture market is expected to grow at a CAGR of 6.6% during 2026-2030.

Water Treatment For Aquaculture market is segmented by Area (Freshwater, Marine) Technology (Open systems, Closed systems) Type (Recirculating aquaculture system, Ozone generator, Others)

AKVA group, Alumichem, AquaMaof Aquaculture Technologies, Aquaneering Inc., Atlantium Technologies Ltd., Clewer Aquaculture, Dryden Aqua, Faivre, Fluence Corp. Ltd., HESY, Industrie De Nora Spa, Innovasea Systems Inc., Landing Aquaculture, MAT Filtration Technologies, Pentair Plc, Primozone, Sterner AS, ULTRAAQUA AS, Veolia Water Technologies, Xylem Inc. are a few of the key vendors in the Water Treatment For Aquaculture market.

APAC will register the highest growth rate of 44.9% among the other regions. Therefore, the Water Treatment For Aquaculture market in APAC is expected to garner significant business opportunities for the vendors during the forecast period.

China, India, Indonesia, Japan, South Korea, Australia, UK, Spain, Germany, France, Italy, The Netherlands, US, Canada, Mexico, Chile, Brazil, Argentina, Egypt, Saudi Arabia, South Africa, UAE, Nigeria

  • Intensification of aquaculture to meet growing global seafood demand is the driving factor this market.

The Water Treatment For Aquaculture market vendors should focus on grabbing business opportunities from the Area segment as it accounted for the largest market share in the base year.
RIA - Research AI Assistant
Ask RIA
