
Polydadmac Market Size 2026-2030
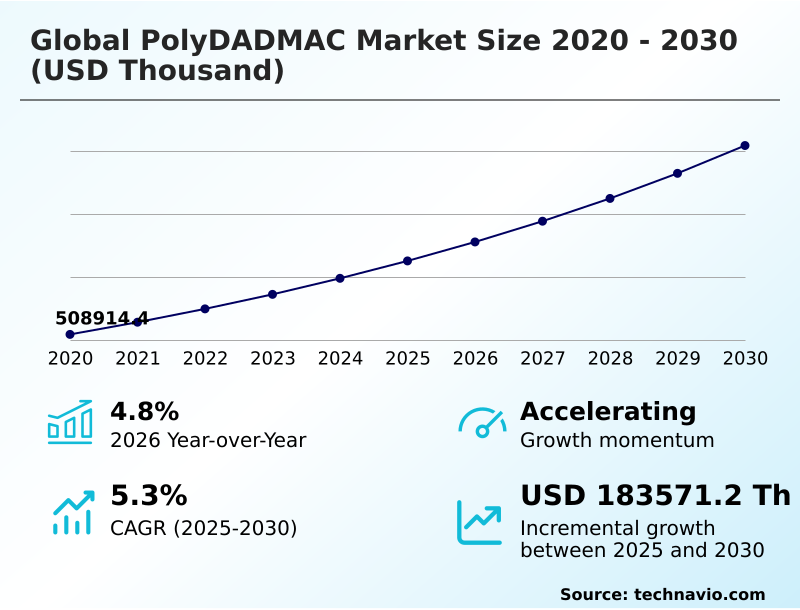
The polydadmac market size is valued to increase by USD 183.57 million, at a CAGR of 5.3% from 2025 to 2030. Institutionalization of strict wastewater discharge and PFAS compliance will drive the polydadmac market.
Major Market Trends & Insights
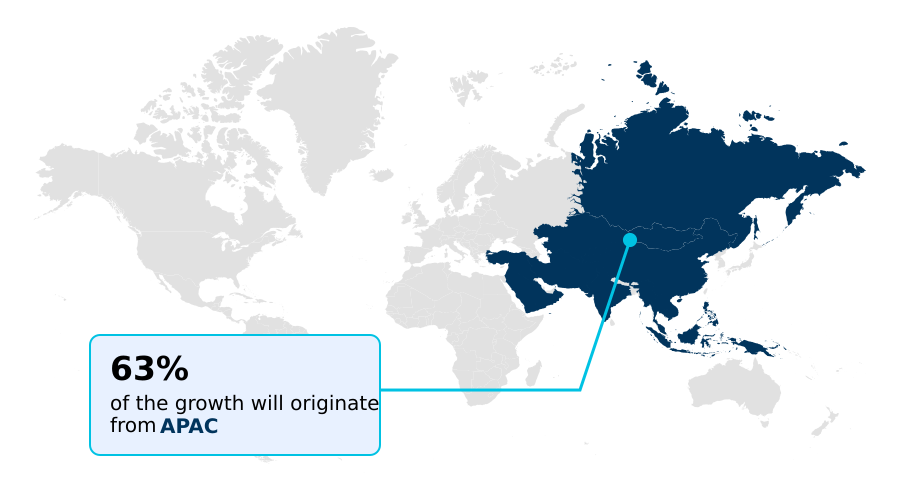
- APAC dominated the market and accounted for a 63.1% growth during the forecast period.
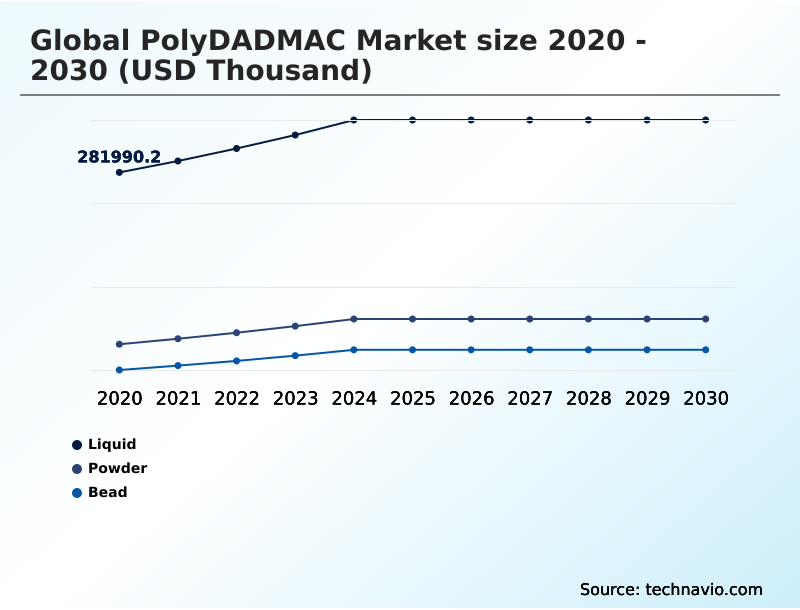
- By Type - Liquid segment was valued at USD 329.78 million in 2024
- By Application - Water purification segment accounted for the largest market revenue share in 2024
Market Size & Forecast
- Market Opportunities:
- Market Future Opportunities: USD 183.57 million
- CAGR from 2025 to 2030 : 5.3%
Market Summary
- The PolyDADMAC market is defined by its critical role in global water management and industrial processing, where it functions as a primary high-charge density polymer. This cationic coagulant is essential for liquid-solid separation processes required to meet stringent public health regulations and environmental mandates.
- Growth is propelled by its effectiveness in diverse applications, from potable water purification in municipal water works to serving as a pulp and paper retention aid. A key trend involves the adoption of smart dosing platform technologies, which enable real-time adjustments to chemical dosage.
- For example, a municipal water authority can leverage such a system to optimize its flocculation and coagulation processes, ensuring compliance with new limits on disinfection byproduct precursors while minimizing operational expenses. However, the market faces challenges from raw material price volatility tied to petrochemical derivative pricing and competition from green chemistry alternatives.
- The industry is responding with innovations in sustainable chemical synthesis and molecular weight optimization to maintain its competitive edge in water treatment infrastructure and specialty chemical manufacturing.
What will be the Size of the Polydadmac Market during the forecast period?
Get Key Insights on Market Forecast (PDF) Get Free Sample
How is the Polydadmac Market Segmented?
The polydadmac industry research report provides comprehensive data (region-wise segment analysis), with forecasts and estimates in "USD thousand" for the period 2026-2030, as well as historical data from 2020-2024 for the following segments.
- Type
- Liquid
- Powder
- Bead
- Application
- Water purification
- Pulp and paper industry
- Cosmetics
- Oilfields
- Others
- End-user
- Municipal authorities
- Industrial facilities
- Consumer product manufacturers
- Geography
- APAC
- China
- India
- Japan
- Europe
- Germany
- France
- UK
- North America
- US
- Canada
- Mexico
- South America
- Brazil
- Argentina
- Middle East and Africa
- Saudi Arabia
- South Africa
- UAE
- Rest of World (ROW)
- APAC
By Type Insights
The liquid segment is estimated to witness significant growth during the forecast period.
The PolyDADMAC market is segmented by type, application, and geography, with liquid formulations leading due to their ease of use in water treatment infrastructure.
This segment's dominance is driven by its compatibility with automated chemical dosing systems, enabling precision chemical application for wastewater clarification.
Facilities using these systems report significant gains; for instance, integrating smart dosing platforms with low-viscosity polymer formulation can reduce overall chemical consumption by up to 20%.
The utility of these water-soluble polymer applications extends to pulp and paper retention aid roles, where immediate solubility is critical for high-speed production.
Demand is sustained by the need for effective turbidity reduction chemistry in both potable water purification and industrial effluent treatment, where liquid-solid separation processes are fundamental.
As environmental discharge compliance becomes stricter, the focus on efficient coagulant dosage optimization and sludge volume reduction reinforces the preference for ready-to-use liquid solutions.
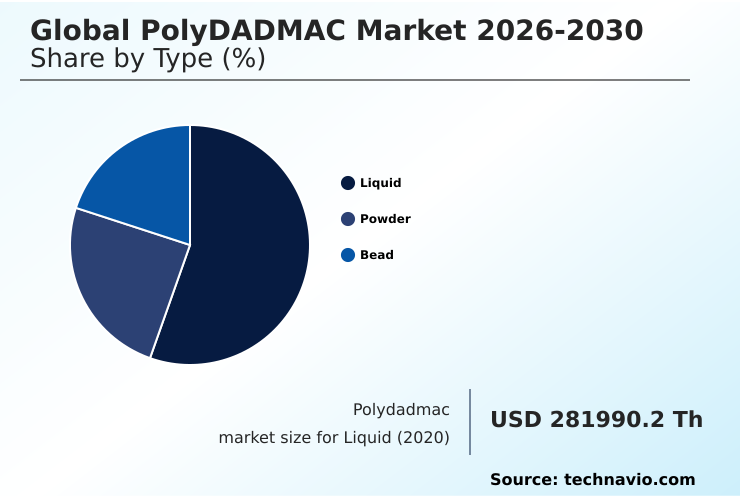
The Liquid segment was valued at USD 329.78 million in 2024 and showed a gradual increase during the forecast period.
Regional Analysis
APAC is estimated to contribute 63.1% to the growth of the global market during the forecast period.Technavio’s analysts have elaborately explained the regional trends and drivers that shape the market during the forecast period.
See How Polydadmac Market Demand is Rising in APAC Get Free Sample
The market's geographic landscape is led by APAC, which is projected to account for over 63% of incremental growth, driven by rapid industrialization and government-led water security initiatives in countries like China and India.
This region's demand is centered on both large-scale municipal water works and its expansive pulp and paper sector, which relies on the polymer as a crucial anionic trash neutralizer.
In contrast, Europe's market is shaped by stringent public health regulations, where the use of eco-friendly chemical formulations in closed-loop water systems is prioritized, resulting in outcomes like a 35% reduction in industrial effluent colorant discharge in certain applications.
North America represents a mature market focused on upgrading existing water treatment infrastructure with high-purity polymer grades. The global distribution reflects a pivot toward resource efficiency management and sustainable packaging materials, influencing regional priorities for flocculant performance evaluation.
Market Dynamics
Our researchers analyzed the data with 2025 as the base year, along with the key drivers, trends, and challenges. A holistic analysis of drivers will help companies refine their marketing strategies to gain a competitive advantage.
- Strategic decision-making in the PolyDADMAC market requires a nuanced understanding of its diverse applications and competitive positioning. When optimizing PolyDADMAC dosage in wastewater treatment, facilities must weigh its performance against alternatives, often comparing PolyDADMAC vs polyaluminum chloride effectiveness for specific effluent types.
- In the paper industry, the role of PolyDADMAC in pulp and paper manufacturing is critical for improving paper machine retention aids with polymers and controlling pitch and stickies in papermaking. The shift toward low viscosity PolyDADMAC for high-throughput water systems is a key trend, driven by its ability to reduce disinfection byproducts in water purification.
- Its function as a cationic polymer in personal care illustrates its versatility beyond industrial uses. In the energy sector, its use as a clay swelling inhibitor in drilling fluids and as a friction reducer performance in hydraulic fracturing is essential for chemical enhanced oil recovery polymer selection.
- The evaluation of bio-based flocculants vs synthetic polymers is becoming more common as sustainability pressures mount. A detailed cost analysis of PolyDADMAC in municipal water is crucial for procurement, especially considering the challenges of diallyldimethylammonium chloride monomer synthesis.
- Facilities focusing on industrial effluent color removal by managing anionic trash in recycled paper mills can achieve clarity levels up to 40% higher than those with unoptimized systems, directly impacting operational planning and compliance.
What are the key market drivers leading to the rise in the adoption of Polydadmac Industry?
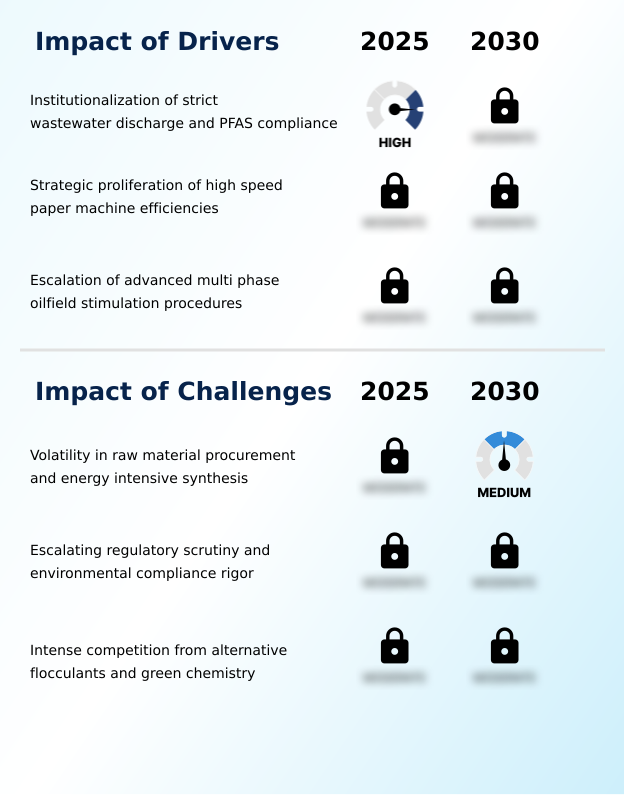
- The institutionalization of strict wastewater discharge mandates and rising per- and polyfluoroalkyl substances (PFAS) compliance requirements is a key driver for the market.
- Stringent regulatory frameworks are a primary driver, compelling the adoption of high-performance organic coagulants. Mandates targeting PFAS compliance, such as Germany's standard limiting certain substances to 0.1 micrograms per liter, necessitate advanced flocculation and coagulation techniques.
- This has accelerated the replacement of traditional inorganic coagulants to mitigate the formation of disinfection byproduct precursors and improve microbial contaminant removal.
- In the industrial sector, the need for efficiency in paper machine wet-end chemistry and enhanced oil recovery (EOR) chemicals also fuels demand.
- High-speed paper machines rely on the polymer's ability as a pitch control agent to maintain operational uptime, while its use as a hydraulic fracturing fluid additive is critical for unconventional oil and gas extraction, ensuring effective liquid-solid separation processes in produced water treatment.
What are the market trends shaping the Polydadmac Industry?
- A significant market trend is the industrialization of ultra-low viscosity PolyDADMAC formulations. These advanced polymers are designed to enhance operational efficiency in high-throughput water treatment facilities.
- The market is undergoing a structural shift driven by the industrialization of ultra-low viscosity polymer formulation options and multi-functional agents. These advanced water-soluble polymer applications are engineered for high-throughput water facilities, where automated chemical dosing is standard.
- The adoption of such systems has enabled some municipal water districts to achieve a 20% reduction in chemical consumption, underscoring a move toward precision chemical application. In the industrial sector, the integration of multi-functional fixing agents in textile dyeing has reduced colorant discharge by over 35%.
- This trend is supported by the development of smart dosing platform technologies that use real-time telemetry systems to perform coagulant dosage optimization, enhancing wastewater reclamation projects. The focus on low-viscosity polymers improves solids capture efficiency and supports the move toward more sustainable chemical synthesis.
What challenges does the Polydadmac Industry face during its growth?
- Volatility in raw material procurement and the energy-intensive nature of synthesis processes present a key challenge to industry growth.
- The market contends with significant headwinds, primarily raw material price volatility linked to petrochemical derivative pricing, with precursor chemical costs recently rising by approximately 12%. This financial pressure is compounded by energy-intensive polymerization processes.
- Furthermore, escalating regulatory scrutiny presents a major hurdle; comprehensive audits have revealed that over 30% of some chemical suppliers required immediate upgrades to their environmental control systems to maintain certification. Competition from green chemistry alternatives, such as bio-based flocculants and advanced inorganic coagulants like polyaluminum chloride (PAC) substitute, is intensifying.
- This forces producers to invest in monomer residue analysis and address concerns around N-Nitrosodimethylamine (NDMA) formation, pushing the industry toward greater supply chain resilience and innovation in eco-friendly chemical formulations to remain competitive.
Exclusive Technavio Analysis on Customer Landscape
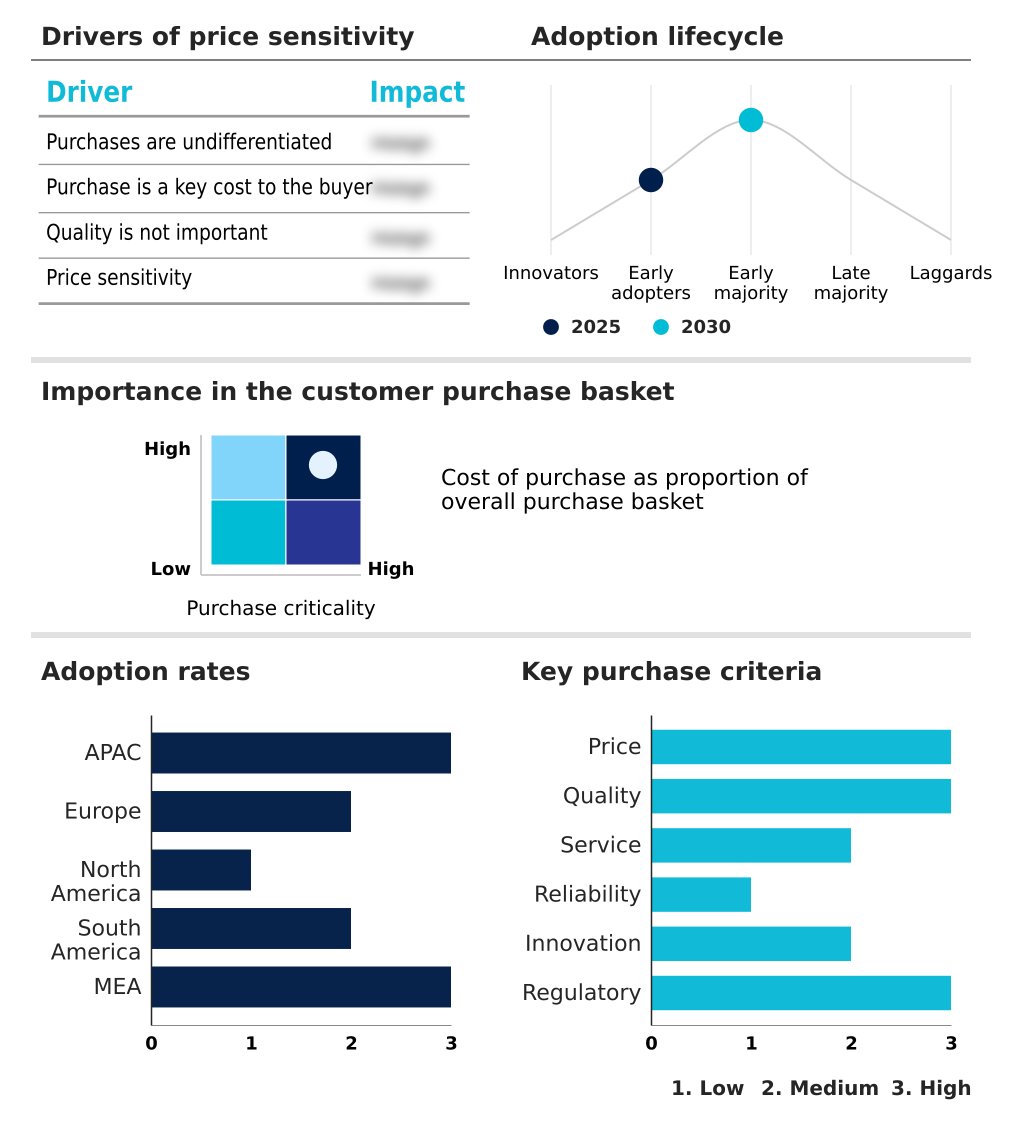
The polydadmac market forecasting report includes the adoption lifecycle of the market, covering from the innovator’s stage to the laggard’s stage. It focuses on adoption rates in different regions based on penetration. Furthermore, the polydadmac market report also includes key purchase criteria and drivers of price sensitivity to help companies evaluate and develop their market growth analysis strategies.
Customer Landscape of Polydadmac Industry
Competitive Landscape
Companies are implementing various strategies, such as strategic alliances, polydadmac market forecast, partnerships, mergers and acquisitions, geographical expansion, and product/service launches, to enhance their presence in the industry.
Accepta Ltd. - Offerings include high-performance cationic coagulants for wastewater treatment, sludge dewatering, and water clarification, enhancing process efficiency for industrial and municipal applications.
The industry research and growth report includes detailed analyses of the competitive landscape of the market and information about key companies, including:
- Accepta Ltd.
- Aries Chemical Inc.
- BASF SE
- Chemtrade Logistics Income
- Cleanwater Chemicals Co. Ltd.
- Ecolab Inc.
- Feralco AB
- GEO Specialty Chemicals Inc.
- IRO Polymer Chemical Co. Ltd.
- Jiayou Chemical Co. Ltd.
- Jucheng Chemical Co. Ltd.
- Kemira Oyj
- Oubo Chemical Co. Ltd.
- Shandong Greatland Chemical Co
- Shandong Luyue Chemical Co.
- SNF Group
- Solenis
- Tianlun Chemical Co. Ltd.
- USALCO LLC
- Yixing Bluwat Chemicals Co.
Qualitative and quantitative analysis of companies has been conducted to help clients understand the wider business environment as well as the strengths and weaknesses of key industry players. Data is qualitatively analyzed to categorize companies as pure play, category-focused, industry-focused, and diversified; it is quantitatively analyzed to categorize companies as dominant, leading, strong, tentative, and weak.
Recent Development and News in Polydadmac market
- In April, 2025, SNF Group, through its Indian subsidiary, secured a contract valued at approximately five hundred and forty-seven crore rupees from the Oil and Natural Gas Corporation to implement full-field polymer injection facilities for enhanced oil recovery.
- In March, 2025, the United States Environmental Protection Agency implemented revised National Primary Drinking Water Regulations, establishing more stringent maximum contaminant levels for certain per- and polyfluoroalkyl substances (PFAS).
- In March, 2025, Kemira Oyj announced the finalization of strategic capital allocations and a share repurchase program designed to enhance financial resilience and support its focus on sustainable chemistry solutions for water-intensive industries.
- In February, 2025, BASF SE outlined a strategic pivot in its industrial solutions segment, emphasizing performance-led innovation and a strengthened focus on emerging markets to counteract subdued global economic development and drive growth.
Dive into Technavio’s robust research methodology, blending expert interviews, extensive data synthesis, and validated models for unparalleled Polydadmac Market insights. See full methodology.
| Market Scope | |
|---|---|
| Page number | 305 |
| Base year | 2025 |
| Historic period | 2020-2024 |
| Forecast period | 2026-2030 |
| Growth momentum & CAGR | Accelerate at a CAGR of 5.3% |
| Market growth 2026-2030 | USD 183571.2 thousand |
| Market structure | Fragmented |
| YoY growth 2025-2026(%) | 4.8% |
| Key countries | China, India, Japan, South Korea, Indonesia, Australia, Germany, France, UK, Italy, Spain, The Netherlands, US, Canada, Mexico, Brazil, Argentina, Chile, Saudi Arabia, South Africa, UAE, Turkey and Israel |
| Competitive landscape | Leading Companies, Market Positioning of Companies, Competitive Strategies, and Industry Risks |
Research Analyst Overview
- The PolyDADMAC market is evolving beyond bulk chemical supply toward precision-driven solutions, where the polymer's function as a high-charge density cationic coagulant is enhanced by technology. A primary trend shaping boardroom-level investment is the adoption of automated chemical dosing systems, which optimize flocculation and coagulation in real time.
- This shift toward digital oversight allows facilities to achieve measurable efficiency gains, with some operators reporting up to a 20% reduction in total chemical usage, directly impacting operational budgets. The efficacy of these systems relies on sophisticated turbidity reduction chemistry and molecular weight optimization of the polymer.
- This focus on performance is critical for applications ranging from potable water purification and industrial effluent treatment to its use as an oilfield clay stabilizer.
- The market's technical foundation remains the synthesis of diallyldimethylammonium chloride monomer, but its future value lies in integrating this core chemistry with smart platforms that guarantee superior organic coagulant performance, solids capture efficiency, and effective sludge dewatering operations, mitigating risks like N-Nitrosodimethylamine (NDMA) formation.
What are the Key Data Covered in this Polydadmac Market Research and Growth Report?
-
What is the expected growth of the Polydadmac Market between 2026 and 2030?
-
USD 183.57 million, at a CAGR of 5.3%
-
-
What segmentation does the market report cover?
-
The report is segmented by Type (Liquid, Powder, and Bead), Application (Water purification, Pulp and paper industry, Cosmetics, Oilfields, and Others), End-user (Municipal authorities, Industrial facilities, and Consumer product manufacturers) and Geography (APAC, Europe, North America, South America, Middle East and Africa)
-
-
Which regions are analyzed in the report?
-
APAC, Europe, North America, South America and Middle East and Africa
-
-
What are the key growth drivers and market challenges?
-
Institutionalization of strict wastewater discharge and PFAS compliance, Volatility in raw material procurement and energy intensive synthesis
-
-
Who are the major players in the Polydadmac Market?
-
Accepta Ltd., Aries Chemical Inc., BASF SE, Chemtrade Logistics Income, Cleanwater Chemicals Co. Ltd., Ecolab Inc., Feralco AB, GEO Specialty Chemicals Inc., IRO Polymer Chemical Co. Ltd., Jiayou Chemical Co. Ltd., Jucheng Chemical Co. Ltd., Kemira Oyj, Oubo Chemical Co. Ltd., Shandong Greatland Chemical Co, Shandong Luyue Chemical Co., SNF Group, Solenis, Tianlun Chemical Co. Ltd., USALCO LLC and Yixing Bluwat Chemicals Co.
-
Market Research Insights
- The market's dynamics are shaped by a dual focus on operational efficiency and cost management. The adoption of digitalized chemical management and real-time telemetry systems is enabling precision chemical application, with some municipal water districts achieving a 20% reduction in total chemical usage.
- Similarly, the use of multi-functional fixing agents in textile manufacturing has been shown to cut colorant discharge by over 35%, directly improving environmental discharge compliance. This drive for efficiency through high-purity polymer grades and wastewater reclamation projects is counterbalanced by supply-side pressures.
- The reliance on petrochemical derivatives creates vulnerability to raw material price volatility, with precursor chemical costs having recently seen elevations around 12%. This tension forces companies to innovate in areas like closed-loop water systems and resource efficiency management to protect margins while delivering advanced water-soluble polymer applications.
We can help! Our analysts can customize this polydadmac market research report to meet your requirements.
 RIA -
RIA - 
