
Wealth Tech Back-Office Platforms Market Size and Growth Forecast 2026-2030
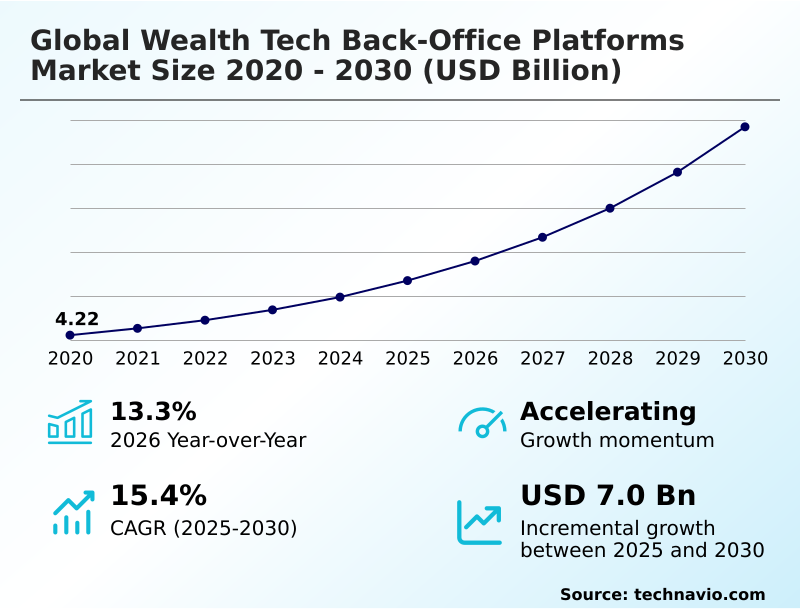
The Wealth Tech Back-Office Platforms Market size was valued at USD 6.70 billion in 2025 growing at a CAGR of 15.4% during the forecast period 2026-2030.
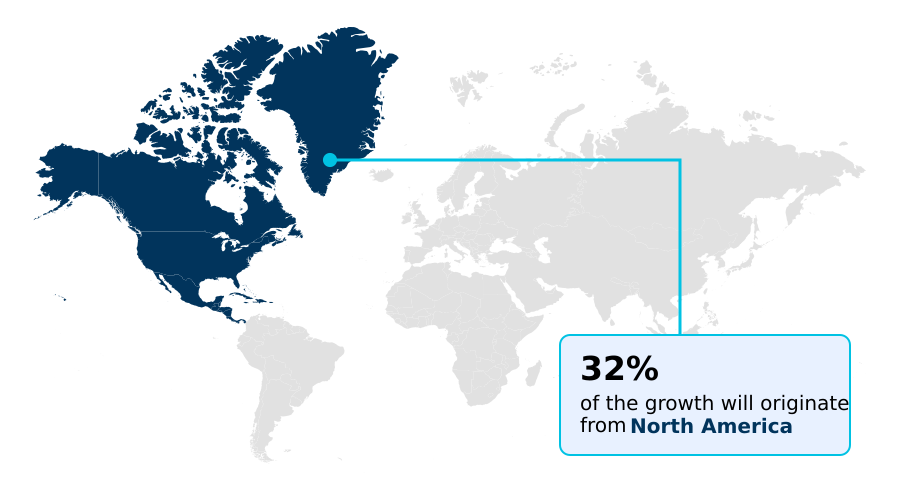
North America accounts for 32.3% of incremental growth during the forecast period. The Solutions segment by Component was valued at USD 3.48 billion in 2024, while the Cloud-based platforms segment holds the largest revenue share by Deployment.
The market is projected to grow by USD 9.47 billion from 2020 to 2030, with USD 7.00 billion of the growth expected during the forecast period of 2025 to 2030.
Get Key Insights on Market Forecast (PDF) Request Free Sample
Wealth Tech Back-Office Platforms Market Overview
The wealth tech back-office platforms market is propelled by the financial industry's imperative for operational efficiency automation. Institutions are moving away from manual processes to adopt integrated solutions that streamline portfolio management software, fee billing, and trade settlement processing. A key dynamic is the adoption of advanced AI machine learning to manage risk and compliance management and enhance decision-making. For instance, a mid-sized asset manager implementing an AI-driven platform for corporate action processing can reduce manual reconciliation errors by over 90%, cutting reporting cycles from days to hours. This technological shift is most pronounced in North America, which accounts for 32.3% of the market's incremental growth, where firms are aggressively upgrading systems to handle complex data aggregation and provide superior performance reporting. However, this modernization is complicated by significant cybersecurity data privacy concerns and the complexities of legacy system integration, forcing a careful balance between innovation and security under strict anti-money laundering protocols.
Drivers, Trends, and Challenges in the Wealth Tech Back-Office Platforms Market
Procurement decisions are heavily influenced by the total cost of ownership, where high wealth tech platform implementation costs are a primary consideration for financial institutions. To justify this expenditure, firms seek clear ROI from back-office automation for trade reconciliation, which can significantly reduce operational errors and settlement times.
Integrating AI into wealth management back-office operations is no longer a differentiator but a core requirement for predictive analytics and anomaly detection. A key driver for platform upgrades is the mandate to incorporate ESG analytics in portfolio management, a non-negotiable feature governed by regulations like the EU's Sustainable Finance Disclosure Regulation (SFDR).
Within a typical workflow, a platform leveraging AI for reconciliation can reduce settlement breaks by up to 90% compared to manual processes. The rise of distributed ledger for trade settlement offers a pathway to further efficiency gains and cost reductions, though it presents its own set of integration challenges.
Concurrently, firms must address persistent cybersecurity threats in wealth tech platforms, making security architecture a critical aspect of vendor evaluation.
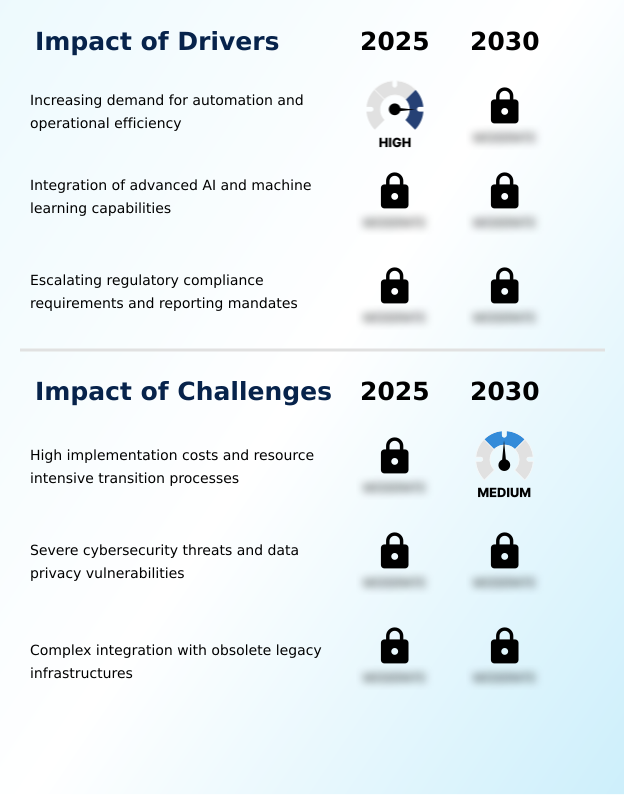
Primary Growth Driver: The increasing demand for automation to enhance operational efficiency serves as the principal driver for the wealth tech back-office platforms market.
The primary market driver is the relentless pursuit of operational efficiency through automation, compelling firms to invest in sophisticated back-office platforms.
Increasing regulatory complexity, particularly around risk and compliance management, necessitates automated regulatory compliance reporting to avoid penalties and ensure adherence to standards like KYC and AML.
The integration of advanced AI machine learning is critical for processing vast datasets, improving decision-making, and enabling functionalities such as automated fee billing and multi-currency transactions.
As firms scale, the need for robust portfolio management software that can handle high volumes of data aggregation and trade reconciliation without manual intervention becomes paramount, driving continuous investment in modern technological solutions.
Emerging Market Trend: The wealth tech market is defined by a structural shift toward cloud-native interoperability. This transition is facilitated by the adoption of open application programming interfaces.
Key market trends are centered on architectural modernization to enhance operational agility. Financial institutions are increasingly adopting cloud-native architecture and open API integration to dismantle data silos and enable seamless connectivity between disparate systems. This shift facilitates the integration of advanced technologies like distributed ledger technology, which is transforming trade settlement processing by enabling real-time gross settlement.
Furthermore, there is a significant push toward embedding environmental social governance analytics directly into core portfolio accounting workflows, driven by both investor demand and regulatory pressure. The market is experiencing a year-over-year growth of 13.3%, largely fueled by the adoption of platforms capable of advanced AI machine learning for predictive analytics and risk management.
Key Industry Challenge: High implementation costs and resource-intensive transition processes present a key challenge to the growth of the wealth tech back-office platforms market.
Significant challenges constrain market adoption, led by high implementation costs and the complexities of migrating from deeply embedded legacy systems. The process of legacy system integration is often resource-intensive and fraught with risk, creating a major hurdle for established institutions.
Furthermore, the increasing sophistication of cybersecurity data privacy threats necessitates continuous and substantial investment in security infrastructure, adding to the total cost of ownership. Many firms still rely on on-premise platform deployment, and transitioning these to more agile cloud-based or hybrid deployment models requires careful planning to ensure data integrity and operational continuity.
These factors, combined with the need for specialized talent, create a formidable barrier to entry and modernization for many market participants.
Explore Full Market Dynamics Analysis Request Free Sample
Wealth Tech Back-Office Platforms Market Segmentation
The wealth tech back-office platforms industry research report provides comprehensive data including region-wise segment analysis, with forecasts and analysis for the period 2026-2030, as well as historical data from 2020-2024 for the following segments.
Component Segment Analysis
The solutions segment is estimated to witness significant growth during the forecast period.
The solutions segment is the technological core of the wealth tech back-office platforms market, encompassing the proprietary software, databases, and application programming interfaces that enable administrative automation.
This segment has moved from monolithic software to flexible, cloud-native architecture, allowing financial firms to license specific modules like fee billing or corporate action processing.
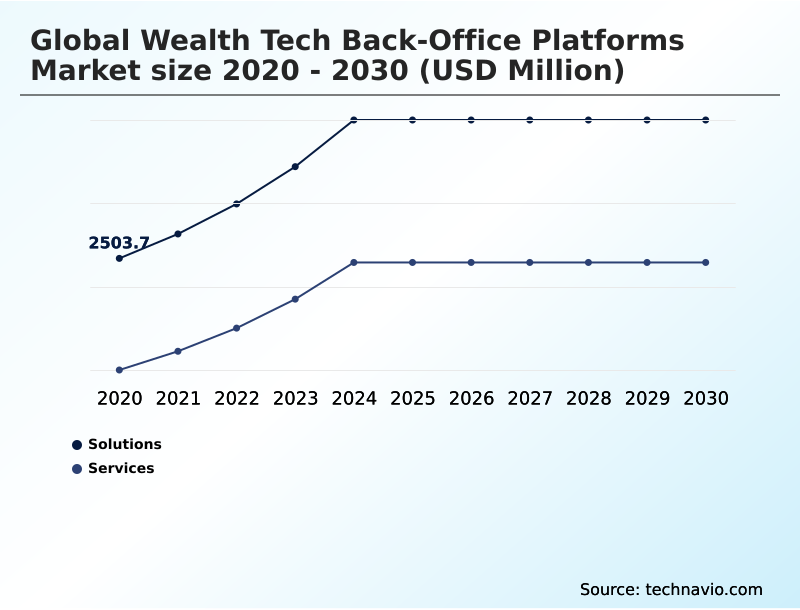
These solutions are engineered to ingest and normalize complex data for functions such as portfolio accounting and trade reconciliation. The solutions segment is significantly larger than services, reflecting the industry's investment in foundational technology.
This includes platforms designed for comprehensive performance reporting and risk and compliance management, which are critical for operational integrity and regulatory adherence under frameworks like KNOW YOUR CUSTOMER.
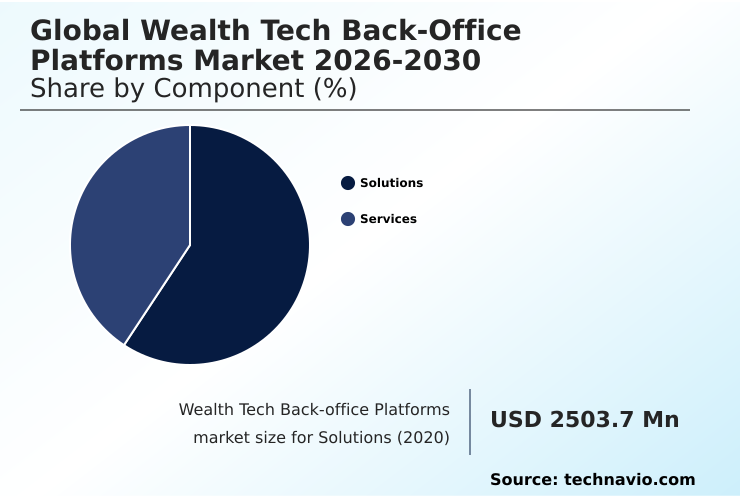
The Solutions segment was valued at USD 3.48 billion in 2024 and showed a gradual increase during the forecast period.
Wealth Tech Back-Office Platforms Market by Region: North America Leads with 32.3% Growth Share
North America is estimated to contribute 32.3% to the growth of the global market during the forecast period.
The geographic landscape of the wealth tech back-office platforms market is characterized by a dual-speed expansion.
North America continues to dominate, contributing 32.3% of the market's incremental growth, driven by the need to modernize entrenched legacy systems with solutions that support advanced data aggregation and API integration.
In contrast, the APAC region is projected to experience the fastest growth, with a CAGR of 16.9%, as financial institutions in developing economies bypass legacy infrastructure entirely, adopting cloud-native architecture from the outset.
In Europe, which accounts for over 27% of the market, data sovereignty regulations like GDPR drive demand for hybrid deployment models that combine on-premise security with cloud flexibility for handling multi-currency transactions and complex compliance monitoring.
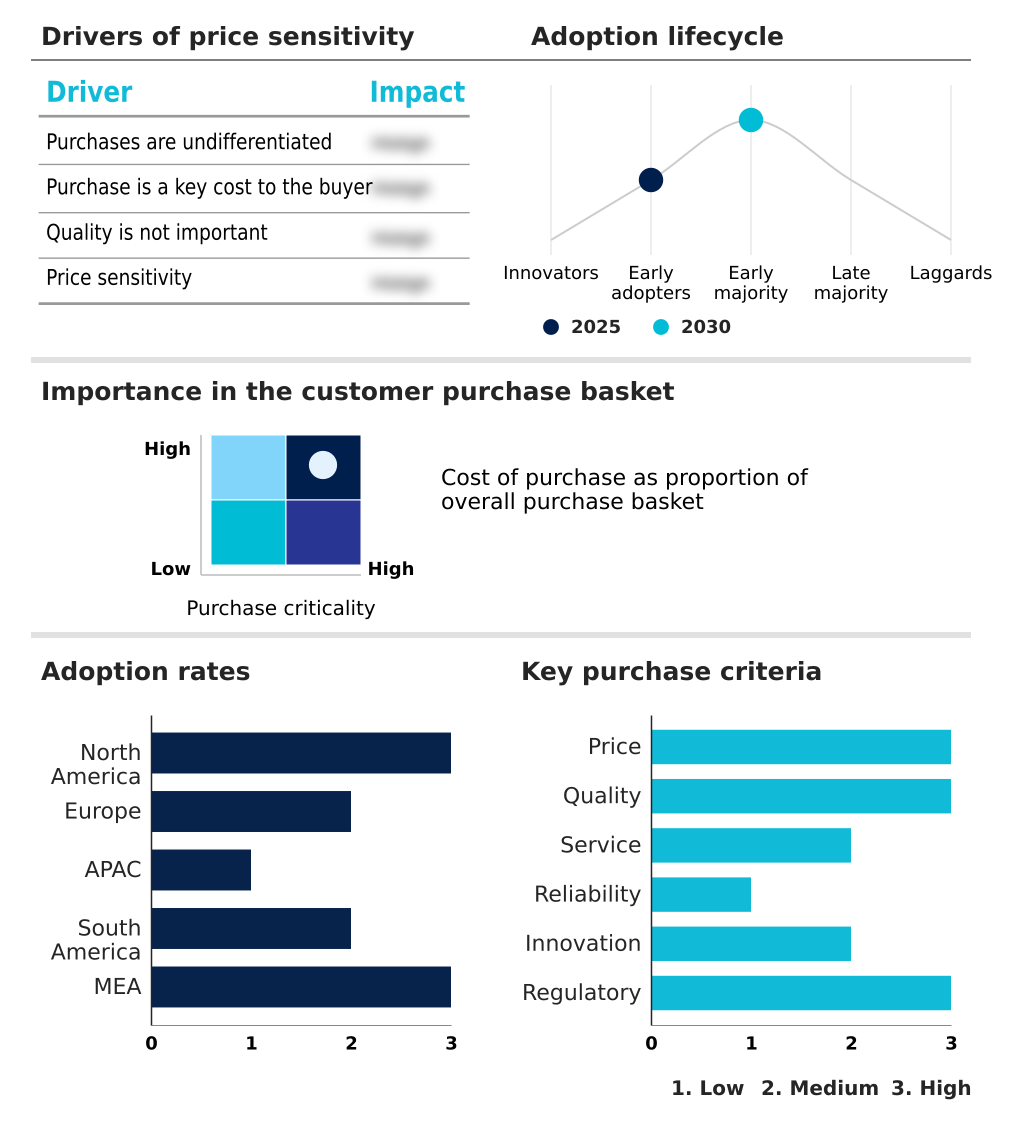
Customer Landscape Analysis for the Wealth Tech Back-Office Platforms Market
The wealth tech back-office platforms market forecasting report includes the adoption lifecycle of the market, covering from the innovator’s stage to the laggard’s stage. It focuses on adoption rates in different regions based on penetration. Furthermore, the wealth tech back-office platforms market report also includes key purchase criteria and drivers of price sensitivity to help companies evaluate and develop their market growth analysis strategies.
Competitive Landscape of the Wealth Tech Back-Office Platforms Market
Companies are implementing various strategies, such as strategic alliances, partnerships, mergers and acquisitions, geographical expansion, and product/service launches, to enhance their presence in the wealth tech back-office platforms market industry.
Addepar, Inc - Offers wealth tech back-office platforms featuring advanced data aggregation, portfolio accounting, and complex multi-asset reporting.
The industry research and growth report includes detailed analyses of the competitive landscape of the market and information about key companies, including:
- Addepar, Inc
- Avaloq Group AG
- Bank of New York Mellon Corp.
- BlackRock Inc.
- Broadridge Financial Solutions Inc.
- Comarch SA
- Envestnet Inc.
- Fidelity National Information
- Fiserv Inc.
- FMR LLC
- FNZ Group Technologies Ltd.
- InvestCloud Inc.
- Miles Software
- Orion Advisor Solutions Inc.
- Razorhorse Capital LLC
- SEI investment Co.
- SimCorp A/S
- SS and C Technologies Inc.
- State Street Corp.
- Temenos AG
Qualitative and quantitative analysis of companies has been conducted to help clients understand the wider business environment as well as the strengths and weaknesses of key industry players. Data is qualitatively analyzed to categorize companies as pure play, category-focused, industry-focused, and diversified; it is quantitatively analyzed to categorize companies as dominant, leading, strong, tentative, and weak.
Recent Developments in the Wealth Tech Back-Office Platforms Market
- In May 2025, iCapital entered into an agreement to acquire Citigroups wealth alternatives unit, a transaction that expands iCapitals platform capabilities for administration and servicing of alternative investments.
- In May 2025, Groww entered into a definitive agreement to acquire wealthtech startup Fisdom in an all-cash transaction valued at approximately $150 million to strengthen its advisory-led investment solutions.
- In April 2025, UK-based Fundment raised approximately $55.5 million in Series C funding to support the expansion of its integrated adviser platform, which includes custody, portfolio management, and back-office services.
- In March 2025, Docupace completed the acquisition of Hubly, a workflow automation platform, to expand its back-office automation capabilities in advisor task management and operational efficiency.
Research Analyst Overview: Wealth Tech Back-Office Platforms Market
The market's evolution is defined by a decisive pivot toward cloud-native architecture, which is forcing boardroom-level reappraisals of CAPEX versus OPEX for technology infrastructure. The primary driver is not just cost reduction but the need for operational agility to manage intricate compliance monitoring and portfolio accounting functions.
A key consideration is the integration of distributed ledger technology for real-time gross settlement, which promises to eliminate reconciliation bottlenecks inherent in legacy systems. This trend is reinforced by stringent regulatory frameworks like MiFID II, which mandate granular transparency and robust audit trails that older platforms cannot provide.
With the solutions segment being the market's largest, investment is concentrated on modular platforms that use API integration to connect disparate functions like trade reconciliation, fee billing, and performance reporting. This architectural shift enables firms to achieve straight-through processing, a critical capability for managing multi-currency transactions and complex data aggregation at scale.
Dive into Technavio’s robust research methodology, blending expert interviews, extensive data synthesis, and validated models for unparalleled Wealth Tech Back-Office Platforms Market insights. See full methodology.
| Market Scope | |
|---|---|
| Page number | 297 |
| Base year | 2025 |
| Historic period | 2020-2024 |
| Forecast period | 2026-2030 |
| Growth momentum & CAGR | Accelerate at a CAGR of 15.4% |
| Market growth 2026-2030 | USD 6996.8 million |
| Market structure | Fragmented |
| YoY growth 2025-2026(%) | 13.3% |
| Key countries | US, Canada, Mexico, Germany, UK, France, Italy, The Netherlands, Spain, China, India, Japan, Australia, South Korea, Indonesia, Brazil, Argentina, Colombia, Saudi Arabia, UAE, South Africa, Israel and Turkey |
| Competitive landscape | Leading Companies, Market Positioning of Companies, Competitive Strategies, and Industry Risks |
Wealth Tech Back-Office Platforms Market: Key Questions Answered in This Report
-
What is the expected growth of the Wealth Tech Back-Office Platforms Market between 2026 and 2030?
-
The Wealth Tech Back-Office Platforms Market is expected to grow by USD 7.00 billion during 2026-2030, registering a CAGR of 15.4%. Year-over-year growth in 2026 is estimated at 13.3%%. This acceleration is shaped by increasing demand for automation and operational efficiency, which is intensifying demand across multiple end-use verticals covered in the report.
-
-
What segmentation does the market report cover?
-
The report is segmented by Component (Solutions, and Services), Deployment (Cloud-based platforms, On-premise platforms, and Hybrid deployment models), Application (Portfolio management, Risk and compliance management, Performance reporting and analytics, and Trade order management and execution) and Geography (North America, Europe, APAC, South America, Middle East and Africa). Among these, the Solutions segment is estimated to witness significant growth during the forecast period, driven by rising adoption across key application areas. Each segment includes detailed qualitative and quantitative analysis, along with historical data from 2020-2024 and forecasts through 2030 with year-over-year growth rates.
-
-
Which regions are analyzed in the report?
-
The report covers North America, Europe, APAC, South America and Middle East and Africa. North America is estimated to contribute 32.3% to market growth during the forecast period. Country-level analysis includes US, Canada, Mexico, Germany, UK, France, Italy, The Netherlands, Spain, China, India, Japan, Australia, South Korea, Indonesia, Brazil, Argentina, Colombia, Saudi Arabia, UAE, South Africa, Israel and Turkey, with dedicated market size tables and year-over-year growth for each.
-
-
What are the key growth drivers and market challenges?
-
The primary driver is increasing demand for automation and operational efficiency, which is accelerating investment and industry demand. The main challenge is high implementation costs and resource intensive transition processes, creating operational barriers for key market participants. The report quantifies the impact of each driver and challenge across 2026 and 2030 with comparative analysis.
-
-
Who are the major players in the Wealth Tech Back-Office Platforms Market?
-
Key vendors include Addepar, Inc, Avaloq Group AG, Bank of New York Mellon Corp., BlackRock Inc., Broadridge Financial Solutions Inc., Comarch SA, Envestnet Inc., Fidelity National Information, Fiserv Inc., FMR LLC, FNZ Group Technologies Ltd., InvestCloud Inc., Miles Software, Orion Advisor Solutions Inc., Razorhorse Capital LLC, SEI investment Co., SimCorp A/S, SS and C Technologies Inc., State Street Corp. and Temenos AG. The report provides qualitative and quantitative analysis categorizing companies as dominant, leading, strong, tentative, and weak based on their market positioning. Company profiles include business segment analysis, SWOT assessment, key offerings, and recent strategic developments.
-
Wealth Tech Back-Office Platforms Market Research Insights
Market dynamics are shaped by intense regulatory pressure and the strategic need for operational agility. The escalating complexity of regulatory compliance reporting under frameworks such as MiFID II is compelling firms to abandon manual processes.
This creates significant demand for platforms that support hybrid deployment models, allowing sensitive client data to be managed through on-premise platform deployment while leveraging cloud-based platform deployment for scalable analytics. The APAC region demonstrates the highest growth potential, with a CAGR of 16.9%, as firms there leapfrog legacy technologies.
This contrasts with North America's more mature market, which grows at 14.5% but focuses on integrating advanced AI machine learning to refine existing portfolio management software and enhance trade settlement processing.
We can help! Our analysts can customize this wealth tech back-office platforms market research report to meet your requirements.
 RIA -
RIA - 
