Welding Equipment Market Analysis, Size, and Forecast 2026-2030: APAC (China, Japan, and India), North America (US, Canada, and Mexico), Europe (Germany, France, and UK), South America (Brazil and Argentina), Middle East and Africa (Saudi Arabia, UAE, and South Africa), and Rest of World (ROW)

Welding Equipment Market Analysis, Size, and Forecast 2026-2030:
APAC (China, Japan, and India), North America (US, Canada, and Mexico), Europe (Germany, France, and UK), South America (Brazil and Argentina), Middle East and Africa (Saudi Arabia, UAE, and South Africa), and Rest of World (ROW)

Published: Apr 2026 307 Pages SKU: IRTNTR40473

Market Overview at a Glance

$5.48 B
Market Opportunity
6.3%
CAGR 2025 - 2030
48.8%
APAC Growth
$4.08 B
Automotive segment 2024

Welding Equipment Market Size 2026-2030

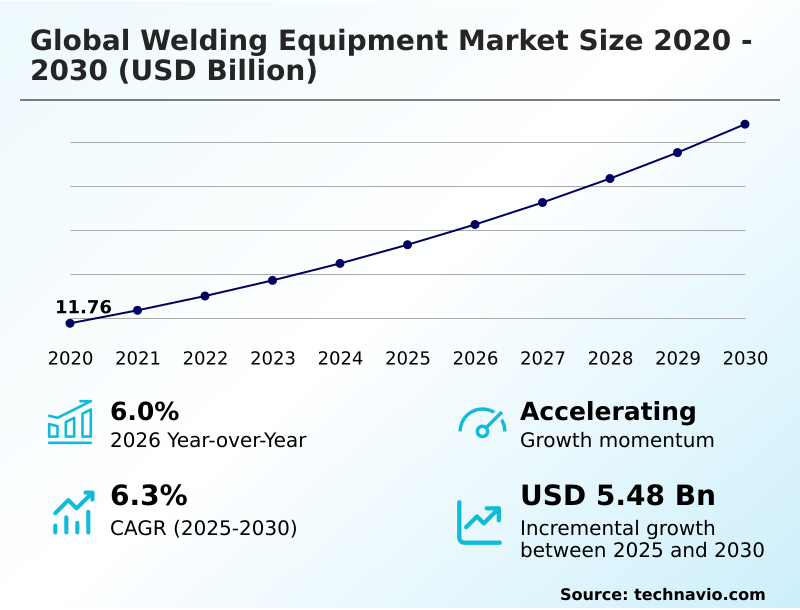
The welding equipment market size is valued to increase by USD 5.48 billion, at a CAGR of 6.3% from 2025 to 2030. Accelerated adoption of industrial automation and robotics will drive the welding equipment market.

Major Market Trends & Insights

  • APAC dominated the market and accounted for a 48.8% growth during the forecast period.
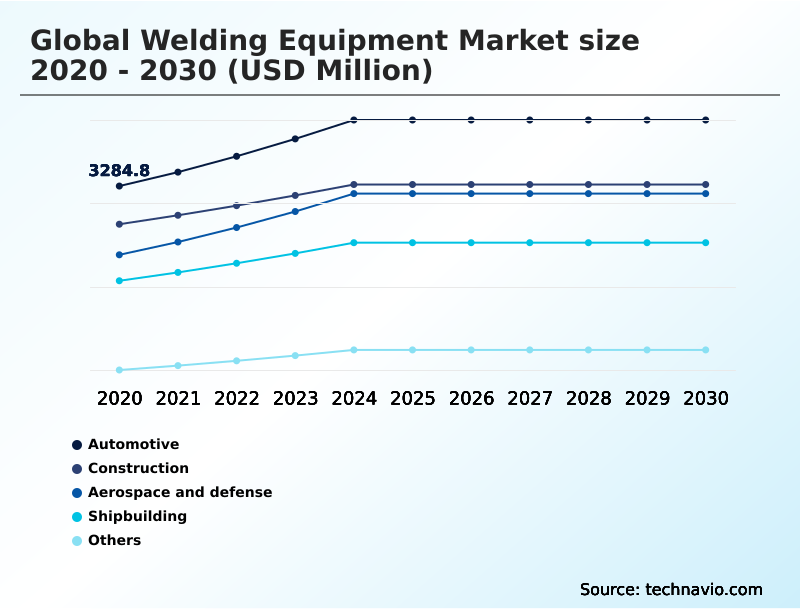
  • By End-user - Automotive segment was valued at USD 4.08 billion in 2024
  • By Technology - Arc welding segment accounted for the largest market revenue share in 2024

Market Size & Forecast

  • Market Opportunities: USD 9.05 billion
  • Market Future Opportunities: USD 5.48 billion
  • CAGR from 2025 to 2030 : 6.3%

Market Summary

  • The welding equipment market is undergoing a significant transformation driven by the push for greater industrial automation and the integration of digital manufacturing principles. A persistent shortage of skilled labor is accelerating the adoption of robotic welding and automated welding cells, which offer enhanced precision and throughput for high-volume production.
  • In parallel, advancements in laser beam welding and friction stir welding are enabling high-precision joining of advanced materials like high-strength steels and lightweight alloys, which are critical in the aerospace and automotive sectors.
  • For instance, an aerospace components manufacturer can leverage digital welding platforms with integrated weld monitoring to achieve full traceability for every joint, reducing rework by over 30% and ensuring compliance with stringent safety standards. This shift toward smart factory integration is further supported by the development of inverter-based systems and advanced welding power sources that improve energy efficiency.
  • As industries prioritize productivity and quality, the focus is shifting from standalone machines to interconnected ecosystems that utilize real-time data analytics for predictive maintenance and process optimization.

What will be the Size of the Welding Equipment Market during the forecast period?

Get Key Insights on Market Forecast (PDF) Request Free Sample

How is the Welding Equipment Market Segmented?

The welding equipment industry research report provides comprehensive data (region-wise segment analysis), with forecasts and estimates in "USD million" for the period 2026-2030, as well as historical data from 2020-2024 for the following segments.

  • End-user
    • Automotive
    • Construction
    • Aerospace and defense
    • Shipbuilding
    • Others
  • Technology
    • Arc welding
    • Resistance welding
    • Laser beam welding
    • Oxy-fuel welding
  • Product type
    • Automatic
    • Semi-automatic
    • Manual
  • Geography
    • APAC
      • China
      • Japan
      • India
    • North America
      • US
      • Canada
      • Mexico
    • Europe
      • Germany
      • France
      • UK
    • South America
      • Brazil
      • Argentina
    • Middle East and Africa
      • Saudi Arabia
      • UAE
      • South Africa
    • Rest of World (ROW)

By End-user Insights

The automotive segment is estimated to witness significant growth during the forecast period.

The automotive segment is rapidly evolving with the pivot to electric vehicle platforms and the need for lightweight material integration. This transition drives demand for advanced high-strength steels and sophisticated joining solutions capable of handling dissimilar metals joining.

Production lines are increasingly reliant on automated welding cells using resistance spot welding and laser beam welding to ensure precision and high throughput.

The implementation of robotic welding with predictive weld quality systems, which can reduce post-weld inspection needs by over 25%, is critical for maintaining structural integrity in battery enclosures and vehicle frames, making welding automation a focal point for capital investment.

Request Free Sample

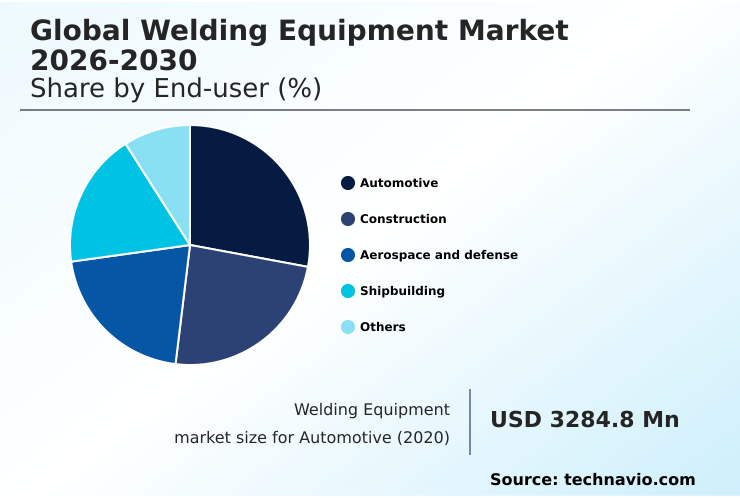
The Automotive segment was valued at USD 4.08 billion in 2024 and showed a gradual increase during the forecast period.

Request Free Sample

Regional Analysis

APAC is estimated to contribute 48.8% to the growth of the global market during the forecast period.Technavio’s analysts have elaborately explained the regional trends and drivers that shape the market during the forecast period.

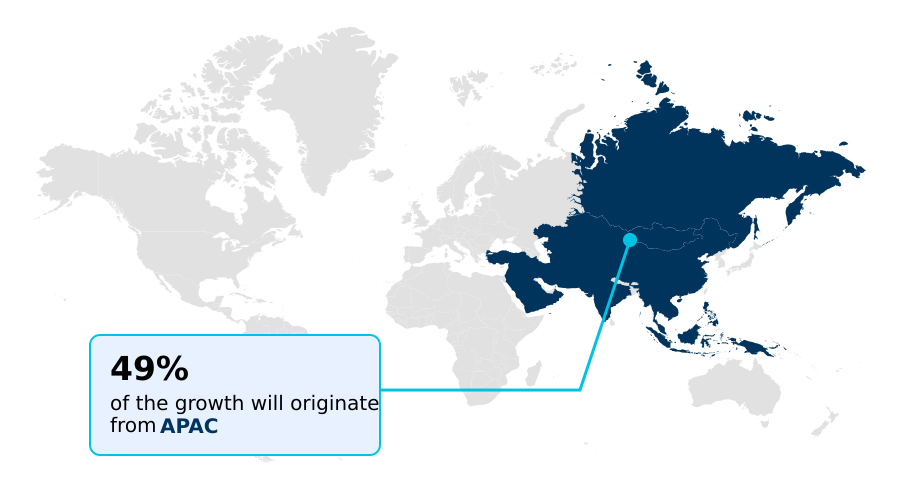
See How Welding Equipment Market Demand is Rising in APAC Request Free Sample

The geographic landscape is dominated by APAC, which accounts for nearly 49% of the market's incremental growth, driven by massive investments in infrastructure and manufacturing.

Countries like China and India are epicenters of structural steel fabrication and heavy-duty welding, fueling demand for high-deposition welding technologies.

In contrast, North America and Europe focus on high-value applications, pioneering developments in robotic welding and industrial automation to offset high labor costs.

The adoption of automated systems in these regions has demonstrated an ability to improve weld consistency by over 95%.

This focus on high-tech solutions supports key sectors like aerospace and automotive, where high-precision joining and zero-defect production are essential for global competitiveness.

Market Dynamics

Our researchers analyzed the data with 2025 as the base year, along with the key drivers, trends, and challenges. A holistic analysis of drivers will help companies refine their marketing strategies to gain a competitive advantage.

  • The strategic adoption of advanced joining technologies is critical for industrial competitiveness across various sectors. For instance, the successful implementation of automated welding for electric vehicle batteries is a key enabler for the automotive industry's transition, while the precision of laser welding for medical devices ensures product safety and reliability.
  • In heavy industry, the focus is on enhancing productivity through solutions like robotic welding for heavy machinery and submerged arc welding for wind turbines. The rise of AI in predictive weld quality control is revolutionizing manufacturing by minimizing defects.
  • Similarly, the deployment of cobots for small and medium enterprises democratizes automation, boosting efficiency where the robotic vs manual welding productivity gap is most felt. For specialized applications, high-precision welding for aerospace components and friction stir welding for aluminum alloys are becoming standard.
  • Key industry challenges, such as the challenges in welding high-strength steel and the need for preventing hydrogen embrittlement in pipelines, are being addressed by advanced power sources for pipeline welding and new TIG welding techniques for thin metals. The market also sees strong interest in eco-friendly welding fume extraction systems and inverter technology for energy efficient welding.
  • From a practical standpoint, a handheld laser welding equipment review often highlights versatility, while portable welders for on-site repair underscore field serviceability. The analysis of welding automation return on investment and the use of a digital twin for welding process optimization are now standard boardroom discussions.
  • Ultimately, the effectiveness of resistance welding for automotive assembly underscores the importance of process-specific solutions.

What are the key market drivers leading to the rise in the adoption of Welding Equipment Industry?

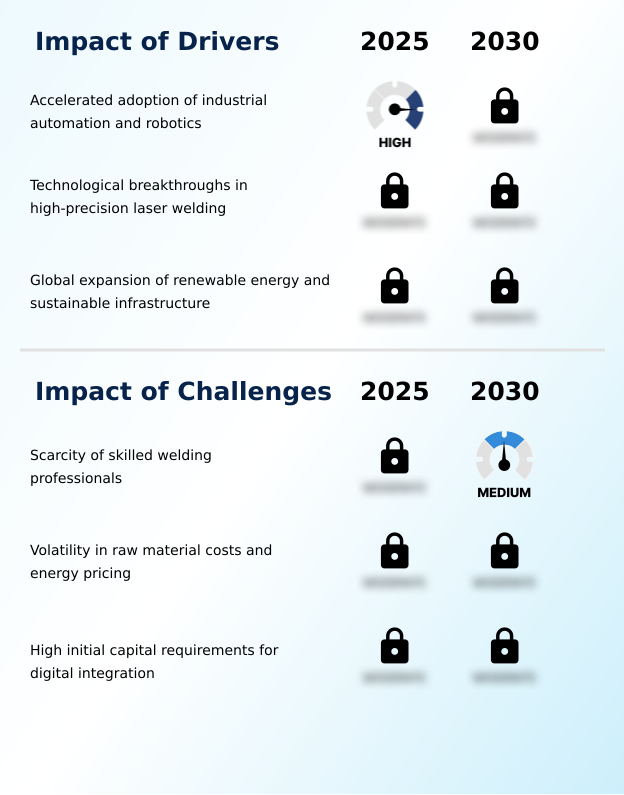
  • The accelerated adoption of industrial automation and robotics is a key driver for the market, addressing labor shortages and boosting production efficiency.

  • Market growth is primarily driven by the accelerated adoption of industrial automation and robotics, which addresses labor shortages and boosts output. For example, deploying robotic welding cells can increase production throughput by over 200% in high-volume manufacturing settings.
  • Technological breakthroughs in high-precision laser welding are also a significant driver, with modern fiber laser systems reducing heat-induced distortion by up to 70% in thin materials, which is critical for EV battery and medical device manufacturing.
  • Additionally, the global expansion of renewable energy infrastructure, such as offshore wind turbines, creates sustained demand for heavy-duty welding processes like submerged arc welding and high-deposition welding techniques capable of joining thick structural plates.

What are the market trends shaping the Welding Equipment Industry?

  • The advancement of artificial intelligence for predictive weld quality control is an emerging market trend. This technology enables real-time monitoring and autonomous adjustments to ensure structural integrity.

  • Key trends are reshaping the market, led by the integration of AI for predictive weld quality, which enables systems to autonomously correct parameters and has been shown to reduce post-weld inspection costs by up to 40%.
  • The widespread adoption of cobots is making welding automation accessible to smaller enterprises, with some users reporting a 20% increase in overall shop floor productivity. This trend is complemented by the expansion of eco-friendly welding solutions. The use of high-efficiency particulate air filtration in fume extraction systems is becoming a standard safety requirement.
  • Furthermore, the shift to inverter-based systems with high-frequency switching technology can lower energy consumption by 30% compared to legacy equipment, aligning with sustainability goals and reducing operational expenditures.

What challenges does the Welding Equipment Industry face during its growth?

  • A scarcity of skilled welding professionals presents a key challenge to industry growth, constraining the full utilization of advanced manufacturing technologies.

  • The market faces significant challenges, primarily a scarcity of skilled welding professionals, which constrains productivity and slows the adoption of advanced technology. Another key restraint is the high initial capital requirement for digital integration, which can delay return on investment by up to three years for small and medium-sized enterprises.
  • This high cost often prevents them from acquiring state-of-the-art robotic systems or implementing software-defined welding platforms. Furthermore, volatility in raw material costs, such as copper and steel, can increase manufacturing expenses by as much as 15% in a single quarter, creating unpredictable financial pressure on both equipment makers and end-users.

Exclusive Technavio Analysis on Customer Landscape

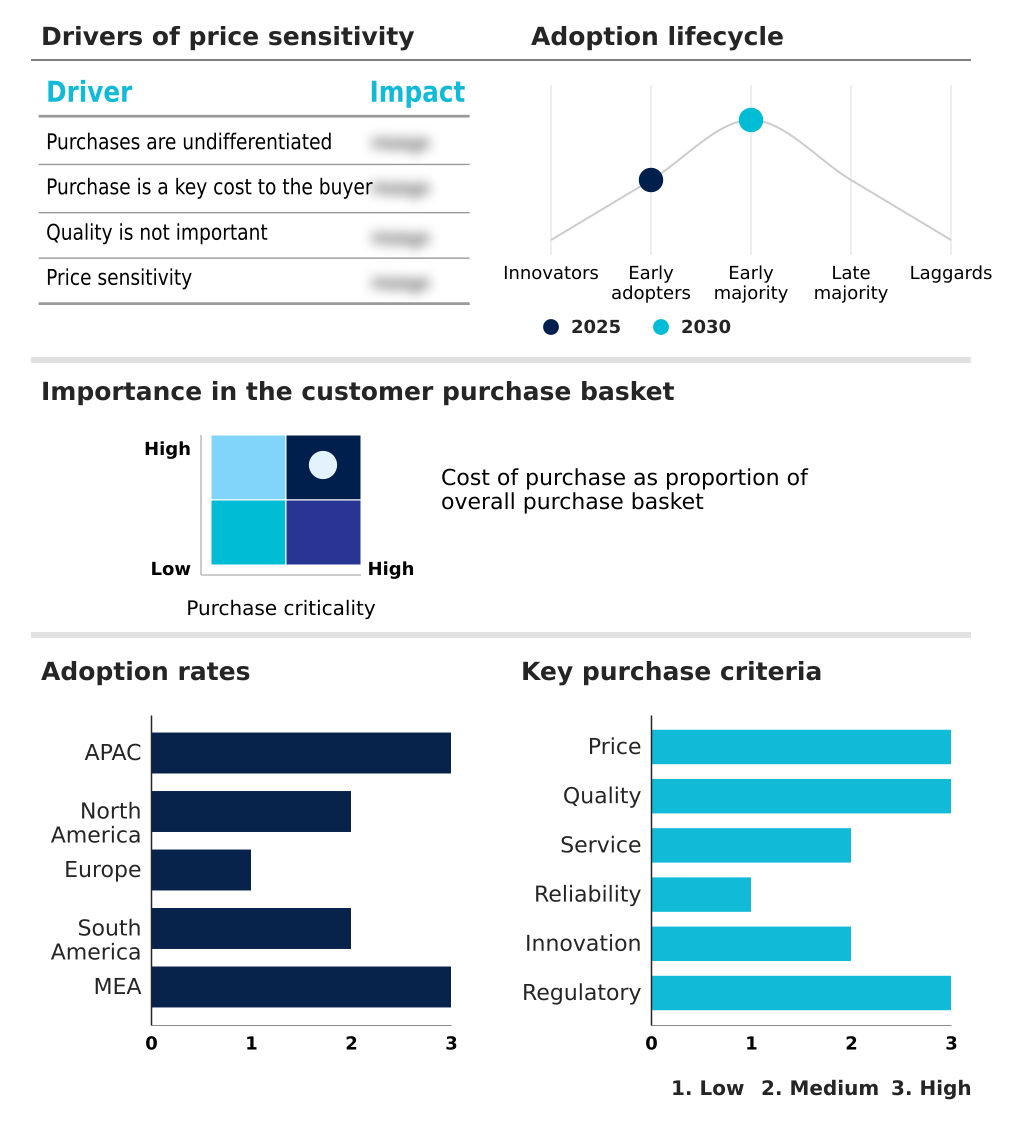
The welding equipment market forecasting report includes the adoption lifecycle of the market, covering from the innovator’s stage to the laggard’s stage. It focuses on adoption rates in different regions based on penetration. Furthermore, the welding equipment market report also includes key purchase criteria and drivers of price sensitivity to help companies evaluate and develop their market growth analysis strategies.

Customer Landscape of Welding Equipment Industry

Competitive Landscape

Companies are implementing various strategies, such as strategic alliances, welding equipment market forecast, partnerships, mergers and acquisitions, geographical expansion, and product/service launches, to enhance their presence in the industry.

AMADA WELD TECH Inc. - Core offerings encompass a spectrum of advanced arc, laser, and resistance welding systems designed for industrial manufacturing and fabrication applications.

The industry research and growth report includes detailed analyses of the competitive landscape of the market and information about key companies, including:

  • AMADA WELD TECH Inc.
  • Carl Cloos Schweibtechnik GmbH
  • Coherent Corp.
  • Daihen Corp.
  • ESAB Corp.
  • EWM AG
  • Fronius International GmbH
  • Hypertherm Inc.
  • IPG Photonics Corp.
  • Kemppi Oy
  • Lorch Schweibtechnik GmbH
  • MEGMEET Welding Technology Co.
  • Miller Electric Mfg. LLC
  • Panasonic Holdings Corp.
  • Polysoude SAS
  • The Lincoln Electric Co.
  • TRUMPF SE Co. KG
  • voestalpine AG
  • Weld Tooling Corp

Qualitative and quantitative analysis of companies has been conducted to help clients understand the wider business environment as well as the strengths and weaknesses of key industry players. Data is qualitatively analyzed to categorize companies as pure play, category-focused, industry-focused, and diversified; it is quantitatively analyzed to categorize companies as dominant, leading, strong, tentative, and weak.

Recent Development and News in Welding equipment market

  • In March, 2025, The Lincoln Electric Company unveiled its proprietary WeldVision AI platform, which utilizes deep learning algorithms to provide a ninety-nine percent accuracy rate in detecting discontinuities during high-speed robotic applications.
  • In August, 2025, ESAB Corporation launched the Cobot-Go series, a portable collaborative welding system that permits operators to program complex seam paths using a simple hand-guided interface and a mobile application.
  • In May, 2025, Yaskawa Electric Corporation launched the Motoman AR3120, a specialized long-reach arc welding robot designed to handle the fabrication of large structural components with enhanced path accuracy.
  • In June, 2025, the American Welding Society launched a new global certification standard specifically designed for cobot operators to address the lack of standardized training for collaborative robotic welding systems.

Dive into Technavio’s robust research methodology, blending expert interviews, extensive data synthesis, and validated models for unparalleled Welding Equipment Market insights. See full methodology.

Market Scope
Page number 307
Base year 2025
Historic period 2020-2024
Forecast period 2026-2030
Growth momentum & CAGR Accelerate at a CAGR of 6.3%
Market growth 2026-2030 USD 5479.2 million
Market structure Fragmented
YoY growth 2025-2026(%) 6.0%
Key countries China, Japan, India, South Korea, Indonesia, Australia, US, Canada, Mexico, Germany, France, UK, Italy, Spain, The Netherlands, Brazil, Argentina, Chile, Saudi Arabia, UAE, South Africa, Turkey and Israel
Competitive landscape Leading Companies, Market Positioning of Companies, Competitive Strategies, and Industry Risks

Request Free Sample

Research Analyst Overview

  • The welding equipment market is defined by a technological shift from traditional methods to advanced, digitally integrated systems. Core processes like arc welding, TIG welding, and MIG/MAG welding are being enhanced with inverter welding machines and sophisticated welding power sources that offer greater control and efficiency.
  • The primary driver of innovation is the widespread adoption of welding automation, including robotic welding, robotic arc welding, and collaborative cobots, which address labor shortages and increase productivity in automated welding cells. Specialized technologies such as resistance welding, particularly resistance spot welding with servo-driven actuators, dominate automotive manufacturing.
  • In high-value sectors, laser beam welding, friction stir welding, and electron beam welding provide unparalleled precision. The market for support equipment is also growing, with a focus on advanced fume extraction systems, high-quality welding consumables, and precise shielding gas controllers. Key equipment includes welding torches, orbital welding systems, multi-process welders, and welding positioners.
  • For heavy fabrication, submerged arc welding and plasma cutting remain essential. The integration of weld quality control and weld monitoring systems, coupled with non-destructive testing, is becoming standard. In one notable application, a heavy machinery manufacturer achieved a 30% reduction in production cycle times by transitioning to a fully automated workflow incorporating high-frequency induction welding and custom weld tooling fixtures.

What are the Key Data Covered in this Welding Equipment Market Research and Growth Report?

  • What is the expected growth of the Welding Equipment Market between 2026 and 2030?

    • USD 5.48 billion, at a CAGR of 6.3%

  • What segmentation does the market report cover?

    • The report is segmented by End-user (Automotive, Construction, Aerospace and defense, Shipbuilding, and Others), Technology (Arc welding, Resistance welding, Laser beam welding, and Oxy-fuel welding), Product Type (Automatic, Semi-automatic, and Manual) and Geography (APAC, North America, Europe, South America, Middle East and Africa)

  • Which regions are analyzed in the report?

    • APAC, North America, Europe, South America and Middle East and Africa

  • What are the key growth drivers and market challenges?

    • Accelerated adoption of industrial automation and robotics, Scarcity of skilled welding professionals

  • Who are the major players in the Welding Equipment Market?

    • AMADA WELD TECH Inc., Carl Cloos Schweibtechnik GmbH, Coherent Corp., Daihen Corp., ESAB Corp., EWM AG, Fronius International GmbH, Hypertherm Inc., IPG Photonics Corp., Kemppi Oy, Lorch Schweibtechnik GmbH, MEGMEET Welding Technology Co., Miller Electric Mfg. LLC, Panasonic Holdings Corp., Polysoude SAS, The Lincoln Electric Co., TRUMPF SE Co. KG, voestalpine AG and Weld Tooling Corp

Market Research Insights

  • Market dynamics are shaped by a strong push toward smart factory integration, where operational efficiency is paramount. The adoption of real-time data analytics for process optimization has been shown to improve first-pass weld quality by up to 15%, directly reducing material waste and rework costs.
  • Concurrently, implementing predictive maintenance protocols, informed by data from connected equipment, can lower unplanned downtime by over 25%. This focus on data-driven improvement is critical for heavy industrial fabrication and managing complex multi-pass welds.
  • Furthermore, the emphasis on supply chain localization is compelling manufacturers to invest in flexible automation solutions that enhance productivity and enable zero-defect manufacturing, aligning with the need for high-strength steel fabrication in critical infrastructure projects.

We can help! Our analysts can customize this welding equipment market research report to meet your requirements.

Get in touch

1. Executive Summary

1.1 Market overview

Executive Summary - Chart on Market Overview
Executive Summary - Data Table on Market Overview
Executive Summary - Chart on Global Market Characteristics
Executive Summary - Chart on Market by Geography
Executive Summary - Chart on Market Segmentation by End-user
Executive Summary - Chart on Market Segmentation by Technology
Executive Summary - Chart on Market Segmentation by Product Type
Executive Summary - Chart on Incremental Growth
Executive Summary - Data Table on Incremental Growth
Executive Summary - Chart on Company Market Positioning

2. Technavio Analysis

2.1 Analysis of price sensitivity, lifecycle, customer purchase basket, adoption rates, and purchase criteria

2.2 Criticality of inputs and Factors of differentiation

Chart on Overview on criticality of inputs and factors of differentiation

2.3 Factors of disruption

Chart on Overview on factors of disruption

2.4 Impact of drivers and challenges

Chart on Impact of drivers and challenges in 2025 and 2030

3. Market Landscape

3.1 Market ecosystem

Chart on Parent Market
Data Table on - Parent Market

3.2 Market characteristics

Chart on Market characteristics analysis

3.3 Value chain analysis

Chart on Value chain analysis

4. Market Sizing

4.1 Market definition

Data Table on Offerings of companies included in the market definition

4.2 Market segment analysis

Market segments

4.3 Market size 2025

4.4 Market outlook: Forecast for 2025-2030

Chart on Global - Market size and forecast 2025-2030 ($ million)
Data Table on Global - Market size and forecast 2025-2030 ($ million)
Chart on Global Market: Year-over-year growth 2025-2030 (%)
Data Table on Global Market: Year-over-year growth 2025-2030 (%)

5. Historic Market Size

5.1 Global Welding Equipment Market 2020 - 2024

Historic Market Size - Data Table on Global Welding Equipment Market 2020 - 2024 ($ million)

5.2 End-user segment analysis 2020 - 2024

Historic Market Size - End-user Segment 2020 - 2024 ($ million)

5.3 Technology segment analysis 2020 - 2024

Historic Market Size - Technology Segment 2020 - 2024 ($ million)

5.4 Product Type segment analysis 2020 - 2024

Historic Market Size - Product Type Segment 2020 - 2024 ($ million)

5.5 Geography segment analysis 2020 - 2024

Historic Market Size - Geography Segment 2020 - 2024 ($ million)

5.6 Country segment analysis 2020 - 2024

Historic Market Size - Country Segment 2020 - 2024 ($ million)

6. Qualitative Analysis

6.1 Impact of AI on Global Welding Equipment Market

6.2 Impact of Geopolitical Conflict on Global Welding Equipment Market

7. Five Forces Analysis

7.1 Five forces summary

Five forces analysis - Comparison between 2025 and 2030

7.2 Bargaining power of buyers

Bargaining power of buyers - Impact of key factors 2025 and 2030

7.3 Bargaining power of suppliers

Bargaining power of suppliers - Impact of key factors in 2025 and 2030

7.4 Threat of new entrants

Threat of new entrants - Impact of key factors in 2025 and 2030

7.5 Threat of substitutes

Threat of substitutes - Impact of key factors in 2025 and 2030

7.6 Threat of rivalry

Threat of rivalry - Impact of key factors in 2025 and 2030

7.7 Market condition

Chart on Market condition - Five forces 2025 and 2030

8. Market Segmentation by End-user

8.1 Market segments

Chart on End-user - Market share 2025-2030 (%)
Data Table on End-user - Market share 2025-2030 (%)

8.2 Comparison by End-user

Chart on Comparison by End-user
Data Table on Comparison by End-user

8.3 Automotive - Market size and forecast 2025-2030

Chart on Automotive - Market size and forecast 2025-2030 ($ million)
Data Table on Automotive - Market size and forecast 2025-2030 ($ million)
Chart on Automotive - Year-over-year growth 2025-2030 (%)
Data Table on Automotive - Year-over-year growth 2025-2030 (%)

8.4 Construction - Market size and forecast 2025-2030

Chart on Construction - Market size and forecast 2025-2030 ($ million)
Data Table on Construction - Market size and forecast 2025-2030 ($ million)
Chart on Construction - Year-over-year growth 2025-2030 (%)
Data Table on Construction - Year-over-year growth 2025-2030 (%)

8.5 Aerospace and defense - Market size and forecast 2025-2030

Chart on Aerospace and defense - Market size and forecast 2025-2030 ($ million)
Data Table on Aerospace and defense - Market size and forecast 2025-2030 ($ million)
Chart on Aerospace and defense - Year-over-year growth 2025-2030 (%)
Data Table on Aerospace and defense - Year-over-year growth 2025-2030 (%)

8.6 Shipbuilding - Market size and forecast 2025-2030

Chart on Shipbuilding - Market size and forecast 2025-2030 ($ million)
Data Table on Shipbuilding - Market size and forecast 2025-2030 ($ million)
Chart on Shipbuilding - Year-over-year growth 2025-2030 (%)
Data Table on Shipbuilding - Year-over-year growth 2025-2030 (%)

8.7 Others - Market size and forecast 2025-2030

Chart on Others - Market size and forecast 2025-2030 ($ million)
Data Table on Others - Market size and forecast 2025-2030 ($ million)
Chart on Others - Year-over-year growth 2025-2030 (%)
Data Table on Others - Year-over-year growth 2025-2030 (%)

8.8 Market opportunity by End-user

Market opportunity by End-user ($ million)
Data Table on Market opportunity by End-user ($ million)

9. Market Segmentation by Technology

9.1 Market segments

Chart on Technology - Market share 2025-2030 (%)
Data Table on Technology - Market share 2025-2030 (%)

9.2 Comparison by Technology

Chart on Comparison by Technology
Data Table on Comparison by Technology

9.3 Arc welding - Market size and forecast 2025-2030

Chart on Arc welding - Market size and forecast 2025-2030 ($ million)
Data Table on Arc welding - Market size and forecast 2025-2030 ($ million)
Chart on Arc welding - Year-over-year growth 2025-2030 (%)
Data Table on Arc welding - Year-over-year growth 2025-2030 (%)

9.4 Resistance welding - Market size and forecast 2025-2030

Chart on Resistance welding - Market size and forecast 2025-2030 ($ million)
Data Table on Resistance welding - Market size and forecast 2025-2030 ($ million)
Chart on Resistance welding - Year-over-year growth 2025-2030 (%)
Data Table on Resistance welding - Year-over-year growth 2025-2030 (%)

9.5 Laser beam welding - Market size and forecast 2025-2030

Chart on Laser beam welding - Market size and forecast 2025-2030 ($ million)
Data Table on Laser beam welding - Market size and forecast 2025-2030 ($ million)
Chart on Laser beam welding - Year-over-year growth 2025-2030 (%)
Data Table on Laser beam welding - Year-over-year growth 2025-2030 (%)

9.6 Oxy-fuel welding - Market size and forecast 2025-2030

Chart on Oxy-fuel welding - Market size and forecast 2025-2030 ($ million)
Data Table on Oxy-fuel welding - Market size and forecast 2025-2030 ($ million)
Chart on Oxy-fuel welding - Year-over-year growth 2025-2030 (%)
Data Table on Oxy-fuel welding - Year-over-year growth 2025-2030 (%)

9.7 Market opportunity by Technology

Market opportunity by Technology ($ million)
Data Table on Market opportunity by Technology ($ million)

10. Market Segmentation by Product Type

10.1 Market segments

Chart on Product Type - Market share 2025-2030 (%)
Data Table on Product Type - Market share 2025-2030 (%)

10.2 Comparison by Product Type

Chart on Comparison by Product Type
Data Table on Comparison by Product Type

10.3 Automatic - Market size and forecast 2025-2030

Chart on Automatic - Market size and forecast 2025-2030 ($ million)
Data Table on Automatic - Market size and forecast 2025-2030 ($ million)
Chart on Automatic - Year-over-year growth 2025-2030 (%)
Data Table on Automatic - Year-over-year growth 2025-2030 (%)

10.4 Semi-automatic - Market size and forecast 2025-2030

Chart on Semi-automatic - Market size and forecast 2025-2030 ($ million)
Data Table on Semi-automatic - Market size and forecast 2025-2030 ($ million)
Chart on Semi-automatic - Year-over-year growth 2025-2030 (%)
Data Table on Semi-automatic - Year-over-year growth 2025-2030 (%)

10.5 Manual - Market size and forecast 2025-2030

Chart on Manual - Market size and forecast 2025-2030 ($ million)
Data Table on Manual - Market size and forecast 2025-2030 ($ million)
Chart on Manual - Year-over-year growth 2025-2030 (%)
Data Table on Manual - Year-over-year growth 2025-2030 (%)

10.6 Market opportunity by Product Type

Market opportunity by Product Type ($ million)
Data Table on Market opportunity by Product Type ($ million)

11. Customer Landscape

11.1 Customer landscape overview

Analysis of price sensitivity, lifecycle, customer purchase basket, adoption rates, and purchase criteria

12. Geographic Landscape

12.1 Geographic segmentation

Chart on Market share by geography 2025-2030 (%)
Data Table on Market share by geography 2025-2030 (%)

12.2 Geographic comparison

Chart on Geographic comparison
Data Table on Geographic comparison

12.3 APAC - Market size and forecast 2025-2030

Chart on APAC - Market size and forecast 2025-2030 ($ million)
Data Table on APAC - Market size and forecast 2025-2030 ($ million)
Chart on APAC - Year-over-year growth 2025-2030 (%)
Data Table on APAC - Year-over-year growth 2025-2030 (%)
Chart on Regional Comparison - APAC
Data Table on Regional Comparison - APAC

12.3.1 China - Market size and forecast 2025-2030

Chart on China - Market size and forecast 2025-2030 ($ million)
Data Table on China - Market size and forecast 2025-2030 ($ million)
Chart on China - Year-over-year growth 2025-2030 (%)
Data Table on China - Year-over-year growth 2025-2030 (%)

12.3.2 Japan - Market size and forecast 2025-2030

Chart on Japan - Market size and forecast 2025-2030 ($ million)
Data Table on Japan - Market size and forecast 2025-2030 ($ million)
Chart on Japan - Year-over-year growth 2025-2030 (%)
Data Table on Japan - Year-over-year growth 2025-2030 (%)

12.3.3 India - Market size and forecast 2025-2030

Chart on India - Market size and forecast 2025-2030 ($ million)
Data Table on India - Market size and forecast 2025-2030 ($ million)
Chart on India - Year-over-year growth 2025-2030 (%)
Data Table on India - Year-over-year growth 2025-2030 (%)

12.3.4 South Korea - Market size and forecast 2025-2030

Chart on South Korea - Market size and forecast 2025-2030 ($ million)
Data Table on South Korea - Market size and forecast 2025-2030 ($ million)
Chart on South Korea - Year-over-year growth 2025-2030 (%)
Data Table on South Korea - Year-over-year growth 2025-2030 (%)

12.3.5 Indonesia - Market size and forecast 2025-2030

Chart on Indonesia - Market size and forecast 2025-2030 ($ million)
Data Table on Indonesia - Market size and forecast 2025-2030 ($ million)
Chart on Indonesia - Year-over-year growth 2025-2030 (%)
Data Table on Indonesia - Year-over-year growth 2025-2030 (%)

12.3.6 Australia - Market size and forecast 2025-2030

Chart on Australia - Market size and forecast 2025-2030 ($ million)
Data Table on Australia - Market size and forecast 2025-2030 ($ million)
Chart on Australia - Year-over-year growth 2025-2030 (%)
Data Table on Australia - Year-over-year growth 2025-2030 (%)

12.4 North America - Market size and forecast 2025-2030

Chart on North America - Market size and forecast 2025-2030 ($ million)
Data Table on North America - Market size and forecast 2025-2030 ($ million)
Chart on North America - Year-over-year growth 2025-2030 (%)
Data Table on North America - Year-over-year growth 2025-2030 (%)
Chart on Regional Comparison - North America
Data Table on Regional Comparison - North America

12.4.1 US - Market size and forecast 2025-2030

Chart on US - Market size and forecast 2025-2030 ($ million)
Data Table on US - Market size and forecast 2025-2030 ($ million)
Chart on US - Year-over-year growth 2025-2030 (%)
Data Table on US - Year-over-year growth 2025-2030 (%)

12.4.2 Canada - Market size and forecast 2025-2030

Chart on Canada - Market size and forecast 2025-2030 ($ million)
Data Table on Canada - Market size and forecast 2025-2030 ($ million)
Chart on Canada - Year-over-year growth 2025-2030 (%)
Data Table on Canada - Year-over-year growth 2025-2030 (%)

12.4.3 Mexico - Market size and forecast 2025-2030

Chart on Mexico - Market size and forecast 2025-2030 ($ million)
Data Table on Mexico - Market size and forecast 2025-2030 ($ million)
Chart on Mexico - Year-over-year growth 2025-2030 (%)
Data Table on Mexico - Year-over-year growth 2025-2030 (%)

12.5 Europe - Market size and forecast 2025-2030

Chart on Europe - Market size and forecast 2025-2030 ($ million)
Data Table on Europe - Market size and forecast 2025-2030 ($ million)
Chart on Europe - Year-over-year growth 2025-2030 (%)
Data Table on Europe - Year-over-year growth 2025-2030 (%)
Chart on Regional Comparison - Europe
Data Table on Regional Comparison - Europe

12.5.1 Germany - Market size and forecast 2025-2030

Chart on Germany - Market size and forecast 2025-2030 ($ million)
Data Table on Germany - Market size and forecast 2025-2030 ($ million)
Chart on Germany - Year-over-year growth 2025-2030 (%)
Data Table on Germany - Year-over-year growth 2025-2030 (%)

12.5.2 France - Market size and forecast 2025-2030

Chart on France - Market size and forecast 2025-2030 ($ million)
Data Table on France - Market size and forecast 2025-2030 ($ million)
Chart on France - Year-over-year growth 2025-2030 (%)
Data Table on France - Year-over-year growth 2025-2030 (%)

12.5.3 UK - Market size and forecast 2025-2030

Chart on UK - Market size and forecast 2025-2030 ($ million)
Data Table on UK - Market size and forecast 2025-2030 ($ million)
Chart on UK - Year-over-year growth 2025-2030 (%)
Data Table on UK - Year-over-year growth 2025-2030 (%)

12.5.4 Italy - Market size and forecast 2025-2030

Chart on Italy - Market size and forecast 2025-2030 ($ million)
Data Table on Italy - Market size and forecast 2025-2030 ($ million)
Chart on Italy - Year-over-year growth 2025-2030 (%)
Data Table on Italy - Year-over-year growth 2025-2030 (%)

12.5.5 Spain - Market size and forecast 2025-2030

Chart on Spain - Market size and forecast 2025-2030 ($ million)
Data Table on Spain - Market size and forecast 2025-2030 ($ million)
Chart on Spain - Year-over-year growth 2025-2030 (%)
Data Table on Spain - Year-over-year growth 2025-2030 (%)

12.5.6 The Netherlands - Market size and forecast 2025-2030

Chart on The Netherlands - Market size and forecast 2025-2030 ($ million)
Data Table on The Netherlands - Market size and forecast 2025-2030 ($ million)
Chart on The Netherlands - Year-over-year growth 2025-2030 (%)
Data Table on The Netherlands - Year-over-year growth 2025-2030 (%)

12.6 South America - Market size and forecast 2025-2030

Chart on South America - Market size and forecast 2025-2030 ($ million)
Data Table on South America - Market size and forecast 2025-2030 ($ million)
Chart on South America - Year-over-year growth 2025-2030 (%)
Data Table on South America - Year-over-year growth 2025-2030 (%)
Chart on Regional Comparison - South America
Data Table on Regional Comparison - South America

12.6.1 Brazil - Market size and forecast 2025-2030

Chart on Brazil - Market size and forecast 2025-2030 ($ million)
Data Table on Brazil - Market size and forecast 2025-2030 ($ million)
Chart on Brazil - Year-over-year growth 2025-2030 (%)
Data Table on Brazil - Year-over-year growth 2025-2030 (%)

12.6.2 Argentina - Market size and forecast 2025-2030

Chart on Argentina - Market size and forecast 2025-2030 ($ million)
Data Table on Argentina - Market size and forecast 2025-2030 ($ million)
Chart on Argentina - Year-over-year growth 2025-2030 (%)
Data Table on Argentina - Year-over-year growth 2025-2030 (%)

12.6.3 Chile - Market size and forecast 2025-2030

Chart on Chile - Market size and forecast 2025-2030 ($ million)
Data Table on Chile - Market size and forecast 2025-2030 ($ million)
Chart on Chile - Year-over-year growth 2025-2030 (%)
Data Table on Chile - Year-over-year growth 2025-2030 (%)

12.7 Middle East and Africa - Market size and forecast 2025-2030

Chart on Middle East and Africa - Market size and forecast 2025-2030 ($ million)
Data Table on Middle East and Africa - Market size and forecast 2025-2030 ($ million)
Chart on Middle East and Africa - Year-over-year growth 2025-2030 (%)
Data Table on Middle East and Africa - Year-over-year growth 2025-2030 (%)
Chart on Regional Comparison - Middle East and Africa
Data Table on Regional Comparison - Middle East and Africa

12.7.1 Saudi Arabia - Market size and forecast 2025-2030

Chart on Saudi Arabia - Market size and forecast 2025-2030 ($ million)
Data Table on Saudi Arabia - Market size and forecast 2025-2030 ($ million)
Chart on Saudi Arabia - Year-over-year growth 2025-2030 (%)
Data Table on Saudi Arabia - Year-over-year growth 2025-2030 (%)

12.7.2 UAE - Market size and forecast 2025-2030

Chart on UAE - Market size and forecast 2025-2030 ($ million)
Data Table on UAE - Market size and forecast 2025-2030 ($ million)
Chart on UAE - Year-over-year growth 2025-2030 (%)
Data Table on UAE - Year-over-year growth 2025-2030 (%)

12.7.3 South Africa - Market size and forecast 2025-2030

Chart on South Africa - Market size and forecast 2025-2030 ($ million)
Data Table on South Africa - Market size and forecast 2025-2030 ($ million)
Chart on South Africa - Year-over-year growth 2025-2030 (%)
Data Table on South Africa - Year-over-year growth 2025-2030 (%)

12.7.4 Turkey - Market size and forecast 2025-2030

Chart on Turkey - Market size and forecast 2025-2030 ($ million)
Data Table on Turkey - Market size and forecast 2025-2030 ($ million)
Chart on Turkey - Year-over-year growth 2025-2030 (%)
Data Table on Turkey - Year-over-year growth 2025-2030 (%)

12.7.5 Israel - Market size and forecast 2025-2030

Chart on Israel - Market size and forecast 2025-2030 ($ million)
Data Table on Israel - Market size and forecast 2025-2030 ($ million)
Chart on Israel - Year-over-year growth 2025-2030 (%)
Data Table on Israel - Year-over-year growth 2025-2030 (%)

12.8 Market opportunity by geography

Market opportunity by geography ($ million)
Data Tables on Market opportunity by geography ($ million)

13. Drivers, Challenges, and Opportunity

13.1 Market drivers

Accelerated adoption of industrial automation and robotics
Technological breakthroughs in high-precision laser welding
Global expansion of renewable energy and sustainable infrastructure

13.2 Market challenges

Scarcity of skilled welding professionals
Volatility in raw material costs and energy pricing
High initial capital requirements for digital integration

13.3 Impact of drivers and challenges

Impact of drivers and challenges in 2025 and 2030

13.4 Market opportunities

Advancement of AI for predictive weld quality control
Widespread adoption of collaborative robots for enhanced operational flexibility
Expansion of eco-friendly welding solutions and energy-efficient power sources

14. Competitive Landscape

14.1 Overview

14.2

Overview on criticality of inputs and factors of differentiation

14.3 Landscape disruption

Overview on factors of disruption

14.4 Industry risks

Impact of key risks on business

15. Competitive Analysis

15.1 Companies profiled

Companies covered

15.2 Company ranking index

15.3 Market positioning of companies

Matrix on companies position and classification

15.4 AMADA WELD TECH Inc.

AMADA WELD TECH Inc. - Overview
AMADA WELD TECH Inc. - Product / Service
AMADA WELD TECH Inc. - Key offerings
SWOT

15.5 Coherent Corp.

Coherent Corp. - Overview
Coherent Corp. - Business segments
Coherent Corp. - Key offerings
Coherent Corp. - Segment focus
SWOT

15.6 Daihen Corp.

Daihen Corp. - Overview
Daihen Corp. - Business segments
Daihen Corp. - Key offerings
Daihen Corp. - Segment focus
SWOT

15.7 ESAB Corp.

ESAB Corp. - Overview
ESAB Corp. - Product / Service
ESAB Corp. - Key offerings
SWOT

15.8 EWM AG

EWM AG - Overview
EWM AG - Product / Service
EWM AG - Key offerings
SWOT

15.9 Fronius International GmbH

Fronius International GmbH - Overview
Fronius International GmbH - Product / Service
Fronius International GmbH - Key offerings
SWOT

15.10 Hypertherm Inc.

Hypertherm Inc. - Overview
Hypertherm Inc. - Product / Service
Hypertherm Inc. - Key offerings
SWOT

15.11 Kemppi Oy

Kemppi Oy - Overview
Kemppi Oy - Product / Service
Kemppi Oy - Key offerings
SWOT

15.12 Lorch Schweibtechnik GmbH

Lorch Schweibtechnik GmbH - Overview
Lorch Schweibtechnik GmbH - Product / Service
Lorch Schweibtechnik GmbH - Key offerings
SWOT

15.13 MEGMEET Welding Technology Co.

MEGMEET Welding Technology Co. - Overview
MEGMEET Welding Technology Co. - Product / Service
MEGMEET Welding Technology Co. - Key offerings
SWOT

15.14 Miller Electric Mfg. LLC

Miller Electric Mfg. LLC - Overview
Miller Electric Mfg. LLC - Product / Service
Miller Electric Mfg. LLC - Key offerings
SWOT

15.15 Panasonic Holdings Corp.

Panasonic Holdings Corp. - Overview
Panasonic Holdings Corp. - Business segments
Panasonic Holdings Corp. - Key news
Panasonic Holdings Corp. - Key offerings
Panasonic Holdings Corp. - Segment focus
SWOT

15.16 TRUMPF SE Co. KG

TRUMPF SE Co. KG - Overview
TRUMPF SE Co. KG - Product / Service
TRUMPF SE Co. KG - Key offerings
SWOT

15.17 voestalpine AG

voestalpine AG - Overview
voestalpine AG - Business segments
voestalpine AG - Key offerings
voestalpine AG - Segment focus
SWOT

15.18 Weld Tooling Corp

Weld Tooling Corp - Overview
Weld Tooling Corp - Product / Service
Weld Tooling Corp - Key offerings
SWOT

16. Appendix

16.1 Scope of the report

Market definition
Objectives
Notes and caveats

16.2 Inclusions and exclusions checklist

Inclusions checklist
Exclusions checklist

16.3 Currency conversion rates for US$

16.4 Research methodology

16.5 Data procurement

Information sources

16.6 Data validation

16.7 Validation techniques employed for market sizing

16.8 Data synthesis

16.9 360 degree market analysis

16.10 List of abbreviations

Research Methodology

Technavio presents a detailed picture of the market by way of study, synthesis, and summation of data from multiple sources. The analysts have presented the various facets of the market with a particular focus on identifying the key industry influencers. The data thus presented is comprehensive, reliable, and the result of extensive research, both primary and secondary.

INFORMATION SOURCES

Primary sources

  • Manufacturers and suppliers
  • Channel partners
  • Industry experts
  • Strategic decision makers

Secondary sources

  • Industry journals and periodicals
  • Government data
  • Financial reports of key industry players
  • Historical data
  • Press releases

DATA ANALYSIS

Data Synthesis

  • Collation of data
  • Estimation of key figures
  • Analysis of derived insights

Data Validation

  • Triangulation with data models
  • Reference against proprietary databases
  • Corroboration with industry experts

REPORT WRITING

Qualitative

  • Market drivers
  • Market challenges
  • Market trends
  • Five forces analysis

Quantitative

  • Market size and forecast
  • Market segmentation
  • Geographical insights
  • Competitive landscape

Interested in this report?

Get your sample now to see our research methodology and insights!

Download Now

Frequently Asked Questions

Welding Equipment market growth will increase by USD 5479.2 million during 2026-2030.

The Welding Equipment market is expected to grow at a CAGR of 6.3% during 2026-2030.

Welding Equipment market is segmented by End-user (Automotive, Construction, Aerospace and defense, Shipbuilding, Others) Technology (Arc welding, Resistance welding, Laser beam welding, Oxy-fuel welding) Product type (Automatic, Semi-automatic, Manual)

AMADA WELD TECH Inc., Carl Cloos Schweibtechnik GmbH, Coherent Corp., Daihen Corp., ESAB Corp., EWM AG, Fronius International GmbH, Hypertherm Inc., IPG Photonics Corp., Kemppi Oy, Lorch Schweibtechnik GmbH, MEGMEET Welding Technology Co., Miller Electric Mfg. LLC, Panasonic Holdings Corp., Polysoude SAS, The Lincoln Electric Co., TRUMPF SE Co. KG, voestalpine AG, Weld Tooling Corp are a few of the key vendors in the Welding Equipment market.

APAC will register the highest growth rate of 48.8% among the other regions. Therefore, the Welding Equipment market in APAC is expected to garner significant business opportunities for the vendors during the forecast period.

China, Japan, India, South Korea, Indonesia, Australia, US, Canada, Mexico, Germany, France, UK, Italy, Spain, The Netherlands, Brazil, Argentina, Chile, Saudi Arabia, UAE, South Africa, Turkey, Israel

  • Accelerated adoption of industrial automation and robotics is the driving factor this market.

The Welding Equipment market vendors should focus on grabbing business opportunities from the End-user segment as it accounted for the largest market share in the base year.
RIA - Research AI Assistant
Ask RIA