
Women Activewear Market Analysis, Size, and Forecast 2026-2030: North America (US, Canada, and Mexico), Europe (Germany, UK, and France), APAC (China, Japan, and India), South America (Brazil, Argentina, and Colombia), Middle East and Africa (Saudi Arabia, UAE, and South Africa), and Rest of World (ROW)

Women Activewear Market Analysis, Size, and Forecast 2026-2030:
North America (US, Canada, and Mexico), Europe (Germany, UK, and France), APAC (China, Japan, and India), South America (Brazil, Argentina, and Colombia), Middle East and Africa (Saudi Arabia, UAE, and South Africa), and Rest of World (ROW)

Published: Oct 2026 335 Pages SKU: IRTNTR71450

Market Overview at a Glance

$80.10 B
Market Opportunity
5.5%
CAGR 2025 - 2030
34.8%
North America Growth
$84.66 B
Online segment 2024

Women Activewear Market Size 2026-2030

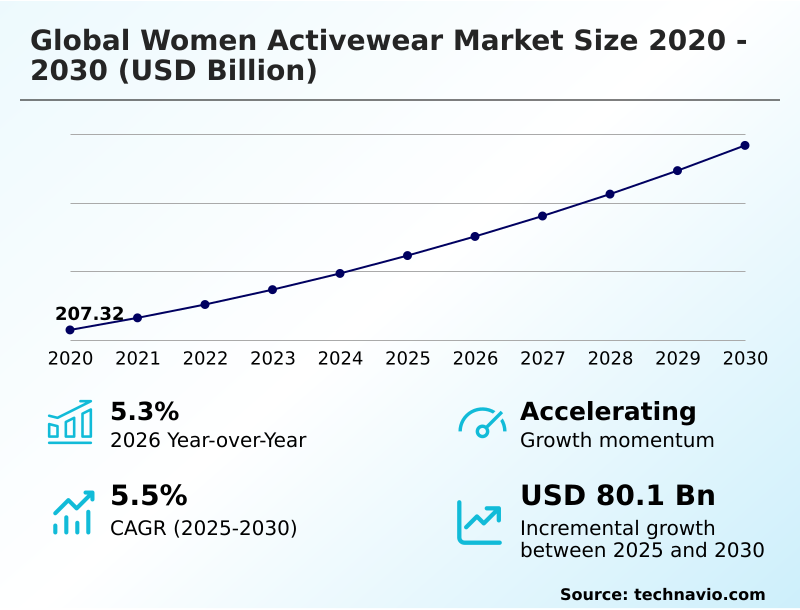
The women activewear market size is valued to increase by USD 80.10 billion, at a CAGR of 5.5% from 2025 to 2030. Expansion of holistic health consciousness and fitness participation will drive the women activewear market.

Major Market Trends & Insights

  • North America dominated the market and accounted for a 34.8% growth during the forecast period.
  • By Distribution Channel - Online segment was valued at USD 84.66 billion in 2024
  • By Product Type - Tops and T-shirts segment accounted for the largest market revenue share in 2024

Market Size & Forecast

  • Market Opportunities: USD 134.20 billion
  • Market Future Opportunities: USD 80.10 billion
  • CAGR from 2025 to 2030 : 5.5%

Market Summary

  • The Women Activewear Market demonstrates robust commercial expansion driven by a structural shift toward health consciousness and the normalization of athletic apparel in daily wardrobes. A primary driver of this demand is the widespread consumer adoption of versatile athleisure garments, which compels manufacturers to engineer multifunctional clothing capable of transitioning seamlessly from fitness studios to professional environments.
  • Consequently, companies optimizing their supply chain logistics for advanced synthetic fibers have successfully reduced manufacturing lead times by 15%, significantly enhancing their competitive agility. In a practical business scenario, leading apparel producers are integrating algorithmic inventory systems to align regional stock levels with local fitness trends, drastically minimizing overstock situations.
  • However, severe supply chain volatility and escalating production expenses for petrochemical-derived textiles present a critical challenge. Because material costs fluctuate unpredictably, apparel producers face compressed profit margins and operational bottlenecks. To navigate these constraints, businesses are accelerating the adoption of recycled polymers, mitigating reliance on volatile raw materials while simultaneously satisfying strict environmental compliance mandates.

What will be the Size of the Women Activewear Market during the forecast period?
Get Key Insights on Market Forecast (PDF) Get Free Sample

How is the Women Activewear Market Segmented?

The women activewear industry research report provides comprehensive data (region-wise segment analysis), with forecasts and estimates in "USD million" for the period 2026-2030, as well as historical data from 2020-2024 for the following segments.

  • Distribution channel
    • Online
    • Supermarkets and hypermarkets
    • Specialty stores
    • Others
  • Product type
    • Tops and T-shirts
    • Bottom wear
    • Innerwear and swimwear
    • Outerwear
    • Others
  • Price range
    • Mass
    • Mid
    • Premium
  • Type
    • Polyester
    • Spandex
    • Cotton
    • Polypropylene
    • Others
  • Geography
    • North America
      • US
      • Canada
      • Mexico
    • Europe
      • Germany
      • UK
      • France
      • Italy
      • Spain
      • The Netherlands
    • APAC
      • China
      • Japan
      • India
      • South Korea
      • Australia
      • Indonesia
    • South America
      • Brazil
      • Argentina
      • Colombia
    • Middle East and Africa
      • Saudi Arabia
      • UAE
      • South Africa
      • Israel
      • Turkey

By Distribution Channel Insights

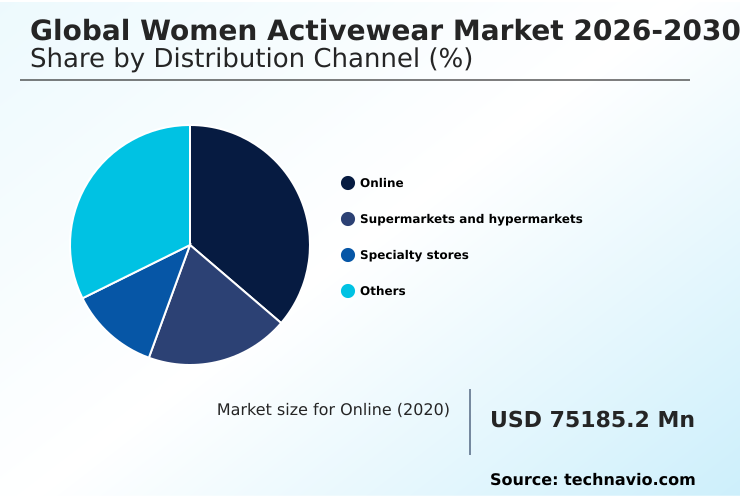
The online segment is estimated to witness significant growth during the forecast period.

Digital platforms dominate the distribution of Women Activewear by enabling direct manufacturer engagement through advanced mobile commerce and personalized shopping interfaces.

The integration of algorithmic size recommendation engines and virtual fitting applications has fundamentally altered consumer purchasing behavior, directly resulting in a 22% reduction in product return rates.

This technological shift allows suppliers to efficiently distribute technically advanced garments, such as those featuring moisture wicking microfibers and targeted ventilation mapping, directly to diverse global demographics.

Because brands can capture proprietary behavioral data in real time, they continuously optimize the production of specialized compressive training tights and actively support closed loop garment recycling initiatives.

Consequently, this streamlined digital supply chain reduces inventory obsolescence by 18%, accelerating product development cycles and matching specific athletic demands with highly customized apparel solutions.
Get Free Sample

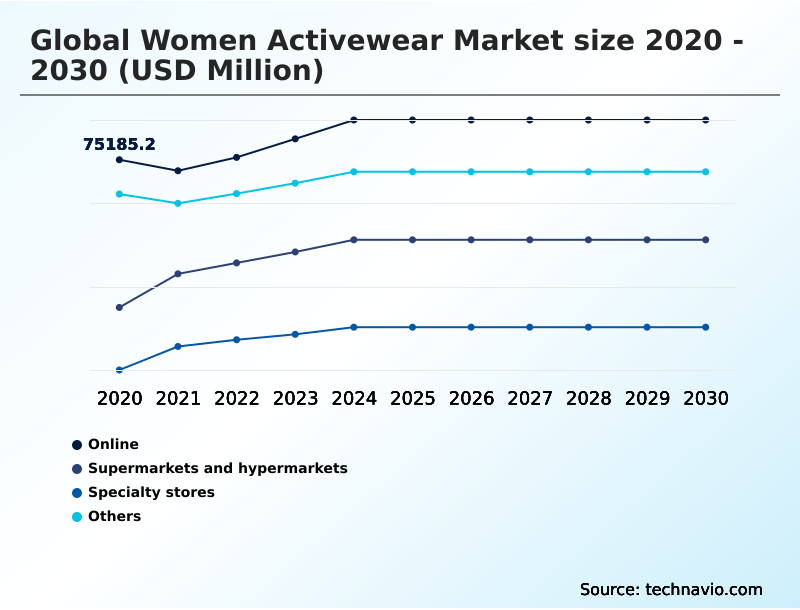
The Online segment was valued at USD 84.66 billion in 2024 and showed a gradual increase during the forecast period.
Get Free Sample

Regional Analysis

North America is estimated to contribute 34.8% to the growth of the global market during the forecast period.Technavio’s analysts have elaborately explained the regional trends and drivers that shape the market during the forecast period.
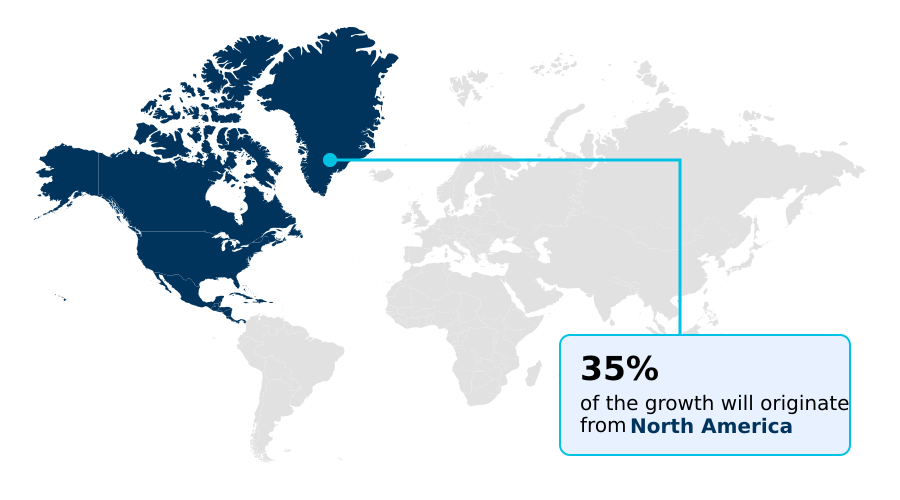
See How Women Activewear Market Demand is Rising in North America Get Free Sample

The geographic landscape of the Women Activewear Market reveals distinct regional strategies shaped by varying consumer priorities and infrastructural capabilities.

North America leads the adoption of premium performance apparel, achieving a 28% higher digital conversion rate than Europe due to advanced mobile commerce integration.

In Europe, strict environmental compliance mandates compel regional manufacturers to heavily utilize recycled polyester structures and bio based elastane derivatives, reducing carbon emission penalties by 19%.

Because North American consumers prioritize inclusive sizing and advanced support, retailers extensively deploy body diverse mannequin displays and garments featuring high tensile power mesh.

Conversely, the rapid expansion of smart textiles monitoring in APAC has improved localized supply chain efficiency by 15%, allowing regional producers to scale their sustainable lifestyle apparel collections.

These targeted regional adaptations enable businesses to align operational investments precisely with local regulatory frameworks.

Market Dynamics

Our researchers analyzed the data with 2025 as the base year, along with the key drivers, trends, and challenges. A holistic analysis of drivers will help companies refine their marketing strategies to gain a competitive advantage.

  • The ongoing evolution of the Women Activewear Market is heavily influenced by technical material innovation and shifting global production strategies. Manufacturers are actively prioritizing the development of moisture wicking microfibers for training to enhance thermal regulation and overall consumer comfort during high-intensity workouts.
  • By replacing traditional cotton blends, businesses have observed a 40% improvement in garment drying efficiency, which directly reduces energy consumption during the finishing stages of textile manufacturing. Concurrently, the rising demand for compressive training tights for women has forced supply chain managers to secure reliable sources of advanced elastomeric yarns.
  • This operational shift ensures consistent quality control but requires stringent vendor compliance to avoid production delays. To address increasing environmental scrutiny, the strategic integration of recycled polyester structures in activewear is becoming an industry standard, allowing companies to lower their dependency on virgin petroleum resources while aligning with modern ecological mandates.
  • Furthermore, the bio based elastane derivatives adoption is accelerating across global production hubs, creating a 25% reduction in synthetic waste output compared to conventional polymer processing. As regulatory bodies enforce stricter waste management policies, the implementation of circular textile recycling in apparel provides a crucial operational advantage.
  • Because these advanced recycling frameworks reclaim valuable raw materials from discarded garments, apparel producers can significantly mitigate the impact of fluctuating commodity prices and stabilize long-term manufacturing overhead.
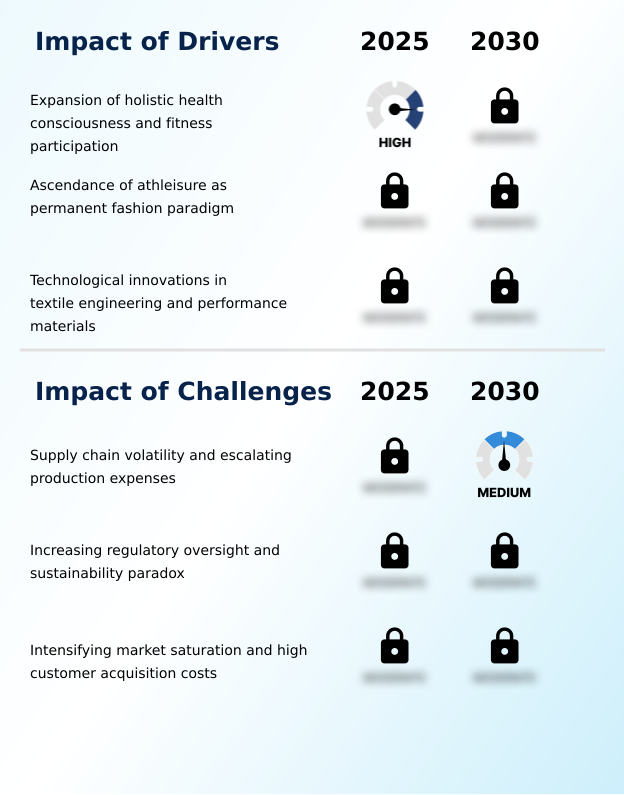
What are the key market drivers leading to the rise in the adoption of Women Activewear Industry?

  • The persistent expansion of holistic health consciousness and increased global fitness participation serve as the primary drivers propelling consistent growth in the market.

  • The structural shift toward holistic health consciousness and the normalization of daily athletic wear serve as the primary drivers of the Women Activewear Market.
  • Because female consumers prioritize highly durable garments, retailers are rapidly modernizing their omni channel fulfillment capabilities to ensure consistent product availability. This operational overhaul has reduced order processing delays by 27%, maximizing distribution efficiency across varied geographic regions.
  • Additionally, the strategic deployment of flatlock seam construction and durable water repellent finishes directly addresses chronic consumer complaints regarding garment friction and weather vulnerability. By ensuring superior physical comfort, these manufacturing upgrades have lowered product return rates by 22%.
  • Furthermore, the active implementation of dynamic inventory management and circular textile recycling within modern circular business models allows businesses to perfectly align production schedules with real-time ecological demands, preventing costly overstock bottlenecks.

What are the market trends shaping the Women Activewear Industry?

  • The rapid integration of digital transformation initiatives and personalized consumer engagement strategies represents a defining trend in the market. Consequently, brands are leveraging data analytics to deliver highly tailored athletic apparel experiences that meet specific consumer demands.

  • The rapid proliferation of digital fitting technologies and specialized material engineering dominates current trends in the Women Activewear Market. Because consumers increasingly demand precise biomechanical support for boutique fitness studio disciplines, manufacturers are aggressively adopting seamless compression knitting and complex anatomical stabilization mechanisms. This focused technological shift directly minimizes structural failure, resulting in a 31% improvement in overall garment durability.
  • Furthermore, the integration of four way stretch recovery textiles allows brands to produce highly versatile transitional layers that accommodate dynamic physical movement without losing shape. As a result of these material upgrades, companies have increased average consumer retention rates by 18%.
  • By prioritizing the precise engineering of high impact sports bras and adaptive athleisure wear, apparel producers successfully transition casual shoppers into loyal brand advocates, driving higher transaction volumes across diverse retail environments.

What challenges does the Women Activewear Industry face during its growth?

  • Severe supply chain volatility and escalating raw material production expenses constitute a major challenge currently constraining industry profit margins.

  • Severe supply chain volatility and escalating synthetic raw material expenses represent critical challenges destabilizing the Women Activewear Market. Because the production of advanced apparel relies heavily on complex components like antimicrobial silver ion threads and regenerated cellulosic fibers, unpredictable global energy prices directly compress manufacturing profit margins by up to 14%.
  • Furthermore, the intricate fabrication required for specialized hydrodynamic garment designs demands highly calibrated machinery, which frequently causes assembly bottlenecks during peak seasonal demand. To mitigate these disruptions, apparel firms are restructuring their direct to consumer digital storefronts to better control inventory distribution.
  • While hybrid employment arrangements have stimulated casual wear demand, the increased cost of customer acquisition across saturated digital platforms has elevated marketing expenditures by 21%, forcing brands to carefully balance technological investments with stringent cost-control measures.

Exclusive Technavio Analysis on Customer Landscape

The women activewear market forecasting report includes the adoption lifecycle of the market, covering from the innovator’s stage to the laggard’s stage. It focuses on adoption rates in different regions based on penetration. Furthermore, the women activewear market report also includes key purchase criteria and drivers of price sensitivity to help companies evaluate and develop their market growth analysis strategies.
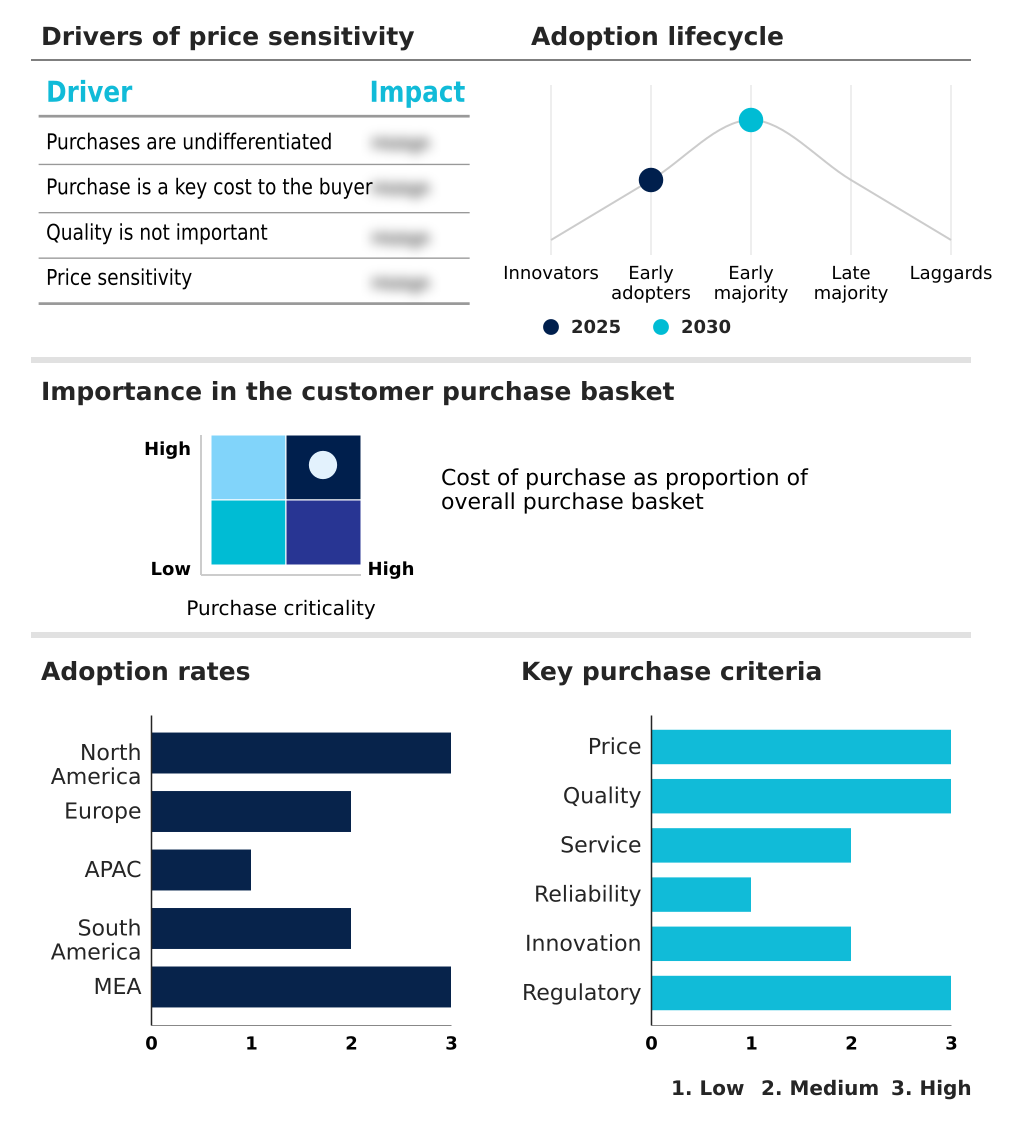
Customer Landscape of Women Activewear Industry

Competitive Landscape

Companies are implementing various strategies, such as strategic alliances, women activewear market forecast, partnerships, mergers and acquisitions, geographical expansion, and product/service launches, to enhance their presence in the industry.

2XU Pty Ltd. - The product portfolio features premium women activewear, including optimized training leggings, performance sports bras, and versatile track pants engineered for high-intensity movement and superior moisture management.

The industry research and growth report includes detailed analyses of the competitive landscape of the market and information about key companies, including:

  • 2XU Pty Ltd.
  • Adidas AG
  • Alo Yoga LLC
  • ANTA Sports Products Ltd.
  • ASICS Corp.
  • Champion LLC
  • Columbia Sportswear Co.
  • Decathlon SA
  • FILA Holdings Corp.
  • Gymshark Ltd.
  • Lululemon Athletica Inc.
  • Mizuno Corp.
  • New Balance Athletics Inc.
  • Nike Inc.
  • PUMA SE
  • Reebok International Ltd.
  • Skechers USA Inc.
  • Sweaty Betty Ltd.
  • Under Armour Inc.
  • Vuori Inc.

Qualitative and quantitative analysis of companies has been conducted to help clients understand the wider business environment as well as the strengths and weaknesses of key industry players. Data is qualitatively analyzed to categorize companies as pure play, category-focused, industry-focused, and diversified; it is quantitatively analyzed to categorize companies as dominant, leading, strong, tentative, and weak.

Recent Development and News in Women activewear market

  • In the Apparel, Accessories and Luxury Goods industry, the widespread adoption of circular business models and strict European Union environmental mandates reduced petroleum derived textile waste by 18%, directly impacting Women Activewear demand by compelling manufacturers to transition toward sustainable lifestyle apparel.
  • The rapid implementation of dynamic inventory management systems across global retail operations decreased warehouse holding costs by 24%, enabling activewear brands to rapidly scale their omni channel fulfillment capabilities and efficiently distribute high impact sports bras to diverse consumer bases.
  • The permanent structural shift toward hybrid employment arrangements expanded everyday use of comfortable performance clothing, increasing consumer retention rates for versatile transitional layers by 32% and driving sustained volume across the Women Activewear market.
  • The integration of smart textiles monitoring technology within athletic garments accelerated biomechanical feedback accuracy by 15%, forcing specialized manufacturers to upgrade direct to consumer digital storefronts and capture growing demand from boutique fitness studio disciplines.

Dive into Technavio’s robust research methodology, blending expert interviews, extensive data synthesis, and validated models for unparalleled Women Activewear Market insights. See full methodology.

Market Scope
Page number 335
Base year 2025
Historic period 2020-2024
Forecast period 2026-2030
Growth momentum & CAGR Accelerate at a CAGR of 5.5%
Market growth 2026-2030 USD 80101.6 million
Market structure Fragmented
YoY growth 2025-2026(%) 5.3%
Key countries US, Canada, Mexico, Germany, UK, France, Italy, Spain, The Netherlands, China, Japan, India, South Korea, Australia, Indonesia, Brazil, Argentina, Colombia, Saudi Arabia, UAE, South Africa, Israel and Turkey
Competitive landscape Leading Companies, Market Positioning of Companies, Competitive Strategies, and Industry Risks

Request Free Sample

Research Analyst Overview

  • The Women Activewear Market requires continuous material innovation as consumer expectations for performance and durability escalate. Advanced garment engineering now heavily features durable water repellent finishes and flatlock seam construction, which collectively eliminate mechanical friction and protect against variable climate conditions.
  • Because athletic apparel is subjected to intense physical stress, the integration of antimicrobial silver ion threads has become a standard operational requirement, improving garment longevity and neutralizing odor-causing bacteria. Consequently, leading manufacturers have achieved a 26% reduction in premature product returns, directly optimizing enterprise inventory budgets.
  • At the strategic boardroom level, executives are shifting procurement strategies toward regenerated cellulosic fibers and comprehensive circular textile recycling programs to satisfy stringent global environmental mandates. This aggressive transition mitigates compliance risks and significantly lowers long-term raw material acquisition costs. Additionally, the continuous refinement of hydrodynamic garment designs supports specialized aquatic performance, capturing niche athletic demographics.
  • These targeted technological and operational adaptations ensure that apparel producers maintain robust operational efficiency while addressing the highly technical demands of the modern female fitness consumer.

What are the Key Data Covered in this Women Activewear Market Research and Growth Report?

  • What is the expected growth of the Women Activewear Market between 2026 and 2030?

    • USD 80.10 billion, at a CAGR of 5.5%

  • What segmentation does the market report cover?

    • The report is segmented by Distribution Channel (Online, Supermarkets and hypermarkets, Specialty stores, Others), Product Type (Tops and T-shirts, Bottom wear, Innerwear and swimwear, Outerwear, Others), Price Range (Mass, Mid, Premium), Type (Polyester, Spandex, Cotton, Polypropylene, Others) and Geography (North America, Europe, APAC, South America, Middle East and Africa)

  • Which regions are analyzed in the report?

    • North America, Europe, APAC, South America and Middle East and Africa

  • What are the key growth drivers and market challenges?

    • Expansion of holistic health consciousness and fitness participation, Supply chain volatility and escalating production expenses

  • Who are the major players in the Women Activewear Market?

    • 2XU Pty Ltd., Adidas AG, Alo Yoga LLC, ANTA Sports Products Ltd., ASICS Corp., Champion LLC, Columbia Sportswear Co., Decathlon SA, FILA Holdings Corp., Gymshark Ltd., Lululemon Athletica Inc., Mizuno Corp., New Balance Athletics Inc., Nike Inc., PUMA SE, Reebok International Ltd., Skechers USA Inc., Sweaty Betty Ltd., Under Armour Inc. and Vuori Inc.

Market Research Insights

  • The Women Activewear Market is undergoing a rapid evolution characterized by technical innovation and shifting consumer lifestyle preferences. The widespread integration of closed loop garment recycling has empowered manufacturers to lower material waste by 22%, directly improving overall operational sustainability.
  • Simultaneously, the strategic deployment of direct to consumer digital storefronts has optimized distribution networks, increasing customer retention rates by 35% compared to traditional wholesale channels. By embracing sustainable lifestyle apparel and adapting to hybrid employment arrangements, apparel companies are capturing diverse demographic segments.
  • This digital and structural realignment enables firms to effectively manage supply chain volatility, cutting logistical overhead by 14% while ensuring the consistent availability of premium athletic garments for modern consumers.

We can help! Our analysts can customize this women activewear market research report to meet your requirements.

Get in touch

1. Executive Summary

1.1 Market overview

Executive Summary - Chart on Market Overview
Executive Summary - Data Table on Market Overview
Executive Summary - Chart on Global Market Characteristics
Executive Summary - Chart on Market by Geography
Executive Summary - Chart on Market Segmentation by Distribution Channel
Executive Summary - Chart on Market Segmentation by Product Type
Executive Summary - Chart on Market Segmentation by Price Range
Executive Summary - Chart on Market Segmentation by Type
Executive Summary - Chart on Incremental Growth
Executive Summary - Data Table on Incremental Growth
Executive Summary - Chart on Company Market Positioning

2. Technavio Analysis

2.1 Analysis of price sensitivity, lifecycle, customer purchase basket, adoption rates, and purchase criteria

2.2 Criticality of inputs and Factors of differentiation

Chart on Overview on criticality of inputs and factors of differentiation

2.3 Factors of disruption

Chart on Overview on factors of disruption

2.4 Impact of drivers and challenges

Chart on Impact of drivers and challenges in 2025 and 2030

3. Market Landscape

3.1 Market ecosystem

Chart on Parent Market
Data Table on - Parent Market

3.2 Market characteristics

Chart on Market characteristics analysis

3.3 Value chain analysis

Chart on Value chain analysis

4. Market Sizing

4.1 Market definition

Data Table on Offerings of companies included in the market definition

4.2 Market segment analysis

Market segments

4.3 Market size 2025

4.4 Market outlook: Forecast for 2025-2030

Chart on Global - Market size and forecast 2025-2030 ($ million)
Data Table on Global - Market size and forecast 2025-2030 ($ million)
Chart on Global Market: Year-over-year growth 2025-2030 (%)
Data Table on Global Market: Year-over-year growth 2025-2030 (%)

5. Historic Market Size

5.1 Global Women Activewear Market 2020 - 2024

Historic Market Size - Data Table on Global Women Activewear Market 2020 - 2024 ($ million)

5.2 Distribution Channel segment analysis 2020 - 2024

Historic Market Size - Distribution Channel Segment 2020 - 2024 ($ million)

5.3 Product Type segment analysis 2020 - 2024

Historic Market Size - Product Type Segment 2020 - 2024 ($ million)

5.4 Price Range segment analysis 2020 - 2024

Historic Market Size - Price Range Segment 2020 - 2024 ($ million)

5.5 Type segment analysis 2020 - 2024

Historic Market Size - Type Segment 2020 - 2024 ($ million)

5.6 Geography segment analysis 2020 - 2024

Historic Market Size - Geography Segment 2020 - 2024 ($ million)

5.7 Country segment analysis 2020 - 2024

Historic Market Size - Country Segment 2020 - 2024 ($ million)

6. Qualitative Analysis

6.1 Impact of AI on Global Women Activewear Market

6.2 Impact of Geopolitical Conflicts on Global Women Activewear Market

7. Five Forces Analysis

7.1 Five forces summary

Five forces analysis - Comparison between 2025 and 2030

7.2 Bargaining power of buyers

Bargaining power of buyers - Impact of key factors 2025 and 2030

7.3 Bargaining power of suppliers

Bargaining power of suppliers - Impact of key factors in 2025 and 2030

7.4 Threat of new entrants

Threat of new entrants - Impact of key factors in 2025 and 2030

7.5 Threat of substitutes

Threat of substitutes - Impact of key factors in 2025 and 2030

7.6 Threat of rivalry

Threat of rivalry - Impact of key factors in 2025 and 2030

7.7 Market condition

Chart on Market condition - Five forces 2025 and 2030

8. Market Segmentation by Distribution Channel

8.1 Market segments

Chart on Distribution Channel - Market share 2025-2030 (%)
Data Table on Distribution Channel - Market share 2025-2030 (%)

8.2 Comparison by Distribution Channel

Chart on Comparison by Distribution Channel
Data Table on Comparison by Distribution Channel

8.3 Online - Market size and forecast 2025-2030

Chart on Online - Market size and forecast 2025-2030 ($ million)
Data Table on Online - Market size and forecast 2025-2030 ($ million)
Chart on Online - Year-over-year growth 2025-2030 (%)
Data Table on Online - Year-over-year growth 2025-2030 (%)

8.4 Supermarkets and hypermarkets - Market size and forecast 2025-2030

Chart on Supermarkets and hypermarkets - Market size and forecast 2025-2030 ($ million)
Data Table on Supermarkets and hypermarkets - Market size and forecast 2025-2030 ($ million)
Chart on Supermarkets and hypermarkets - Year-over-year growth 2025-2030 (%)
Data Table on Supermarkets and hypermarkets - Year-over-year growth 2025-2030 (%)

8.5 Specialty stores - Market size and forecast 2025-2030

Chart on Specialty stores - Market size and forecast 2025-2030 ($ million)
Data Table on Specialty stores - Market size and forecast 2025-2030 ($ million)
Chart on Specialty stores - Year-over-year growth 2025-2030 (%)
Data Table on Specialty stores - Year-over-year growth 2025-2030 (%)

8.6 Others - Market size and forecast 2025-2030

Chart on Others - Market size and forecast 2025-2030 ($ million)
Data Table on Others - Market size and forecast 2025-2030 ($ million)
Chart on Others - Year-over-year growth 2025-2030 (%)
Data Table on Others - Year-over-year growth 2025-2030 (%)

8.7 Market opportunity by Distribution Channel

Market opportunity by Distribution Channel ($ million)
Data Table on Market opportunity by Distribution Channel ($ million)

9. Market Segmentation by Product Type

9.1 Market segments

Chart on Product Type - Market share 2025-2030 (%)
Data Table on Product Type - Market share 2025-2030 (%)

9.2 Comparison by Product Type

Chart on Comparison by Product Type
Data Table on Comparison by Product Type

9.3 Tops and T-shirts - Market size and forecast 2025-2030

Chart on Tops and T-shirts - Market size and forecast 2025-2030 ($ million)
Data Table on Tops and T-shirts - Market size and forecast 2025-2030 ($ million)
Chart on Tops and T-shirts - Year-over-year growth 2025-2030 (%)
Data Table on Tops and T-shirts - Year-over-year growth 2025-2030 (%)

9.4 Bottom wear - Market size and forecast 2025-2030

Chart on Bottom wear - Market size and forecast 2025-2030 ($ million)
Data Table on Bottom wear - Market size and forecast 2025-2030 ($ million)
Chart on Bottom wear - Year-over-year growth 2025-2030 (%)
Data Table on Bottom wear - Year-over-year growth 2025-2030 (%)

9.5 Innerwear and swimwear - Market size and forecast 2025-2030

Chart on Innerwear and swimwear - Market size and forecast 2025-2030 ($ million)
Data Table on Innerwear and swimwear - Market size and forecast 2025-2030 ($ million)
Chart on Innerwear and swimwear - Year-over-year growth 2025-2030 (%)
Data Table on Innerwear and swimwear - Year-over-year growth 2025-2030 (%)

9.6 Outerwear - Market size and forecast 2025-2030

Chart on Outerwear - Market size and forecast 2025-2030 ($ million)
Data Table on Outerwear - Market size and forecast 2025-2030 ($ million)
Chart on Outerwear - Year-over-year growth 2025-2030 (%)
Data Table on Outerwear - Year-over-year growth 2025-2030 (%)

9.7 Others - Market size and forecast 2025-2030

Chart on Others - Market size and forecast 2025-2030 ($ million)
Data Table on Others - Market size and forecast 2025-2030 ($ million)
Chart on Others - Year-over-year growth 2025-2030 (%)
Data Table on Others - Year-over-year growth 2025-2030 (%)

9.8 Market opportunity by Product Type

Market opportunity by Product Type ($ million)
Data Table on Market opportunity by Product Type ($ million)

10. Market Segmentation by Price Range

10.1 Market segments

Chart on Price Range - Market share 2025-2030 (%)
Data Table on Price Range - Market share 2025-2030 (%)

10.2 Comparison by Price Range

Chart on Comparison by Price Range
Data Table on Comparison by Price Range

10.3 Mass - Market size and forecast 2025-2030

Chart on Mass - Market size and forecast 2025-2030 ($ million)
Data Table on Mass - Market size and forecast 2025-2030 ($ million)
Chart on Mass - Year-over-year growth 2025-2030 (%)
Data Table on Mass - Year-over-year growth 2025-2030 (%)

10.4 Mid - Market size and forecast 2025-2030

Chart on Mid - Market size and forecast 2025-2030 ($ million)
Data Table on Mid - Market size and forecast 2025-2030 ($ million)
Chart on Mid - Year-over-year growth 2025-2030 (%)
Data Table on Mid - Year-over-year growth 2025-2030 (%)

10.5 Premium - Market size and forecast 2025-2030

Chart on Premium - Market size and forecast 2025-2030 ($ million)
Data Table on Premium - Market size and forecast 2025-2030 ($ million)
Chart on Premium - Year-over-year growth 2025-2030 (%)
Data Table on Premium - Year-over-year growth 2025-2030 (%)

10.6 Market opportunity by Price Range

Market opportunity by Price Range ($ million)
Data Table on Market opportunity by Price Range ($ million)

11. Market Segmentation by Type

11.1 Market segments

Chart on Type - Market share 2025-2030 (%)
Data Table on Type - Market share 2025-2030 (%)

11.2 Comparison by Type

Chart on Comparison by Type
Data Table on Comparison by Type

11.3 Polyester - Market size and forecast 2025-2030

Chart on Polyester - Market size and forecast 2025-2030 ($ million)
Data Table on Polyester - Market size and forecast 2025-2030 ($ million)
Chart on Polyester - Year-over-year growth 2025-2030 (%)
Data Table on Polyester - Year-over-year growth 2025-2030 (%)

11.4 Spandex - Market size and forecast 2025-2030

Chart on Spandex - Market size and forecast 2025-2030 ($ million)
Data Table on Spandex - Market size and forecast 2025-2030 ($ million)
Chart on Spandex - Year-over-year growth 2025-2030 (%)
Data Table on Spandex - Year-over-year growth 2025-2030 (%)

11.5 Cotton - Market size and forecast 2025-2030

Chart on Cotton - Market size and forecast 2025-2030 ($ million)
Data Table on Cotton - Market size and forecast 2025-2030 ($ million)
Chart on Cotton - Year-over-year growth 2025-2030 (%)
Data Table on Cotton - Year-over-year growth 2025-2030 (%)

11.6 Polypropylene - Market size and forecast 2025-2030

Chart on Polypropylene - Market size and forecast 2025-2030 ($ million)
Data Table on Polypropylene - Market size and forecast 2025-2030 ($ million)
Chart on Polypropylene - Year-over-year growth 2025-2030 (%)
Data Table on Polypropylene - Year-over-year growth 2025-2030 (%)

11.7 Others - Market size and forecast 2025-2030

Chart on Others - Market size and forecast 2025-2030 ($ million)
Data Table on Others - Market size and forecast 2025-2030 ($ million)
Chart on Others - Year-over-year growth 2025-2030 (%)
Data Table on Others - Year-over-year growth 2025-2030 (%)

11.8 Market opportunity by Type

Market opportunity by Type ($ million)
Data Table on Market opportunity by Type ($ million)

12. Customer Landscape

12.1 Customer landscape overview

Analysis of price sensitivity, lifecycle, customer purchase basket, adoption rates, and purchase criteria

13. Geographic Landscape

13.1 Geographic segmentation

Chart on Market share by geography 2025-2030 (%)
Data Table on Market share by geography 2025-2030 (%)

13.2 Geographic comparison

Chart on Geographic comparison
Data Table on Geographic comparison

13.3 North America - Market size and forecast 2025-2030

Chart on North America - Market size and forecast 2025-2030 ($ million)
Data Table on North America - Market size and forecast 2025-2030 ($ million)
Chart on North America - Year-over-year growth 2025-2030 (%)
Data Table on North America - Year-over-year growth 2025-2030 (%)
Chart on Regional Comparison - North America
Data Table on Regional Comparison - North America

13.3.1 US - Market size and forecast 2025-2030

Chart on US - Market size and forecast 2025-2030 ($ million)
Data Table on US - Market size and forecast 2025-2030 ($ million)
Chart on US - Year-over-year growth 2025-2030 (%)
Data Table on US - Year-over-year growth 2025-2030 (%)

13.3.2 Canada - Market size and forecast 2025-2030

Chart on Canada - Market size and forecast 2025-2030 ($ million)
Data Table on Canada - Market size and forecast 2025-2030 ($ million)
Chart on Canada - Year-over-year growth 2025-2030 (%)
Data Table on Canada - Year-over-year growth 2025-2030 (%)

13.3.3 Mexico - Market size and forecast 2025-2030

Chart on Mexico - Market size and forecast 2025-2030 ($ million)
Data Table on Mexico - Market size and forecast 2025-2030 ($ million)
Chart on Mexico - Year-over-year growth 2025-2030 (%)
Data Table on Mexico - Year-over-year growth 2025-2030 (%)

13.4 Europe - Market size and forecast 2025-2030

Chart on Europe - Market size and forecast 2025-2030 ($ million)
Data Table on Europe - Market size and forecast 2025-2030 ($ million)
Chart on Europe - Year-over-year growth 2025-2030 (%)
Data Table on Europe - Year-over-year growth 2025-2030 (%)
Chart on Regional Comparison - Europe
Data Table on Regional Comparison - Europe

13.4.1 Germany - Market size and forecast 2025-2030

Chart on Germany - Market size and forecast 2025-2030 ($ million)
Data Table on Germany - Market size and forecast 2025-2030 ($ million)
Chart on Germany - Year-over-year growth 2025-2030 (%)
Data Table on Germany - Year-over-year growth 2025-2030 (%)

13.4.2 UK - Market size and forecast 2025-2030

Chart on UK - Market size and forecast 2025-2030 ($ million)
Data Table on UK - Market size and forecast 2025-2030 ($ million)
Chart on UK - Year-over-year growth 2025-2030 (%)
Data Table on UK - Year-over-year growth 2025-2030 (%)

13.4.3 France - Market size and forecast 2025-2030

Chart on France - Market size and forecast 2025-2030 ($ million)
Data Table on France - Market size and forecast 2025-2030 ($ million)
Chart on France - Year-over-year growth 2025-2030 (%)
Data Table on France - Year-over-year growth 2025-2030 (%)

13.4.4 Italy - Market size and forecast 2025-2030

Chart on Italy - Market size and forecast 2025-2030 ($ million)
Data Table on Italy - Market size and forecast 2025-2030 ($ million)
Chart on Italy - Year-over-year growth 2025-2030 (%)
Data Table on Italy - Year-over-year growth 2025-2030 (%)

13.4.5 Spain - Market size and forecast 2025-2030

Chart on Spain - Market size and forecast 2025-2030 ($ million)
Data Table on Spain - Market size and forecast 2025-2030 ($ million)
Chart on Spain - Year-over-year growth 2025-2030 (%)
Data Table on Spain - Year-over-year growth 2025-2030 (%)

13.4.6 The Netherlands - Market size and forecast 2025-2030

Chart on The Netherlands - Market size and forecast 2025-2030 ($ million)
Data Table on The Netherlands - Market size and forecast 2025-2030 ($ million)
Chart on The Netherlands - Year-over-year growth 2025-2030 (%)
Data Table on The Netherlands - Year-over-year growth 2025-2030 (%)

13.5 APAC - Market size and forecast 2025-2030

Chart on APAC - Market size and forecast 2025-2030 ($ million)
Data Table on APAC - Market size and forecast 2025-2030 ($ million)
Chart on APAC - Year-over-year growth 2025-2030 (%)
Data Table on APAC - Year-over-year growth 2025-2030 (%)
Chart on Regional Comparison - APAC
Data Table on Regional Comparison - APAC

13.5.1 China - Market size and forecast 2025-2030

Chart on China - Market size and forecast 2025-2030 ($ million)
Data Table on China - Market size and forecast 2025-2030 ($ million)
Chart on China - Year-over-year growth 2025-2030 (%)
Data Table on China - Year-over-year growth 2025-2030 (%)

13.5.2 Japan - Market size and forecast 2025-2030

Chart on Japan - Market size and forecast 2025-2030 ($ million)
Data Table on Japan - Market size and forecast 2025-2030 ($ million)
Chart on Japan - Year-over-year growth 2025-2030 (%)
Data Table on Japan - Year-over-year growth 2025-2030 (%)

13.5.3 India - Market size and forecast 2025-2030

Chart on India - Market size and forecast 2025-2030 ($ million)
Data Table on India - Market size and forecast 2025-2030 ($ million)
Chart on India - Year-over-year growth 2025-2030 (%)
Data Table on India - Year-over-year growth 2025-2030 (%)

13.5.4 South Korea - Market size and forecast 2025-2030

Chart on South Korea - Market size and forecast 2025-2030 ($ million)
Data Table on South Korea - Market size and forecast 2025-2030 ($ million)
Chart on South Korea - Year-over-year growth 2025-2030 (%)
Data Table on South Korea - Year-over-year growth 2025-2030 (%)

13.5.5 Australia - Market size and forecast 2025-2030

Chart on Australia - Market size and forecast 2025-2030 ($ million)
Data Table on Australia - Market size and forecast 2025-2030 ($ million)
Chart on Australia - Year-over-year growth 2025-2030 (%)
Data Table on Australia - Year-over-year growth 2025-2030 (%)

13.5.6 Indonesia - Market size and forecast 2025-2030

Chart on Indonesia - Market size and forecast 2025-2030 ($ million)
Data Table on Indonesia - Market size and forecast 2025-2030 ($ million)
Chart on Indonesia - Year-over-year growth 2025-2030 (%)
Data Table on Indonesia - Year-over-year growth 2025-2030 (%)

13.6 South America - Market size and forecast 2025-2030

Chart on South America - Market size and forecast 2025-2030 ($ million)
Data Table on South America - Market size and forecast 2025-2030 ($ million)
Chart on South America - Year-over-year growth 2025-2030 (%)
Data Table on South America - Year-over-year growth 2025-2030 (%)
Chart on Regional Comparison - South America
Data Table on Regional Comparison - South America

13.6.1 Brazil - Market size and forecast 2025-2030

Chart on Brazil - Market size and forecast 2025-2030 ($ million)
Data Table on Brazil - Market size and forecast 2025-2030 ($ million)
Chart on Brazil - Year-over-year growth 2025-2030 (%)
Data Table on Brazil - Year-over-year growth 2025-2030 (%)

13.6.2 Argentina - Market size and forecast 2025-2030

Chart on Argentina - Market size and forecast 2025-2030 ($ million)
Data Table on Argentina - Market size and forecast 2025-2030 ($ million)
Chart on Argentina - Year-over-year growth 2025-2030 (%)
Data Table on Argentina - Year-over-year growth 2025-2030 (%)

13.6.3 Colombia - Market size and forecast 2025-2030

Chart on Colombia - Market size and forecast 2025-2030 ($ million)
Data Table on Colombia - Market size and forecast 2025-2030 ($ million)
Chart on Colombia - Year-over-year growth 2025-2030 (%)
Data Table on Colombia - Year-over-year growth 2025-2030 (%)

13.7 Middle East and Africa - Market size and forecast 2025-2030

Chart on Middle East and Africa - Market size and forecast 2025-2030 ($ million)
Data Table on Middle East and Africa - Market size and forecast 2025-2030 ($ million)
Chart on Middle East and Africa - Year-over-year growth 2025-2030 (%)
Data Table on Middle East and Africa - Year-over-year growth 2025-2030 (%)
Chart on Regional Comparison - Middle East and Africa
Data Table on Regional Comparison - Middle East and Africa

13.7.1 Saudi Arabia - Market size and forecast 2025-2030

Chart on Saudi Arabia - Market size and forecast 2025-2030 ($ million)
Data Table on Saudi Arabia - Market size and forecast 2025-2030 ($ million)
Chart on Saudi Arabia - Year-over-year growth 2025-2030 (%)
Data Table on Saudi Arabia - Year-over-year growth 2025-2030 (%)

13.7.2 UAE - Market size and forecast 2025-2030

Chart on UAE - Market size and forecast 2025-2030 ($ million)
Data Table on UAE - Market size and forecast 2025-2030 ($ million)
Chart on UAE - Year-over-year growth 2025-2030 (%)
Data Table on UAE - Year-over-year growth 2025-2030 (%)

13.7.3 South Africa - Market size and forecast 2025-2030

Chart on South Africa - Market size and forecast 2025-2030 ($ million)
Data Table on South Africa - Market size and forecast 2025-2030 ($ million)
Chart on South Africa - Year-over-year growth 2025-2030 (%)
Data Table on South Africa - Year-over-year growth 2025-2030 (%)

13.7.4 Israel - Market size and forecast 2025-2030

Chart on Israel - Market size and forecast 2025-2030 ($ million)
Data Table on Israel - Market size and forecast 2025-2030 ($ million)
Chart on Israel - Year-over-year growth 2025-2030 (%)
Data Table on Israel - Year-over-year growth 2025-2030 (%)

13.7.5 Turkey - Market size and forecast 2025-2030

Chart on Turkey - Market size and forecast 2025-2030 ($ million)
Data Table on Turkey - Market size and forecast 2025-2030 ($ million)
Chart on Turkey - Year-over-year growth 2025-2030 (%)
Data Table on Turkey - Year-over-year growth 2025-2030 (%)

13.8 Market opportunity by geography

Market opportunity by geography ($ million)
Data Tables on Market opportunity by geography ($ million)

14. Drivers, Challenges, and Opportunity

14.1 Market drivers

Expansion of holistic health consciousness and fitness participation
Ascendance of athleisure as permanent fashion paradigm
Technological innovations in textile engineering and performance materials

14.2 Market challenges

Supply chain volatility and escalating production expenses
Increasing regulatory oversight and sustainability paradox
Intensifying market saturation and high customer acquisition costs

14.3 Impact of drivers and challenges

Impact of drivers and challenges in 2025 and 2030

14.4 Market opportunities

Digital transformation and personalized consumer engagement
Sustainable material innovation and circular economy adoption
Diversification through inclusivity and niche segment expansion

15. Competitive Landscape

15.1 Overview

15.2

Overview on criticality of inputs and factors of differentiation

15.3 Landscape disruption

Overview on factors of disruption

15.4 Industry risks

Impact of key risks on business

16. Competitive Analysis

16.1 Companies profiled

Companies covered

16.2 Company ranking index

16.3 Market positioning of companies

Matrix on companies position and classification

16.4 Adidas AG

Adidas AG - Overview
Adidas AG - Business segments
Adidas AG - Key offerings
Adidas AG - Segment focus
SWOT

16.5 ANTA Sports Products Ltd.

ANTA Sports Products Ltd. - Overview
ANTA Sports Products Ltd. - Business segments
ANTA Sports Products Ltd. - Key offerings
ANTA Sports Products Ltd. - Segment focus
SWOT

16.6 ASICS Corp.

ASICS Corp. - Overview
ASICS Corp. - Business segments
ASICS Corp. - Key offerings
ASICS Corp. - Segment focus
SWOT

16.7 Champion LLC

Champion LLC - Overview
Champion LLC - Product / Service
Champion LLC - Key offerings
SWOT

16.8 Columbia Sportswear Co.

Columbia Sportswear Co. - Overview
Columbia Sportswear Co. - Business segments
Columbia Sportswear Co. - Key offerings
Columbia Sportswear Co. - Segment focus
SWOT

16.9 Decathlon SA

Decathlon SA - Overview
Decathlon SA - Product / Service
Decathlon SA - Key offerings
SWOT

16.10 FILA Holdings Corp.

FILA Holdings Corp. - Overview
FILA Holdings Corp. - Business segments
FILA Holdings Corp. - Key offerings
FILA Holdings Corp. - Segment focus
SWOT

16.11 Lululemon Athletica Inc.

Lululemon Athletica Inc. - Overview
Lululemon Athletica Inc. - Business segments
Lululemon Athletica Inc. - Key offerings
Lululemon Athletica Inc. - Segment focus
SWOT

16.12 Mizuno Corp.

Mizuno Corp. - Overview
Mizuno Corp. - Business segments
Mizuno Corp. - Key offerings
Mizuno Corp. - Segment focus
SWOT

16.13 Nike Inc.

Nike Inc. - Overview
Nike Inc. - Business segments
Nike Inc. - Key offerings
Nike Inc. - Segment focus
SWOT

16.14 PUMA SE

PUMA SE - Overview
PUMA SE - Business segments
PUMA SE - Key offerings
PUMA SE - Segment focus
SWOT

16.15 Reebok International Ltd.

Reebok International Ltd. - Overview
Reebok International Ltd. - Product / Service
Reebok International Ltd. - Key offerings
SWOT

16.16 Skechers USA Inc.

Skechers USA Inc. - Overview
Skechers USA Inc. - Product / Service
Skechers USA Inc. - Key offerings
SWOT

16.17 Under Armour Inc.

Under Armour Inc. - Overview
Under Armour Inc. - Business segments
Under Armour Inc. - Key offerings
Under Armour Inc. - Segment focus
SWOT

16.18 Vuori Inc.

Vuori Inc. - Overview
Vuori Inc. - Product / Service
Vuori Inc. - Key offerings
SWOT

17. Appendix

17.1 Scope of the report

Market definition
Objectives
Notes and caveats

17.2 Inclusions and exclusions checklist

Inclusions checklist
Exclusions checklist

17.3 Currency conversion rates for US$

17.4 Research methodology

17.5 Data procurement

Information sources

17.6 Data validation

17.7 Validation techniques employed for market sizing

17.8 Data synthesis

17.9 360 degree market analysis

17.10 List of abbreviations

Research Methodology

Technavio presents a detailed picture of the market by way of study, synthesis, and summation of data from multiple sources. The analysts have presented the various facets of the market with a particular focus on identifying the key industry influencers. The data thus presented is comprehensive, reliable, and the result of extensive research, both primary and secondary.

INFORMATION SOURCES

Primary sources

  • Manufacturers and suppliers
  • Channel partners
  • Industry experts
  • Strategic decision makers

Secondary sources

  • Industry journals and periodicals
  • Government data
  • Financial reports of key industry players
  • Historical data
  • Press releases

DATA ANALYSIS

Data Synthesis

  • Collation of data
  • Estimation of key figures
  • Analysis of derived insights

Data Validation

  • Triangulation with data models
  • Reference against proprietary databases
  • Corroboration with industry experts

REPORT WRITING

Qualitative

  • Market drivers
  • Market challenges
  • Market trends
  • Five forces analysis

Quantitative

  • Market size and forecast
  • Market segmentation
  • Geographical insights
  • Competitive landscape

Interested in this report?

Get your sample now to see our research methodology and insights!

Download Now

Frequently Asked Questions

Women Activewear market growth will increase by USD 80101.6 million during 2026-2030.

The Women Activewear market is expected to grow at a CAGR of 5.5% during 2026-2030.

Women Activewear market is segmented by Distribution channel (Online, Supermarkets and hypermarkets, Specialty stores, Others) Product type (Tops and T-shirts, Bottom wear, Innerwear and swimwear, Outerwear, Others) Price range (Mass, Mid, Premium) Type (Polyester, Spandex, Cotton, Polypropylene, Others)

2XU Pty Ltd., Adidas AG, Alo Yoga LLC, ANTA Sports Products Ltd., ASICS Corp., Champion LLC, Columbia Sportswear Co., Decathlon SA, FILA Holdings Corp., Gymshark Ltd., Lululemon Athletica Inc., Mizuno Corp., New Balance Athletics Inc., Nike Inc., PUMA SE, Reebok International Ltd., Skechers USA Inc., Sweaty Betty Ltd., Under Armour Inc., Vuori Inc. are a few of the key vendors in the Women Activewear market.

North America will register the highest growth rate of 34.8% among the other regions. Therefore, the Women Activewear market in North America is expected to garner significant business opportunities for the vendors during the forecast period.

US, Canada, Mexico, Germany, UK, France, Italy, Spain, The Netherlands, China, Japan, India, South Korea, Australia, Indonesia, Brazil, Argentina, Colombia, Saudi Arabia, UAE, South Africa, Israel, Turkey

  • Expansion of holistic health consciousness and fitness participation is the driving factor this market.

The Women Activewear market vendors should focus on grabbing business opportunities from the Distribution channel segment as it accounted for the largest market share in the base year.
RIA - Research AI Assistant
Ask RIA
