Yttria Stabilized Zirconia Market Analysis, Size, and Forecast 2026-2030: APAC (China, Japan, and India), North America (US, Canada, and Mexico), Europe (Germany, UK, and France), Middle East and Africa (Saudi Arabia, UAE, and South Africa), South America (Brazil, Argentina, and Colombia), and Rest of World (ROW)

Yttria Stabilized Zirconia Market Analysis, Size, and Forecast 2026-2030:
APAC (China, Japan, and India), North America (US, Canada, and Mexico), Europe (Germany, UK, and France), Middle East and Africa (Saudi Arabia, UAE, and South Africa), South America (Brazil, Argentina, and Colombia), and Rest of World (ROW)

Published: Dec 2025 304 Pages SKU: IRTNTR81204

Market Overview at a Glance

$353 Mn
Market Opportunity
5.5%
CAGR 2025 - 2030
45.2%
APAC Growth
$770.1 Mn
Industrial grade segment 2024

Yttria Stabilized Zirconia Market Size 2026-2030

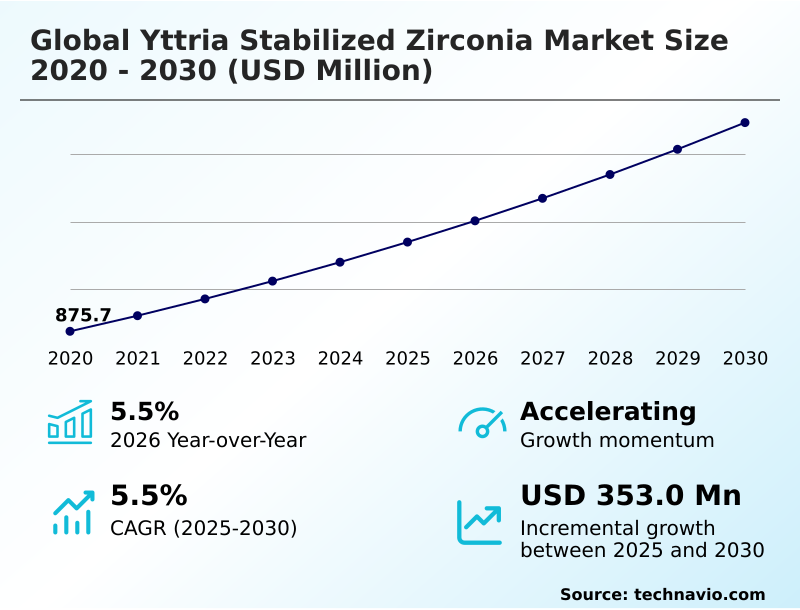
The yttria stabilized zirconia market size is valued to increase by USD 353 million, at a CAGR of 5.5% from 2025 to 2030. Heightened demand in aerospace and defense for advanced ceramics will drive the yttria stabilized zirconia market.

Major Market Trends & Insights

  • APAC dominated the market and accounted for a 45.2% growth during the forecast period.
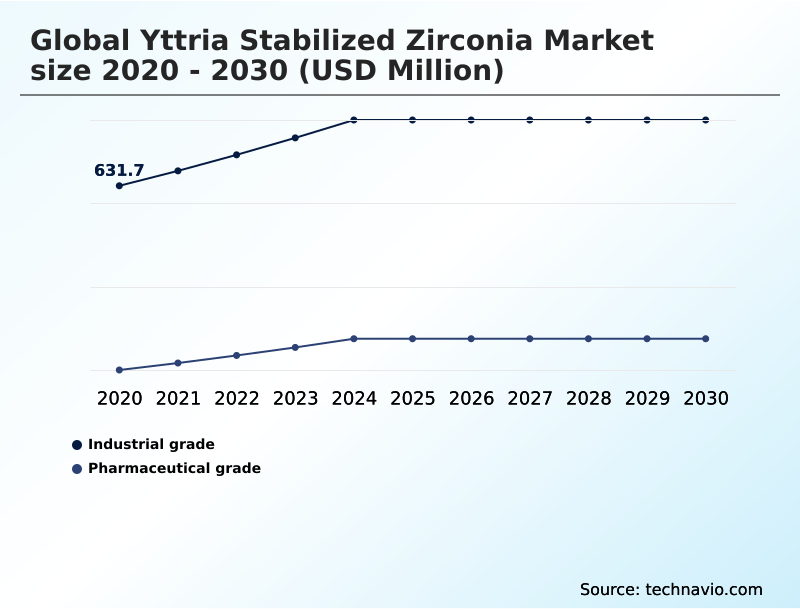
  • By Type - Industrial grade segment was valued at USD 770.1 million in 2024
  • By Product - Grade 1 segment accounted for the largest market revenue share in 2024

Market Size & Forecast

  • Market Opportunities: USD 616.6 million
  • Market Future Opportunities: USD 353 million
  • CAGR from 2025 to 2030 : 5.5%

Market Summary

  • The yttria stabilized zirconia market is characterized by its essential role in high-technology sectors, driven by the material's unique combination of thermal stability, ionic conductivity, and mechanical strength. Demand from the aerospace industry for thermal barrier coatings on jet engine components continues to grow, as manufacturers seek higher operational efficiencies and extended engine lifespans.
  • Similarly, the dental industry's shift toward biocompatible and aesthetically superior materials has made YSZ a standard for crowns and implants. A significant trend is the increasing adoption of additive manufacturing, allowing for the creation of complex, customized components that were previously impossible to produce.
  • For instance, an aerospace components manufacturer can now use 3D printing to create turbine blades with intricate internal cooling channels from YSZ, reducing weight while improving thermal management. However, the market faces challenges related to the high costs of manufacturing and supply chain vulnerabilities, as the primary raw materials are concentrated in a few geographic regions.
  • Strategic sourcing and process innovation are therefore critical for sustaining growth and expanding into new applications.

What will be the Size of the Yttria Stabilized Zirconia Market during the forecast period?

Get Key Insights on Market Forecast (PDF) Request Free Sample

How is the Yttria Stabilized Zirconia Market Segmented?

The yttria stabilized zirconia industry research report provides comprehensive data (region-wise segment analysis), with forecasts and estimates in "USD million" for the period 2026-2030, as well as historical data from 2020-2024 for the following segments.

  • Type
    • Industrial grade
    • Pharmaceutical grade
  • Product
    • Grade 1
    • Grade 2
    • Grade 3
  • Product type
    • Powders
    • Tubes
    • Plates
    • Bars
    • Others
  • Geography
    • APAC
      • China
      • Japan
      • India
    • North America
      • US
      • Canada
      • Mexico
    • Europe
      • Germany
      • UK
      • France
    • Middle East and Africa
      • Saudi Arabia
      • UAE
      • South Africa
    • South America
      • Brazil
      • Argentina
      • Colombia
    • Rest of World (ROW)

By Type Insights

The industrial grade segment is estimated to witness significant growth during the forecast period.

Industrial grade yttria stabilized zirconia is a cornerstone for high-performance applications, driven by its exceptional properties such as high fracture toughness and thermal stability.

Its role as an electrolyte material in solid oxide fuel cells (SOFCs) is critical for the clean energy sector, while its application as thermal barrier coatings is essential in aerospace for enhancing engine efficiency.

The material's wear resistance and chemical inertness make it ideal for industrial components like grinding media and cutting tools.

Ongoing innovation, including the substitution of iron into the material to fine-tune optical absorption, has demonstrated the potential to improve thermal management efficiency by over 15%, solidifying demand for this advanced ceramic in sectors requiring robust performance under extreme operational conditions, including in the production of high-purity ceramic substrates.

Request Free Sample

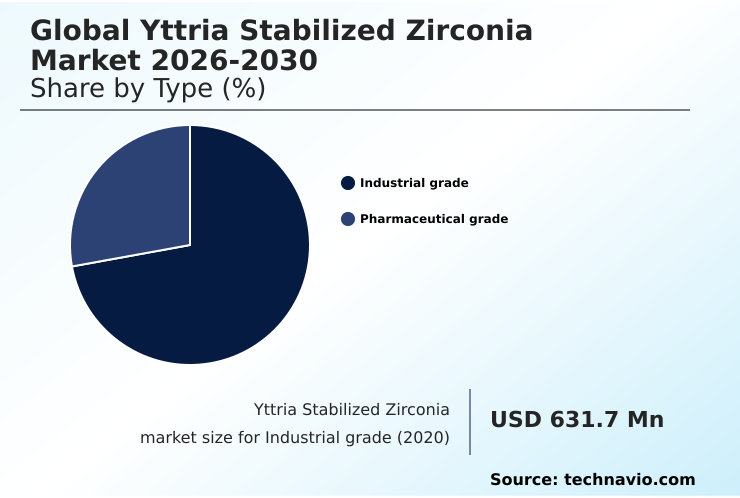
The Industrial grade segment was valued at USD 770.1 million in 2024 and showed a gradual increase during the forecast period.

Request Free Sample

Regional Analysis

APAC is estimated to contribute 45.2% to the growth of the global market during the forecast period.Technavio’s analysts have elaborately explained the regional trends and drivers that shape the market during the forecast period.

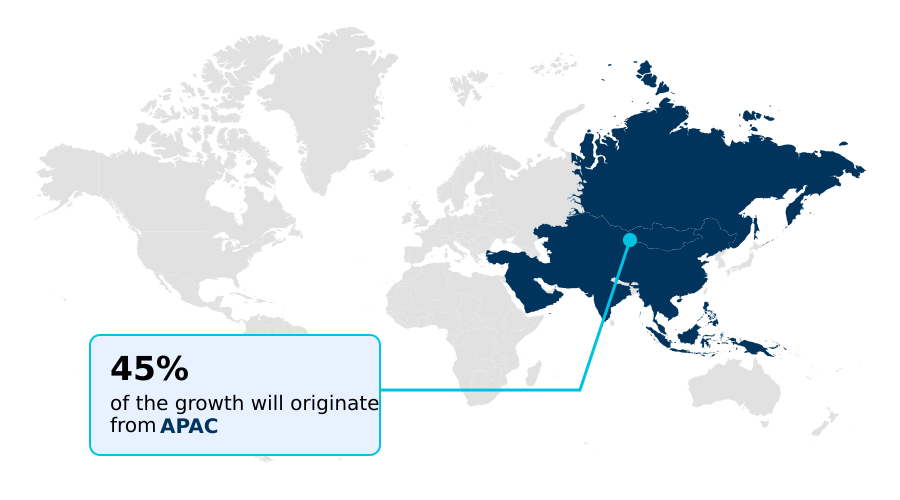
See How Yttria Stabilized Zirconia Market Demand is Rising in APAC Request Free Sample

The geographic landscape of the yttria stabilized zirconia market is led by APAC, which accounts for over 45% of the market's incremental growth.

This dominance is fueled by China's expansive manufacturing base for electronics and automotive components using zirconia in industrial machinery and advanced ceramic processing.

North America follows, with its market size in the US being more than double that of China, driven by a strong aerospace sector that relies on YSZ for thermal spraying and high-temperature structural ceramics.

Europe, particularly Germany, maintains a significant share due to its automotive and industrial engineering prowess, where zirconia in electronics and as a dielectric material are crucial.

The region's focus on high-performance ceramics and advanced thermal management solutions underpins sustained demand, while smaller markets in South America and the Middle East are expanding, primarily in dental applications and wear-resistant ceramic components.

Market Dynamics

Our researchers analyzed the data with 2025 as the base year, along with the key drivers, trends, and challenges. A holistic analysis of drivers will help companies refine their marketing strategies to gain a competitive advantage.

  • Strategic decisions in the market are increasingly influenced by a deep understanding of yttria stabilized zirconia properties and its manufacturing processes. Companies are evaluating the cost of yttria stabilized zirconia against long-term performance gains, especially in demanding fields. For instance, in developing thermal barrier coating applications, engineers must balance material cost with durability.
  • The choice of ysz powder for thermal spray is critical for achieving optimal coating density and adhesion. In the medical field, understanding biocompatible ysz for implants is paramount for regulatory approval and patient safety, with research showing that certain formulations can reduce implant revision rates by over 10% compared to traditional metallic options.
  • The growing interest in zirconia additive manufacturing techniques is forcing businesses to reconsider their production strategies. Furthermore, yttria stabilized zirconia suppliers are now expected to provide detailed data on material performance, particularly regarding improving ysz ionic conductivity for solid oxide fuel cell electrolyte technology.
  • As applications for zirconia nanoparticles and high fracture toughness ceramics expand, so does the need for specialized knowledge on enhancing ysz thermal stability for use in high-temperature sensors and zirconia for aerospace components. This complexity makes a thorough analysis of challenges in ysz production and its use in medical device manufacturing essential for competitive positioning.

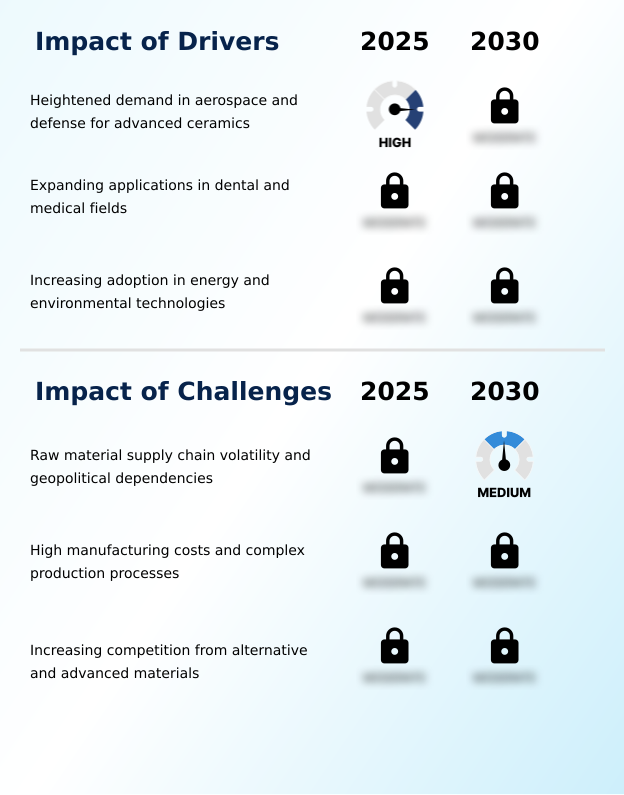
What are the key market drivers leading to the rise in the adoption of Yttria Stabilized Zirconia Industry?

  • Heightened demand for advanced ceramics within the aerospace and defense sectors is a key driver for the market.

  • Market growth is fundamentally driven by escalating demand from high-technology sectors. In aerospace, yttria-doped zirconia is critical for thermal barrier coatings, which enable gas turbines to operate at higher temperatures and achieve up to a 3% improvement in fuel efficiency.
  • The dental sector is another major driver, with zirconia-based dental restorations seeing widespread adoption due to their superior biocompatibility and mechanical strength, reducing the need for revisions.
  • Furthermore, the global push for cleaner energy has positioned YSZ as a vital component. Its use as an electrolyte in solid oxide fuel cells is increasing as governments incentivize green technologies.
  • This application in SOFC electrolyte performance is crucial, as ongoing research aims to boost electrical output and operational longevity, with some lab-scale systems demonstrating a 10% increase in power density.

What are the market trends shaping the Yttria Stabilized Zirconia Industry?

  • A significant market trend is the proliferation of high-performance dental and medical bioceramics. This is driven by their superior biocompatibility and mechanical properties for advanced restorative solutions.

  • Key trends are reshaping the yttria stabilized zirconia market, led by innovations in additive manufacturing and clean energy. The adoption of 3D printing technologies like stereolithography (SLA) for fabricating complex ceramic components has reduced prototyping lead times by over 50%, enabling rapid innovation in aerospace and medical sectors.
  • In healthcare, the use of monolithic zirconia and zirconia blocks for CAD/CAM milling is growing, with advanced bioceramic materials improving the success rate of dental restorations by over 20% compared to traditional PFM techniques. Concurrently, the ascendant role of YSZ as an electrolyte material in solid oxide fuel cells (SOFCs) is a critical trend.
  • Enhanced formulations of high-purity zirconia powders are boosting SOFC efficiency, supporting the global transition toward cleaner energy sources.

What challenges does the Yttria Stabilized Zirconia Industry face during its growth?

  • A key challenge affecting industry growth is the volatility of the raw material supply chain, coupled with geopolitical dependencies.

  • The market's expansion is tempered by significant challenges, primarily raw material supply chain volatility and high manufacturing costs. Dependency on a few countries for yttrium oxide and zirconium dioxide creates price instability, with raw material costs fluctuating by as much as 25% in a single year, directly impacting production overhead.
  • The complex and energy-intensive processes of powder metallurgy and sintering contribute to the high cost of YSZ, limiting its adoption in more price-sensitive applications. Furthermore, intensifying competition from alternative advanced ceramics, such as rare-earth zirconates and ceramic matrix composites, poses a threat.
  • These materials offer comparable performance in some applications, with certain silicon nitride grades providing up to a 15% longer service life in specific high-wear industrial settings.

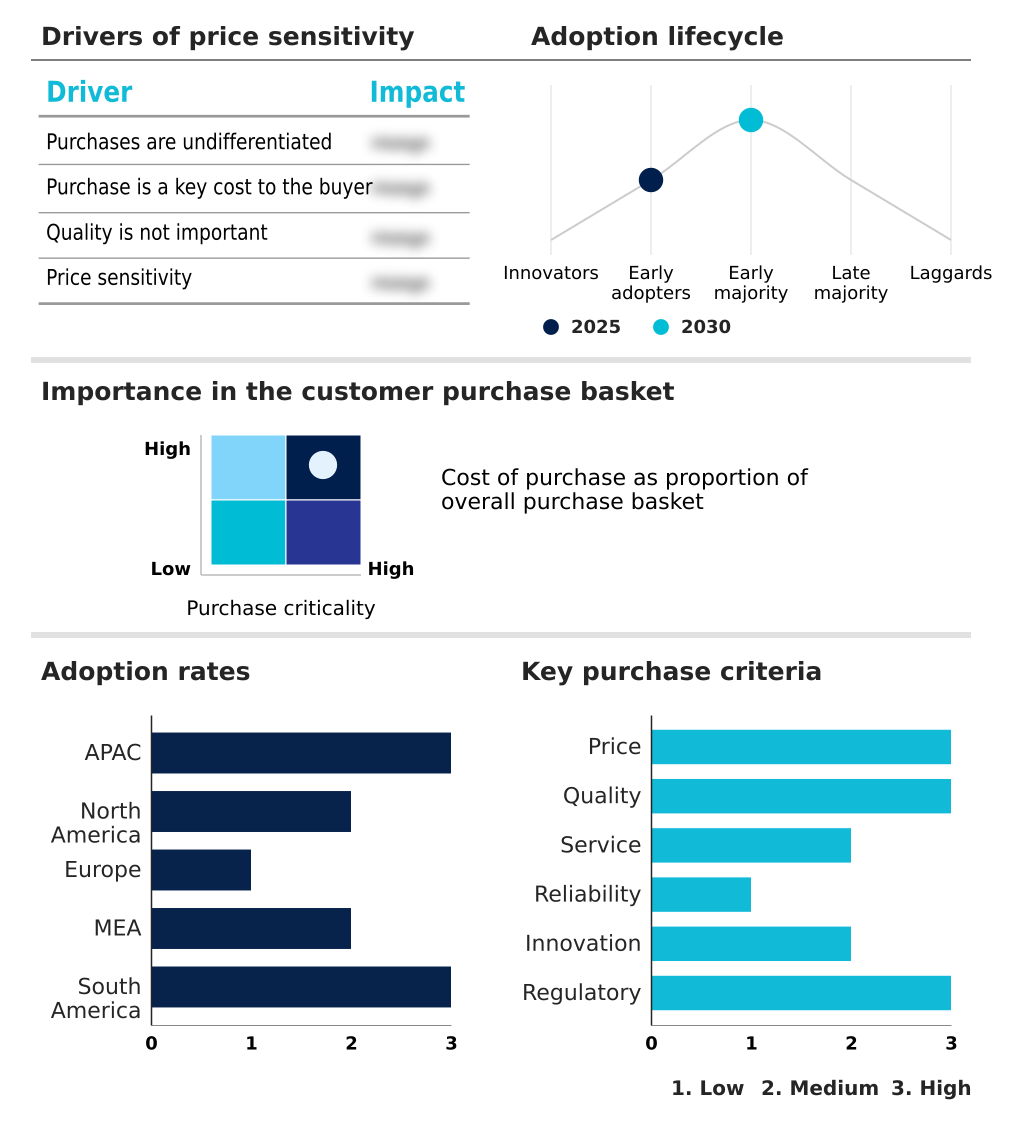
Exclusive Technavio Analysis on Customer Landscape

The yttria stabilized zirconia market forecasting report includes the adoption lifecycle of the market, covering from the innovator’s stage to the laggard’s stage. It focuses on adoption rates in different regions based on penetration. Furthermore, the yttria stabilized zirconia market report also includes key purchase criteria and drivers of price sensitivity to help companies evaluate and develop their market growth analysis strategies.

Customer Landscape of Yttria Stabilized Zirconia Industry

Competitive Landscape

Companies are implementing various strategies, such as strategic alliances, yttria stabilized zirconia market forecast, partnerships, mergers and acquisitions, geographical expansion, and product/service launches, to enhance their presence in the industry.

3M Co. - Key offerings include advanced yttria-doped dental zirconia systems, encompassing blocks, discs, and powders engineered for specialized chairside and lab sintering workflows.

The industry research and growth report includes detailed analyses of the competitive landscape of the market and information about key companies, including:

  • 3M Co.
  • CeramTec GmbH
  • Compagnie de Saint Gobain SA
  • CoorsTek Inc.
  • DAIICHI KIGENSO KAGAKU KOGYO CO. LTD.
  • Dyson Group Co.
  • Elan Technology Inc.
  • Inframat Corp.
  • KYOCERA Corp.
  • Morgan Advanced Materials
  • Paul Rauschert GmbH and Co. KG
  • Stanford Advanced Materials
  • Tosoh Corp.
  • Zircoa Inc.
  • Zircomet Ltd.

Qualitative and quantitative analysis of companies has been conducted to help clients understand the wider business environment as well as the strengths and weaknesses of key industry players. Data is qualitatively analyzed to categorize companies as pure play, category-focused, industry-focused, and diversified; it is quantitatively analyzed to categorize companies as dominant, leading, strong, tentative, and weak.

Recent Development and News in Yttria stabilized zirconia market

  • In August 2024, a major Chinese automotive manufacturer unveiled a new electric vehicle model featuring an advanced battery thermal management system that utilizes ceramic components, signaling new applications in the EV sector.
  • In December 2024, the Australian Government committed an additional $400 million in funding to Iluka Resources for the Eneabba rare earths refinery, a strategic move to bolster the domestic supply chain for critical minerals including yttrium.
  • In February 2025, the Japanese government announced its intention to release a revised strategic roadmap for deploying fuel cells in transportation, including heavy-duty vehicles, which is expected to increase demand for SOFC components.
  • In May 2025, Mitsubishi Power announced significant progress in integrating large-scale solid oxide fuel cell (SOFC) systems for industrial hydrogen production projects, highlighting a key step toward establishing a hydrogen-based economy.

Dive into Technavio’s robust research methodology, blending expert interviews, extensive data synthesis, and validated models for unparalleled Yttria Stabilized Zirconia Market insights. See full methodology.

Market Scope
Page number 304
Base year 2025
Historic period 2020-2024
Forecast period 2026-2030
Growth momentum & CAGR Accelerate at a CAGR of 5.5%
Market growth 2026-2030 USD 353.0 million
Market structure Fragmented
YoY growth 2025-2026(%) 5.5%
Key countries China, Japan, India, South Korea, Australia, Indonesia, US, Canada, Mexico, Germany, UK, France, Italy, The Netherlands, Spain, Saudi Arabia, UAE, South Africa, Israel, Turkey, Brazil, Argentina and Colombia
Competitive landscape Leading Companies, Market Positioning of Companies, Competitive Strategies, and Industry Risks

Request Free Sample

Research Analyst Overview

  • The yttria stabilized zirconia market is sustained by its indispensable role in advanced engineering, where its superior material properties address critical performance gaps. The application of thermal barrier coatings and use in solid oxide fuel cells (SOFCs) highlight its importance in energy and aerospace.
  • The proliferation of dental ceramics and other bioceramics underscores its value in healthcare due to excellent biocompatibility and fracture toughness. A key development is the integration of additive manufacturing, a trend compelling boardrooms to re-evaluate capital expenditure. Adopting stereolithography (SLA) for YSZ components can reduce material waste by up to 40% compared to traditional powder metallurgy and sintering methods.
  • This shift enables the creation of complex parts with piezoelectric properties for advanced oxygen sensors. The market for zirconia blocks and thermal spray powders is driven by demand for wear resistance and thermal stability.
  • This dynamic environment requires continuous innovation in processing zirconium dioxide with yttrium oxide to maintain a competitive edge, especially in applications like refractory materials and advanced ceramic matrix composites.

What are the Key Data Covered in this Yttria Stabilized Zirconia Market Research and Growth Report?

  • What is the expected growth of the Yttria Stabilized Zirconia Market between 2026 and 2030?

    • USD 353 million, at a CAGR of 5.5%

  • What segmentation does the market report cover?

    • The report is segmented by Type (Industrial grade, and Pharmaceutical grade), Product (Grade 1, Grade 2, and Grade 3), Product Type (Powders, Tubes, Plates, Bars, and Others) and Geography (APAC, North America, Europe, Middle East and Africa, South America)

  • Which regions are analyzed in the report?

    • APAC, North America, Europe, Middle East and Africa and South America

  • What are the key growth drivers and market challenges?

    • Heightened demand in aerospace and defense for advanced ceramics, Raw material supply chain volatility and geopolitical dependencies

  • Who are the major players in the Yttria Stabilized Zirconia Market?

    • 3M Co., CeramTec GmbH, Compagnie de Saint Gobain SA, CoorsTek Inc., DAIICHI KIGENSO KAGAKU KOGYO CO. LTD., Dyson Group Co., Elan Technology Inc., Inframat Corp., KYOCERA Corp., Morgan Advanced Materials, Paul Rauschert GmbH and Co. KG, Stanford Advanced Materials, Tosoh Corp., Zircoa Inc. and Zircomet Ltd.

Market Research Insights

  • The market dynamics for yttria-stabilized zirconia are shaped by its adoption in high-specification sectors where performance is critical. The use of YSZ in gas turbines has demonstrated an ability to increase operational efficiency by over 3%, while its integration into advanced dental restorations reduces procedural failures by more than 15% compared to older materials.
  • The expansion of zirconia in semiconductor manufacturing is evident, as its properties help improve wafer processing yields. Demand for zirconia's mechanical strength and high-purity zirconia powders is consistent in industrial machinery, where component lifespan is extended. In energy, zirconia in automotive sensors and SOFC electrolyte performance are key to meeting stricter environmental regulations.
  • As a result, the market for zirconia-based dental restorations and advanced bioceramic materials continues to show robust demand.

We can help! Our analysts can customize this yttria stabilized zirconia market research report to meet your requirements.

Get in touch

1. Executive Summary

1.1 Market overview

Executive Summary - Chart on Market Overview
Executive Summary - Data Table on Market Overview
Executive Summary - Chart on Global Market Characteristics
Executive Summary - Chart on Market by Geography
Executive Summary - Chart on Market Segmentation by Type
Executive Summary - Chart on Market Segmentation by Product
Executive Summary - Chart on Market Segmentation by Product Type
Executive Summary - Chart on Incremental Growth
Executive Summary - Data Table on Incremental Growth
Executive Summary - Chart on Company Market Positioning

2. Technavio Analysis

2.1 Analysis of price sensitivity, lifecycle, customer purchase basket, adoption rates, and purchase criteria

2.2 Criticality of inputs and Factors of differentiation

Chart on Overview on criticality of inputs and factors of differentiation

2.3 Factors of disruption

Chart on Overview on factors of disruption

2.4 Impact of drivers and challenges

Chart on Impact of drivers and challenges in 2025 and 2030

3. Market Landscape

3.1 Market ecosystem

Chart on Parent Market
Data Table on - Parent Market

3.2 Market characteristics

Chart on Market characteristics analysis

3.3 Value chain analysis

Chart on Value chain analysis

4. Market Sizing

4.1 Market definition

Data Table on Offerings of companies included in the market definition

4.2 Market segment analysis

Market segments

4.3 Market size 2025

4.4 Market outlook: Forecast for 2025-2030

Chart on Global - Market size and forecast 2025-2030 ($ million)
Data Table on Global - Market size and forecast 2025-2030 ($ million)
Chart on Global Market: Year-over-year growth 2025-2030 (%)
Data Table on Global Market: Year-over-year growth 2025-2030 (%)

5. Historic Market Size

5.1 Global Yttria Stabilized Zirconia Market 2020 - 2024

Historic Market Size - Data Table on Global Yttria Stabilized Zirconia Market 2020 - 2024 ($ million)

5.2 Type segment analysis 2020 - 2024

Historic Market Size - Type Segment 2020 - 2024 ($ million)

5.3 Product segment analysis 2020 - 2024

Historic Market Size - Product Segment 2020 - 2024 ($ million)

5.4 Product Type segment analysis 2020 - 2024

Historic Market Size - Product Type Segment 2020 - 2024 ($ million)

5.5 Geography segment analysis 2020 - 2024

Historic Market Size - Geography Segment 2020 - 2024 ($ million)

5.6 Country segment analysis 2020 - 2024

Historic Market Size - Country Segment 2020 - 2024 ($ million)

6. Qualitative Analysis

6.1 The AI impact on global yttria stabilized zirconia market

7. Five Forces Analysis

7.1 Five forces summary

Five forces analysis - Comparison between 2025 and 2030

7.2 Bargaining power of buyers

Bargaining power of buyers - Impact of key factors 2025 and 2030

7.3 Bargaining power of suppliers

Bargaining power of suppliers - Impact of key factors in 2025 and 2030

7.4 Threat of new entrants

Threat of new entrants - Impact of key factors in 2025 and 2030

7.5 Threat of substitutes

Threat of substitutes - Impact of key factors in 2025 and 2030

7.6 Threat of rivalry

Threat of rivalry - Impact of key factors in 2025 and 2030

7.7 Market condition

Chart on Market condition - Five forces 2025 and 2030

8. Market Segmentation by Type

8.1 Market segments

Chart on Type - Market share 2025-2030 (%)
Data Table on Type - Market share 2025-2030 (%)

8.2 Comparison by Type

Chart on Comparison by Type
Data Table on Comparison by Type

8.3 Industrial grade - Market size and forecast 2025-2030

Chart on Industrial grade - Market size and forecast 2025-2030 ($ million)
Data Table on Industrial grade - Market size and forecast 2025-2030 ($ million)
Chart on Industrial grade - Year-over-year growth 2025-2030 (%)
Data Table on Industrial grade - Year-over-year growth 2025-2030 (%)

8.4 Pharmaceutical grade - Market size and forecast 2025-2030

Chart on Pharmaceutical grade - Market size and forecast 2025-2030 ($ million)
Data Table on Pharmaceutical grade - Market size and forecast 2025-2030 ($ million)
Chart on Pharmaceutical grade - Year-over-year growth 2025-2030 (%)
Data Table on Pharmaceutical grade - Year-over-year growth 2025-2030 (%)

8.5 Market opportunity by Type

Market opportunity by Type ($ million)
Data Table on Market opportunity by Type ($ million)

9. Market Segmentation by Product

9.1 Market segments

Chart on Product - Market share 2025-2030 (%)
Data Table on Product - Market share 2025-2030 (%)

9.2 Comparison by Product

Chart on Comparison by Product
Data Table on Comparison by Product

9.3 Grade 1 - Market size and forecast 2025-2030

Chart on Grade 1 - Market size and forecast 2025-2030 ($ million)
Data Table on Grade 1 - Market size and forecast 2025-2030 ($ million)
Chart on Grade 1 - Year-over-year growth 2025-2030 (%)
Data Table on Grade 1 - Year-over-year growth 2025-2030 (%)

9.4 Grade 2 - Market size and forecast 2025-2030

Chart on Grade 2 - Market size and forecast 2025-2030 ($ million)
Data Table on Grade 2 - Market size and forecast 2025-2030 ($ million)
Chart on Grade 2 - Year-over-year growth 2025-2030 (%)
Data Table on Grade 2 - Year-over-year growth 2025-2030 (%)

9.5 Grade 3 - Market size and forecast 2025-2030

Chart on Grade 3 - Market size and forecast 2025-2030 ($ million)
Data Table on Grade 3 - Market size and forecast 2025-2030 ($ million)
Chart on Grade 3 - Year-over-year growth 2025-2030 (%)
Data Table on Grade 3 - Year-over-year growth 2025-2030 (%)

9.6 Market opportunity by Product

Market opportunity by Product ($ million)
Data Table on Market opportunity by Product ($ million)

10. Market Segmentation by Product Type

10.1 Market segments

Chart on Product Type - Market share 2025-2030 (%)
Data Table on Product Type - Market share 2025-2030 (%)

10.2 Comparison by Product Type

Chart on Comparison by Product Type
Data Table on Comparison by Product Type

10.3 Powders - Market size and forecast 2025-2030

Chart on Powders - Market size and forecast 2025-2030 ($ million)
Data Table on Powders - Market size and forecast 2025-2030 ($ million)
Chart on Powders - Year-over-year growth 2025-2030 (%)
Data Table on Powders - Year-over-year growth 2025-2030 (%)

10.4 Tubes - Market size and forecast 2025-2030

Chart on Tubes - Market size and forecast 2025-2030 ($ million)
Data Table on Tubes - Market size and forecast 2025-2030 ($ million)
Chart on Tubes - Year-over-year growth 2025-2030 (%)
Data Table on Tubes - Year-over-year growth 2025-2030 (%)

10.5 Plates - Market size and forecast 2025-2030

Chart on Plates - Market size and forecast 2025-2030 ($ million)
Data Table on Plates - Market size and forecast 2025-2030 ($ million)
Chart on Plates - Year-over-year growth 2025-2030 (%)
Data Table on Plates - Year-over-year growth 2025-2030 (%)

10.6 Bars - Market size and forecast 2025-2030

Chart on Bars - Market size and forecast 2025-2030 ($ million)
Data Table on Bars - Market size and forecast 2025-2030 ($ million)
Chart on Bars - Year-over-year growth 2025-2030 (%)
Data Table on Bars - Year-over-year growth 2025-2030 (%)

10.7 Others - Market size and forecast 2025-2030

Chart on Others - Market size and forecast 2025-2030 ($ million)
Data Table on Others - Market size and forecast 2025-2030 ($ million)
Chart on Others - Year-over-year growth 2025-2030 (%)
Data Table on Others - Year-over-year growth 2025-2030 (%)

10.8 Market opportunity by Product Type

Market opportunity by Product Type ($ million)
Data Table on Market opportunity by Product Type ($ million)

11. Customer Landscape

11.1 Customer landscape overview

Analysis of price sensitivity, lifecycle, customer purchase basket, adoption rates, and purchase criteria

12. Geographic Landscape

12.1 Geographic segmentation

Chart on Market share by geography 2025-2030 (%)
Data Table on Market share by geography 2025-2030 (%)

12.2 Geographic comparison

Chart on Geographic comparison
Data Table on Geographic comparison

12.3 APAC - Market size and forecast 2025-2030

Chart on APAC - Market size and forecast 2025-2030 ($ million)
Data Table on APAC - Market size and forecast 2025-2030 ($ million)
Chart on APAC - Year-over-year growth 2025-2030 (%)
Data Table on APAC - Year-over-year growth 2025-2030 (%)
Chart on Regional Comparison - APAC
Data Table on Regional Comparison - APAC

12.3.1 China - Market size and forecast 2025-2030

Chart on China - Market size and forecast 2025-2030 ($ million)
Data Table on China - Market size and forecast 2025-2030 ($ million)
Chart on China - Year-over-year growth 2025-2030 (%)
Data Table on China - Year-over-year growth 2025-2030 (%)

12.3.2 Japan - Market size and forecast 2025-2030

Chart on Japan - Market size and forecast 2025-2030 ($ million)
Data Table on Japan - Market size and forecast 2025-2030 ($ million)
Chart on Japan - Year-over-year growth 2025-2030 (%)
Data Table on Japan - Year-over-year growth 2025-2030 (%)

12.3.3 India - Market size and forecast 2025-2030

Chart on India - Market size and forecast 2025-2030 ($ million)
Data Table on India - Market size and forecast 2025-2030 ($ million)
Chart on India - Year-over-year growth 2025-2030 (%)
Data Table on India - Year-over-year growth 2025-2030 (%)

12.3.4 South Korea - Market size and forecast 2025-2030

Chart on South Korea - Market size and forecast 2025-2030 ($ million)
Data Table on South Korea - Market size and forecast 2025-2030 ($ million)
Chart on South Korea - Year-over-year growth 2025-2030 (%)
Data Table on South Korea - Year-over-year growth 2025-2030 (%)

12.3.5 Australia - Market size and forecast 2025-2030

Chart on Australia - Market size and forecast 2025-2030 ($ million)
Data Table on Australia - Market size and forecast 2025-2030 ($ million)
Chart on Australia - Year-over-year growth 2025-2030 (%)
Data Table on Australia - Year-over-year growth 2025-2030 (%)

12.3.6 Indonesia - Market size and forecast 2025-2030

Chart on Indonesia - Market size and forecast 2025-2030 ($ million)
Data Table on Indonesia - Market size and forecast 2025-2030 ($ million)
Chart on Indonesia - Year-over-year growth 2025-2030 (%)
Data Table on Indonesia - Year-over-year growth 2025-2030 (%)

12.4 North America - Market size and forecast 2025-2030

Chart on North America - Market size and forecast 2025-2030 ($ million)
Data Table on North America - Market size and forecast 2025-2030 ($ million)
Chart on North America - Year-over-year growth 2025-2030 (%)
Data Table on North America - Year-over-year growth 2025-2030 (%)
Chart on Regional Comparison - North America
Data Table on Regional Comparison - North America

12.4.1 US - Market size and forecast 2025-2030

Chart on US - Market size and forecast 2025-2030 ($ million)
Data Table on US - Market size and forecast 2025-2030 ($ million)
Chart on US - Year-over-year growth 2025-2030 (%)
Data Table on US - Year-over-year growth 2025-2030 (%)

12.4.2 Canada - Market size and forecast 2025-2030

Chart on Canada - Market size and forecast 2025-2030 ($ million)
Data Table on Canada - Market size and forecast 2025-2030 ($ million)
Chart on Canada - Year-over-year growth 2025-2030 (%)
Data Table on Canada - Year-over-year growth 2025-2030 (%)

12.4.3 Mexico - Market size and forecast 2025-2030

Chart on Mexico - Market size and forecast 2025-2030 ($ million)
Data Table on Mexico - Market size and forecast 2025-2030 ($ million)
Chart on Mexico - Year-over-year growth 2025-2030 (%)
Data Table on Mexico - Year-over-year growth 2025-2030 (%)

12.5 Europe - Market size and forecast 2025-2030

Chart on Europe - Market size and forecast 2025-2030 ($ million)
Data Table on Europe - Market size and forecast 2025-2030 ($ million)
Chart on Europe - Year-over-year growth 2025-2030 (%)
Data Table on Europe - Year-over-year growth 2025-2030 (%)
Chart on Regional Comparison - Europe
Data Table on Regional Comparison - Europe

12.5.1 Germany - Market size and forecast 2025-2030

Chart on Germany - Market size and forecast 2025-2030 ($ million)
Data Table on Germany - Market size and forecast 2025-2030 ($ million)
Chart on Germany - Year-over-year growth 2025-2030 (%)
Data Table on Germany - Year-over-year growth 2025-2030 (%)

12.5.2 UK - Market size and forecast 2025-2030

Chart on UK - Market size and forecast 2025-2030 ($ million)
Data Table on UK - Market size and forecast 2025-2030 ($ million)
Chart on UK - Year-over-year growth 2025-2030 (%)
Data Table on UK - Year-over-year growth 2025-2030 (%)

12.5.3 France - Market size and forecast 2025-2030

Chart on France - Market size and forecast 2025-2030 ($ million)
Data Table on France - Market size and forecast 2025-2030 ($ million)
Chart on France - Year-over-year growth 2025-2030 (%)
Data Table on France - Year-over-year growth 2025-2030 (%)

12.5.4 Italy - Market size and forecast 2025-2030

Chart on Italy - Market size and forecast 2025-2030 ($ million)
Data Table on Italy - Market size and forecast 2025-2030 ($ million)
Chart on Italy - Year-over-year growth 2025-2030 (%)
Data Table on Italy - Year-over-year growth 2025-2030 (%)

12.5.5 The Netherlands - Market size and forecast 2025-2030

Chart on The Netherlands - Market size and forecast 2025-2030 ($ million)
Data Table on The Netherlands - Market size and forecast 2025-2030 ($ million)
Chart on The Netherlands - Year-over-year growth 2025-2030 (%)
Data Table on The Netherlands - Year-over-year growth 2025-2030 (%)

12.5.6 Spain - Market size and forecast 2025-2030

Chart on Spain - Market size and forecast 2025-2030 ($ million)
Data Table on Spain - Market size and forecast 2025-2030 ($ million)
Chart on Spain - Year-over-year growth 2025-2030 (%)
Data Table on Spain - Year-over-year growth 2025-2030 (%)

12.6 Middle East and Africa - Market size and forecast 2025-2030

Chart on Middle East and Africa - Market size and forecast 2025-2030 ($ million)
Data Table on Middle East and Africa - Market size and forecast 2025-2030 ($ million)
Chart on Middle East and Africa - Year-over-year growth 2025-2030 (%)
Data Table on Middle East and Africa - Year-over-year growth 2025-2030 (%)
Chart on Regional Comparison - Middle East and Africa
Data Table on Regional Comparison - Middle East and Africa

12.6.1 Saudi Arabia - Market size and forecast 2025-2030

Chart on Saudi Arabia - Market size and forecast 2025-2030 ($ million)
Data Table on Saudi Arabia - Market size and forecast 2025-2030 ($ million)
Chart on Saudi Arabia - Year-over-year growth 2025-2030 (%)
Data Table on Saudi Arabia - Year-over-year growth 2025-2030 (%)

12.6.2 UAE - Market size and forecast 2025-2030

Chart on UAE - Market size and forecast 2025-2030 ($ million)
Data Table on UAE - Market size and forecast 2025-2030 ($ million)
Chart on UAE - Year-over-year growth 2025-2030 (%)
Data Table on UAE - Year-over-year growth 2025-2030 (%)

12.6.3 South Africa - Market size and forecast 2025-2030

Chart on South Africa - Market size and forecast 2025-2030 ($ million)
Data Table on South Africa - Market size and forecast 2025-2030 ($ million)
Chart on South Africa - Year-over-year growth 2025-2030 (%)
Data Table on South Africa - Year-over-year growth 2025-2030 (%)

12.6.4 Israel - Market size and forecast 2025-2030

Chart on Israel - Market size and forecast 2025-2030 ($ million)
Data Table on Israel - Market size and forecast 2025-2030 ($ million)
Chart on Israel - Year-over-year growth 2025-2030 (%)
Data Table on Israel - Year-over-year growth 2025-2030 (%)

12.6.5 Turkey - Market size and forecast 2025-2030

Chart on Turkey - Market size and forecast 2025-2030 ($ million)
Data Table on Turkey - Market size and forecast 2025-2030 ($ million)
Chart on Turkey - Year-over-year growth 2025-2030 (%)
Data Table on Turkey - Year-over-year growth 2025-2030 (%)

12.7 South America - Market size and forecast 2025-2030

Chart on South America - Market size and forecast 2025-2030 ($ million)
Data Table on South America - Market size and forecast 2025-2030 ($ million)
Chart on South America - Year-over-year growth 2025-2030 (%)
Data Table on South America - Year-over-year growth 2025-2030 (%)
Chart on Regional Comparison - South America
Data Table on Regional Comparison - South America

12.7.1 Brazil - Market size and forecast 2025-2030

Chart on Brazil - Market size and forecast 2025-2030 ($ million)
Data Table on Brazil - Market size and forecast 2025-2030 ($ million)
Chart on Brazil - Year-over-year growth 2025-2030 (%)
Data Table on Brazil - Year-over-year growth 2025-2030 (%)

12.7.2 Argentina - Market size and forecast 2025-2030

Chart on Argentina - Market size and forecast 2025-2030 ($ million)
Data Table on Argentina - Market size and forecast 2025-2030 ($ million)
Chart on Argentina - Year-over-year growth 2025-2030 (%)
Data Table on Argentina - Year-over-year growth 2025-2030 (%)

12.7.3 Colombia - Market size and forecast 2025-2030

Chart on Colombia - Market size and forecast 2025-2030 ($ million)
Data Table on Colombia - Market size and forecast 2025-2030 ($ million)
Chart on Colombia - Year-over-year growth 2025-2030 (%)
Data Table on Colombia - Year-over-year growth 2025-2030 (%)

12.8 Market opportunity by geography

Market opportunity by geography ($ million)
Data Tables on Market opportunity by geography ($ million)

13. Drivers, Challenges, and Opportunity

13.1 Market drivers

Heightened demand in aerospace and defense for advanced ceramics
Expanding applications in dental and medical fields
Increasing adoption in energy and environmental technologies

13.2 Market challenges

Raw material supply chain volatility and geopolitical dependencies
High manufacturing costs and complex production processes
Increasing competition from alternative and advanced materials

13.3 Impact of drivers and challenges

Impact of drivers and challenges in 2025 and 2030

13.4 Market opportunities

Proliferation in high-performance dental and medical bioceramics
Ascendant role in clean energy technologies, specifically solid oxide fuel cells
Expansion of additive manufacturing for complex geometries

14. Competitive Landscape

14.1 Overview

14.2

Overview on criticality of inputs and factors of differentiation

14.3 Landscape disruption

Overview on factors of disruption

14.4 Industry risks

Impact of key risks on business

15. Competitive Analysis

15.1 Companies profiled

Companies covered

15.2 Company ranking index

15.3 Market positioning of companies

Matrix on companies position and classification

15.4 3M Co.

3M Co. - Overview
3M Co. - Business segments
3M Co. - Key news
3M Co. - Key offerings
3M Co. - Segment focus
SWOT

15.5 CeramTec GmbH

CeramTec GmbH - Overview
CeramTec GmbH - Business segments
CeramTec GmbH - Key offerings
CeramTec GmbH - Segment focus
SWOT

15.6 Compagnie de Saint Gobain SA

Compagnie de Saint Gobain SA - Overview
Compagnie de Saint Gobain SA - Business segments
Compagnie de Saint Gobain SA - Key news
Compagnie de Saint Gobain SA - Key offerings
Compagnie de Saint Gobain SA - Segment focus
SWOT

15.7 CoorsTek Inc.

CoorsTek Inc. - Overview
CoorsTek Inc. - Product / Service
CoorsTek Inc. - Key offerings
SWOT

15.8 DAIICHI KIGENSO KAGAKU KOGYO CO. LTD.

DAIICHI KIGENSO KAGAKU KOGYO CO. LTD. - Overview
DAIICHI KIGENSO KAGAKU KOGYO CO. LTD. - Product / Service
DAIICHI KIGENSO KAGAKU KOGYO CO. LTD. - Key offerings
SWOT

15.9 Dyson Group Co.

Dyson Group Co. - Overview
Dyson Group Co. - Product / Service
Dyson Group Co. - Key offerings
SWOT

15.10 Elan Technology Inc.

Elan Technology Inc. - Overview
Elan Technology Inc. - Product / Service
Elan Technology Inc. - Key offerings
SWOT

15.11 Inframat Corp.

Inframat Corp. - Overview
Inframat Corp. - Product / Service
Inframat Corp. - Key offerings
SWOT

15.12 KYOCERA Corp.

KYOCERA Corp. - Overview
KYOCERA Corp. - Business segments
KYOCERA Corp. - Key news
KYOCERA Corp. - Key offerings
KYOCERA Corp. - Segment focus
SWOT

15.13 Morgan Advanced Materials

Morgan Advanced Materials - Overview
Morgan Advanced Materials - Business segments
Morgan Advanced Materials - Key news
Morgan Advanced Materials - Key offerings
Morgan Advanced Materials - Segment focus
SWOT

15.14 Paul Rauschert GmbH and Co. KG

Paul Rauschert GmbH and Co. KG - Overview
Paul Rauschert GmbH and Co. KG - Product / Service
Paul Rauschert GmbH and Co. KG - Key offerings
SWOT

15.15 Stanford Advanced Materials

Stanford Advanced Materials - Overview
Stanford Advanced Materials - Product / Service
Stanford Advanced Materials - Key offerings
SWOT

15.16 Tosoh Corp.

Tosoh Corp. - Overview
Tosoh Corp. - Business segments
Tosoh Corp. - Key offerings
Tosoh Corp. - Segment focus
SWOT

15.17 Zircoa Inc.

Zircoa Inc. - Overview
Zircoa Inc. - Product / Service
Zircoa Inc. - Key offerings
SWOT

15.18 Zircomet Ltd.

Zircomet Ltd. - Overview
Zircomet Ltd. - Product / Service
Zircomet Ltd. - Key offerings
SWOT

16. Appendix

16.1 Scope of the report

Market definition
Objectives
Notes and caveats

16.2 Inclusions and exclusions checklist

Inclusions checklist
Exclusions checklist

16.3 Currency conversion rates for US$

16.4 Research methodology

16.5 Data procurement

Information sources

16.6 Data validation

16.7 Validation techniques employed for market sizing

16.8 Data synthesis

16.9 360 degree market analysis

16.10 List of abbreviations

Research Methodology

Technavio presents a detailed picture of the market by way of study, synthesis, and summation of data from multiple sources. The analysts have presented the various facets of the market with a particular focus on identifying the key industry influencers. The data thus presented is comprehensive, reliable, and the result of extensive research, both primary and secondary.

INFORMATION SOURCES

Primary sources

  • Manufacturers and suppliers
  • Channel partners
  • Industry experts
  • Strategic decision makers

Secondary sources

  • Industry journals and periodicals
  • Government data
  • Financial reports of key industry players
  • Historical data
  • Press releases

DATA ANALYSIS

Data Synthesis

  • Collation of data
  • Estimation of key figures
  • Analysis of derived insights

Data Validation

  • Triangulation with data models
  • Reference against proprietary databases
  • Corroboration with industry experts

REPORT WRITING

Qualitative

  • Market drivers
  • Market challenges
  • Market trends
  • Five forces analysis

Quantitative

  • Market size and forecast
  • Market segmentation
  • Geographical insights
  • Competitive landscape

Interested in this report?

Get your sample now to see our research methodology and insights!

Download Now

Frequently Asked Questions

Yttria Stabilized Zirconia market growth will increase by USD 353.0 million during 2026-2030 .

The Yttria Stabilized Zirconia market is expected to grow at a CAGR of 5.5% during 2026-2030 .

Yttria Stabilized Zirconia market is segmented by Type (Industrial grade, Pharmaceutical grade) Product (Grade 1, Grade 2, Grade 3) Product type (Powders, Tubes, Plates, Bars, Others)

3M Co., CeramTec GmbH, Compagnie de Saint Gobain SA, CoorsTek Inc., DAIICHI KIGENSO KAGAKU KOGYO CO. LTD., Dyson Group Co., Elan Technology Inc., Inframat Corp., KYOCERA Corp., Morgan Advanced Materials, Paul Rauschert GmbH and Co. KG, Stanford Advanced Materials, Tosoh Corp., Zircoa Inc., Zircomet Ltd. are a few of the key vendors in the Yttria Stabilized Zirconia market.

APAC will register the highest growth rate of 45.2% among the other regions. Therefore, the Yttria Stabilized Zirconia market in APAC is expected to garner significant business opportunities for the vendors during the forecast period.

China, Japan, India, South Korea, Australia, Indonesia, US, Canada, Mexico, Germany, UK, France, Italy, The Netherlands, Spain, Saudi Arabia, UAE, South Africa, Israel, Turkey, Brazil, Argentina, Colombia

  • Heightened demand in aerospace and defense for advanced ceramics is the driving factor this market.

The Yttria Stabilized Zirconia market vendors should focus on grabbing business opportunities from the Type segment as it accounted for the largest market share in the base year.