Zero-energy Buildings Market Size 2026-2030
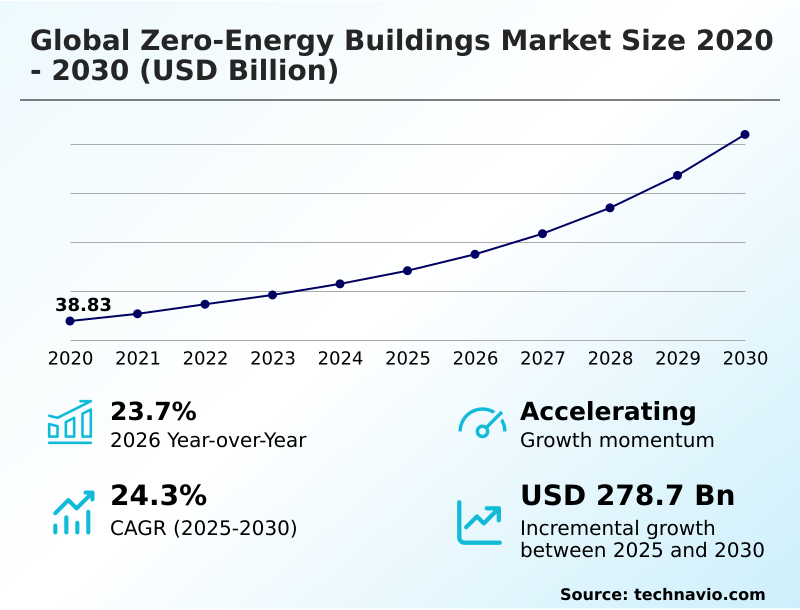
The zero-energy buildings market size is valued to increase by USD 278.70 billion, at a CAGR of 24.3% from 2025 to 2030. Regulatory mandates and stringent energy codes will drive the zero-energy buildings market.
Major Market Trends & Insights
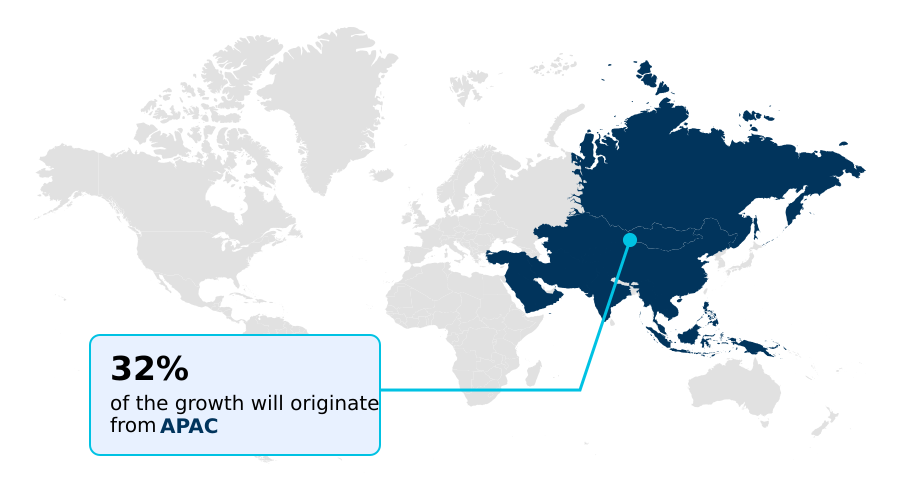
- APAC dominated the market and accounted for a 31.9% growth during the forecast period.
- By Source - Solar energy segment was valued at USD 53.09 billion in 2024
- By Product - Insulation and glazing segment accounted for the largest market revenue share in 2024
Market Size & Forecast
- Market Opportunities: USD 381.62 billion
- Market Future Opportunities: USD 278.70 billion
- CAGR from 2025 to 2030 : 24.3%
Market Summary
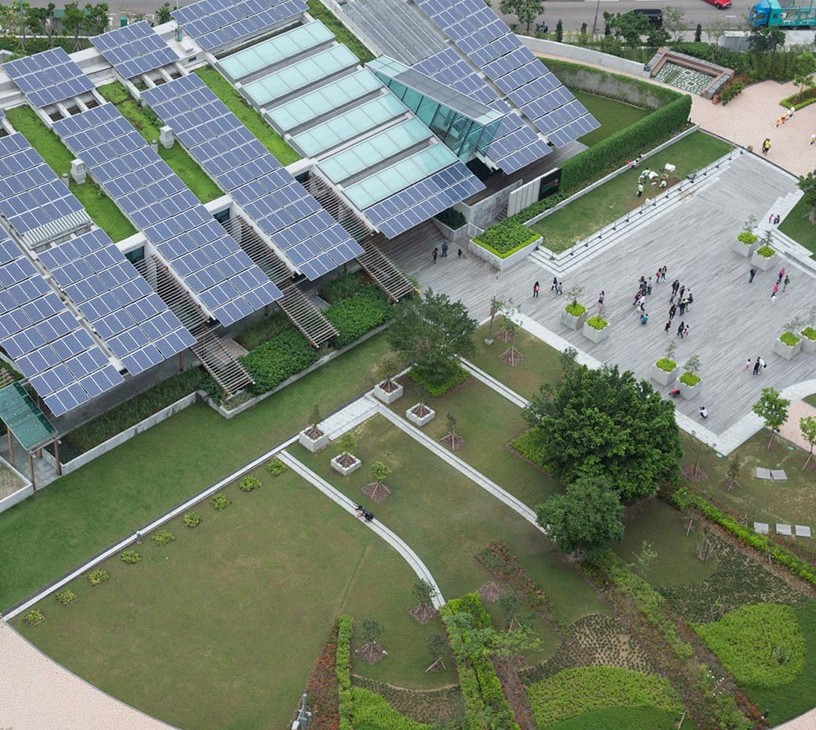
- The zero-energy buildings market is defined by a fundamental shift toward holistic energy performance, where building automation systems and high-performance building envelopes are standard. This market's trajectory is shaped by stringent energy conservation mandates and the dual pursuit of operational carbon reduction and occupant well-being.
- A key driver is the maturation of technologies like building integrated photovoltaics and geothermal heat pumps, which make energy self-sufficiency an attainable goal for both new construction and retrofits.
- For instance, a commercial developer undertaking a large-scale project must now integrate a whole life carbon assessment from the initial design phase, utilizing building information modeling to evaluate everything from mass timber construction to the R-value of structural insulated panels. This ensures compliance with net-zero energy ready standards and attracts green financing mechanisms.
- Simultaneously, the market navigates the complexities of supply chain volatility for advanced thermal glazing and other critical components, pushing the industry toward circular construction principles and resilient, localized manufacturing.
What will be the Size of the Zero-energy Buildings Market during the forecast period?
Get Key Insights on Market Forecast (PDF) Get Free Sample
How is the Zero-energy Buildings Market Segmented?
The zero-energy buildings industry research report provides comprehensive data (region-wise segment analysis), with forecasts and estimates in "USD million" for the period 2026-2030, as well as historical data from 2020-2024 for the following segments.
- Source
- Solar energy
- Biogas
- Others
- Product
- Insulation and glazing
- HVAC and controls
- Lighting and controls
- Water heating
- Component
- Solutions and services
- Equipment
- Application
- Public and commercial buildings
- Residential buildings
- Geography
- North America
- US
- Canada
- Mexico
- APAC
- China
- Japan
- India
- Europe
- Germany
- UK
- France
- Middle East and Africa
- Saudi Arabia
- UAE
- South Africa
- South America
- Brazil
- Argentina
- Rest of World (ROW)
- North America
By Source Insights
The solar energy segment is estimated to witness significant growth during the forecast period.
Solar energy is the foundational power source for the global zero-energy buildings market 2026-2030, driven by the economic viability and technical maturity of photovoltaic systems.
The ability to integrate these systems directly into building envelopes, a practice known as building integrated photovoltaics, is central to achieving energy self-sufficiency and supporting decentralized energy resources.
Effective building energy management strategies leverage solar generation to offset consumption, which is critical for designs targeting passive house certification.
Advanced systems often pair solar arrays with high-efficiency variable refrigerant flow systems and energy recovery ventilation, creating a synergistic effect that minimizes grid dependence. For instance, integrated designs show a 35% improvement in load management.
The use of triple-glazed windows further reduces thermal loads, making solar a viable primary energy source and attracting green financing mechanisms.
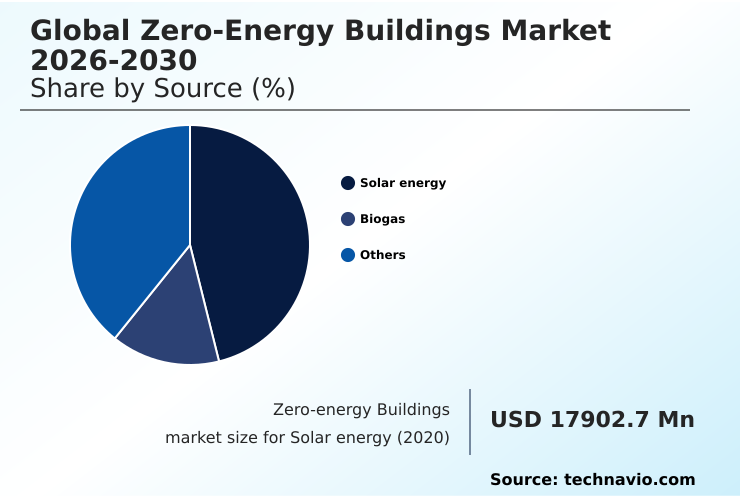
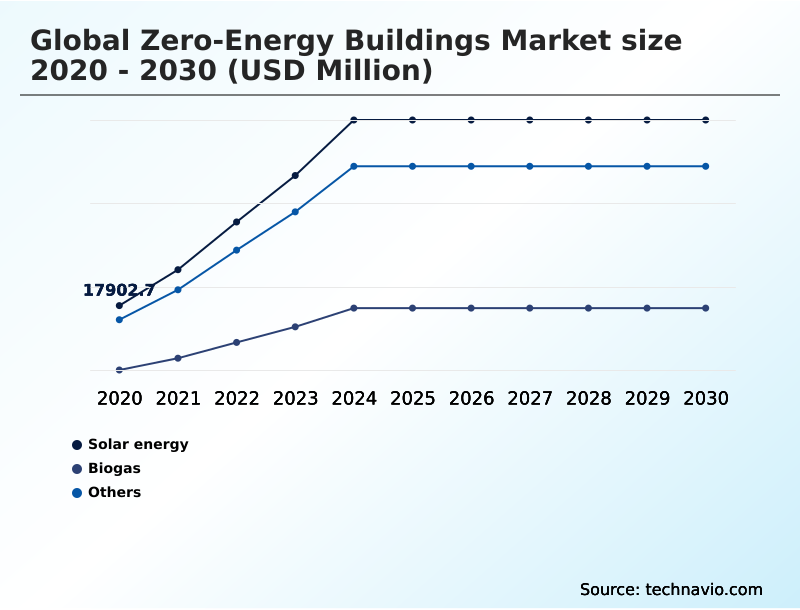
The Solar energy segment was valued at USD 53.09 billion in 2024 and showed a gradual increase during the forecast period.
Regional Analysis
APAC is estimated to contribute 31.9% to the growth of the global market during the forecast period.Technavio’s analysts have elaborately explained the regional trends and drivers that shape the market during the forecast period.
See How Zero-energy Buildings Market Demand is Rising in APAC Get Free Sample
The geographic landscape of the global zero-energy buildings market 2026-2030 is led by North America and APAC, which together account for over 63% of the market opportunity, driven by strong regulatory frameworks and government incentives.
In North America, the market is characterized by advanced framing solutions and widespread use of building information modeling to achieve net-zero operational targets.
Europe, with a 26.89% share, focuses on thermal bridging mitigation and passive design strategy, especially in retrofitting older buildings to meet new energy conservation mandates. Widespread adoption of low-emissivity coatings and aerogel insulation is critical in these regions.
The growth in APAC is fueled by new construction in urban centers, where prefabricated assembly and off-site manufacturing are gaining traction to meet demand.
Energy modeling simulation is crucial across all regions to validate designs, ensuring compliance with climate change mitigation goals.
Market Dynamics
Our researchers analyzed the data with 2025 as the base year, along with the key drivers, trends, and challenges. A holistic analysis of drivers will help companies refine their marketing strategies to gain a competitive advantage.
- Achieving true energy neutrality requires a sophisticated approach that extends beyond basic efficiency measures. For developers, understanding the nuances of high performance insulation for net-zero buildings is the first step, directly impacting long-term operational costs. This is closely linked to the selection of hvac controls for zero-energy building automation, which must be seamlessly integrated to prevent energy waste.
- The financial viability of these projects often hinges on a detailed analysis of building integrated photovoltaics cost vs efficiency, balancing upfront investment with energy generation potential. A critical consideration is the impact of embodied carbon on zero-energy goals, as material selection can negate operational savings.
- The development of grid interactive buildings for demand response programs creates new revenue streams and enhances grid stability, making projects more attractive to investors. However, accessing appropriate financing mechanisms for commercial zero-energy projects remains a hurdle. Here, technologies play a vital role; advanced glazing technologies for thermal performance can significantly reduce HVAC loads, improving the financial case.
- For existing structures, addressing zero-energy building retrofitting challenges and solutions is paramount, often requiring more creative and phased approaches than new builds. The effectiveness of these efforts is amplified by implementing passive design strategies for different climate zones, which can reduce energy needs by over 40% before any active systems are considered.
- Finally, conducting a thorough lifecycle assessment of zero-energy building materials ensures that sustainability claims are substantiated from creation to disposal.
What are the key market drivers leading to the rise in the adoption of Zero-energy Buildings Industry?
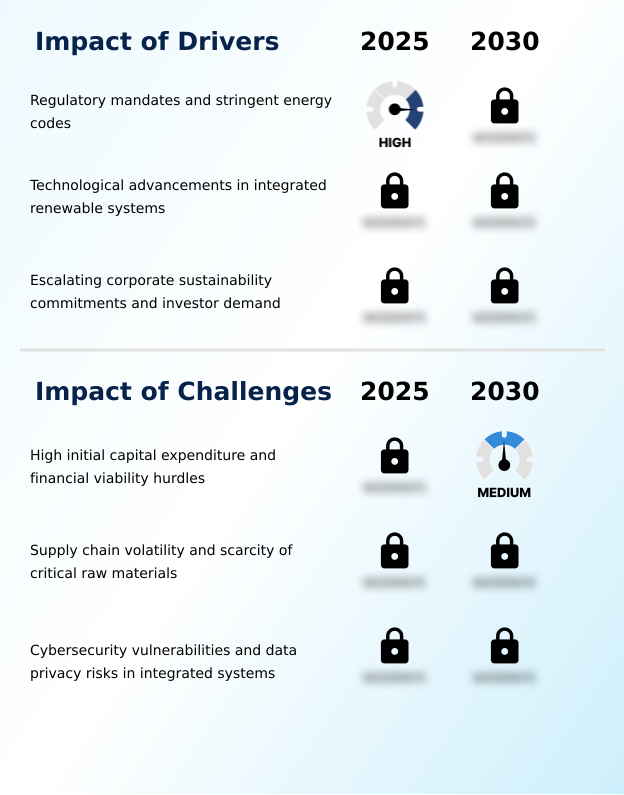
- Regulatory mandates and stringent energy codes are key drivers of the market, compelling developers to adopt net-zero standards.
- The global zero-energy buildings market 2026-2030 is propelled by regulatory frameworks mandating net-zero energy ready standards and technological advancements that enhance feasibility.
- The widespread adoption of intelligent building automation systems allows for real-time optimization of energy use, contributing to a 30% reduction in operational carbon reduction for compliant buildings.
- The focus on a high-performance building envelope, utilizing technologies such as phase-change thermal storage and advanced heat recovery ventilation, is critical to meeting the energy efficiency first principle. These measures drastically reduce the building performance gap between design and operation.
- As governments push for sustainable urban development, the demand for buildings that meet these stringent criteria has surged, creating a robust market for specialized materials and systems and accelerating innovation across the construction value chain.
What are the market trends shaping the Zero-energy Buildings Industry?
- The convergence of grid-interactive efficient buildings and demand response integration is emerging as a significant market trend. This evolution transforms structures into active grid assets, optimizing energy flow and enhancing stability.
- Key trends are reshaping the global zero-energy buildings market 2026-2030, moving beyond operational efficiency to holistic sustainability. The rise of the grid-interactive efficient building is central, transforming structures into resilient energy hubs that participate in demand response integration programs, which can reduce peak load on utilities by up to 15%.
- This is complemented by a strategic shift toward mitigating embodied carbon through whole life carbon assessment and circular construction principles. Innovations in digital twin technology allow for precise energy modeling, reducing the building performance gap by 20%. The adoption of smart glass technology further enhances energy management by dynamically controlling solar heat gain.
- These trends are supported by the growth of the energy-as-a-service model, which makes advanced technologies more accessible and accelerates the transition to a fully decarbonized built environment.
What challenges does the Zero-energy Buildings Industry face during its growth?
- High initial capital expenditure and financial viability hurdles present a key challenge affecting industry growth and widespread adoption.
- The primary challenges facing the global zero-energy buildings market 2026-2030 revolve around high initial costs and supply chain complexities. The upfront investment for high-performance sustainable building materials, such as mass timber construction and carbon-injected concrete, can be 10-15% higher than conventional materials.
- This financial barrier is compounded by the need for specialized equipment like geothermal heat pumps and advanced thermal glazing. Embodied carbon mitigation adds another layer of complexity, requiring sophisticated lifecycle assessments. While improved indoor environmental quality is a key benefit, quantifying its ROI remains a challenge for developers seeking green building certification.
- Furthermore, supply chain disruptions for structural insulated panels and other key components can lead to project delays, impacting financial models and adoption rates.
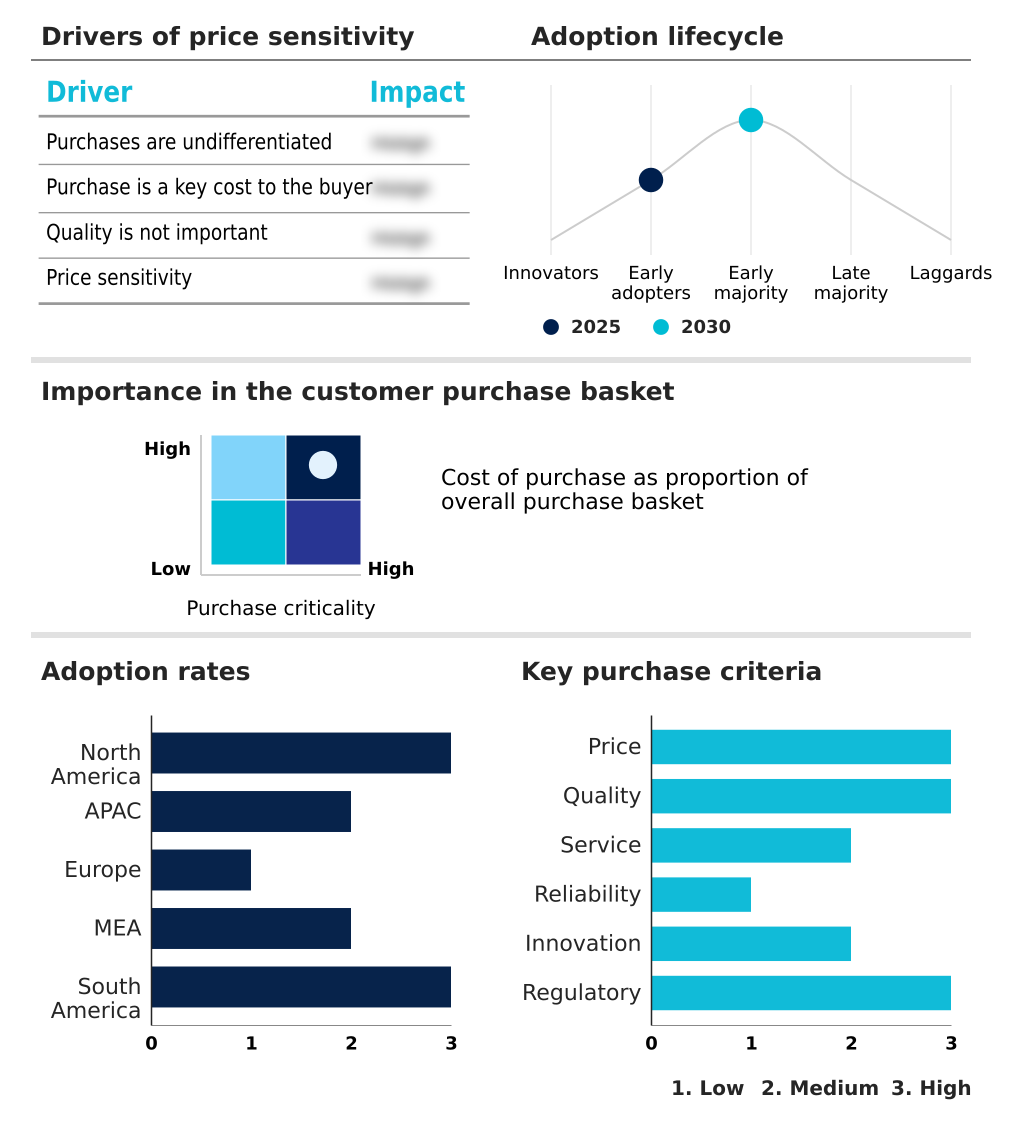
Exclusive Technavio Analysis on Customer Landscape
The zero-energy buildings market forecasting report includes the adoption lifecycle of the market, covering from the innovator’s stage to the laggard’s stage. It focuses on adoption rates in different regions based on penetration. Furthermore, the zero-energy buildings market report also includes key purchase criteria and drivers of price sensitivity to help companies evaluate and develop their market growth analysis strategies.
Customer Landscape of Zero-energy Buildings Industry
Competitive Landscape
Companies are implementing various strategies, such as strategic alliances, zero-energy buildings market forecast, partnerships, mergers and acquisitions, geographical expansion, and product/service launches, to enhance their presence in the industry.
ABB Ltd. - Offerings include smart electrification, energy management, and building automation technologies designed to optimize energy consumption and integrate renewable sources for enhanced building performance.
The industry research and growth report includes detailed analyses of the competitive landscape of the market and information about key companies, including:
- ABB Ltd.
- Carrier Global Corp.
- CertainTeed
- Cisco Systems Inc.
- Compagnie de Saint Gobain SA
- Daikin Industries Ltd.
- Eaton Corp. Plc
- Emerson Electric Co.
- General Electric Co.
- Hitachi Ltd.
- Honeywell International Inc.
- Johnson Controls International
- Kingspan Group Plc
- Legrand SA
- Lutron Electronics Co. Inc.
- Mitsubishi Electric Corp.
- Panasonic Holdings Corp.
- Schneider Electric SE
- Siemens AG
- Trane Technologies Plc
Qualitative and quantitative analysis of companies has been conducted to help clients understand the wider business environment as well as the strengths and weaknesses of key industry players. Data is qualitatively analyzed to categorize companies as pure play, category-focused, industry-focused, and diversified; it is quantitatively analyzed to categorize companies as dominant, leading, strong, tentative, and weak.
Recent Development and News in Zero-energy buildings market
- In August, 2024, Schneider Electric SE announced a strategic partnership with a leading architectural firm to co-develop a new digital twin platform for optimizing zero-energy building designs, aiming to reduce energy modeling time by 30%.
- In November, 2024, Johnson Controls International launched its next-generation building automation system, incorporating AI-driven predictive analytics to proactively manage HVAC and lighting systems, promising up to 20% in energy savings for commercial buildings.
- In February, 2025, the US Department of Energy announced the 'Net-Zero Accelerate' initiative, a $500 million funding program to support the development and deployment of innovative technologies for zero-energy retrofits in public and commercial buildings.
- In May, 2025, Siemens AG completed the acquisition of a specialized smart glass technology startup, integrating dynamic glazing solutions into its smart infrastructure portfolio to enhance control over solar heat gain in commercial structures.
Dive into Technavio’s robust research methodology, blending expert interviews, extensive data synthesis, and validated models for unparalleled Zero-energy Buildings Market insights. See full methodology.
| Market Scope | |
|---|---|
| Page number | 323 |
| Base year | 2025 |
| Historic period | 2020-2024 |
| Forecast period | 2026-2030 |
| Growth momentum & CAGR | Accelerate at a CAGR of 24.3% |
| Market growth 2026-2030 | USD 278700.4 million |
| Market structure | Fragmented |
| YoY growth 2025-2026(%) | 23.7% |
| Key countries | US, Canada, Mexico, China, Japan, India, South Korea, Australia, Indonesia, Germany, UK, France, Italy, Spain, The Netherlands, Saudi Arabia, UAE, South Africa, Israel, Turkey, Brazil, Argentina and Chile |
| Competitive landscape | Leading Companies, Market Positioning of Companies, Competitive Strategies, and Industry Risks |
Research Analyst Overview
- The zero-energy buildings market is maturing from a niche segment into a mainstream construction imperative, driven by the convergence of regulatory pressure and technological innovation. Core to this transformation is the integration of a high-performance building envelope with an intelligent building automation system.
- The market is defined by the application of advanced technologies, including triple-glazed windows with low-emissivity coatings, vacuum insulated panels for superior thermal resistance, and sophisticated heat recovery ventilation. Adopting a passive design strategy from the outset is crucial, utilizing building information modeling to optimize outcomes.
- The successful implementation of grid-interactive efficient building concepts, which depend on demand response integration, allows structures to function as active grid assets. Firms are achieving a 25% reduction in project lifecycle costs by using digital twin technology for simulation and a whole life carbon assessment for material selection, including mass timber construction and carbon-injected concrete.
- This comprehensive approach, essential for achieving passive house certification and securing green financing, aligns project development with long-term climate and investment objectives.
What are the Key Data Covered in this Zero-energy Buildings Market Research and Growth Report?
-
What is the expected growth of the Zero-energy Buildings Market between 2026 and 2030?
-
USD 278.70 billion, at a CAGR of 24.3%
-
-
What segmentation does the market report cover?
-
The report is segmented by Source (Solar energy, Biogas, and Others), Product (Insulation and glazing, HVAC and controls, Lighting and controls, and Water heating), Component (Solutions and services, and Equipment), Application (Public and commercial buildings, and Residential buildings) and Geography (North America, APAC, Europe, Middle East and Africa, South America)
-
-
Which regions are analyzed in the report?
-
North America, APAC, Europe, Middle East and Africa and South America
-
-
What are the key growth drivers and market challenges?
-
Regulatory mandates and stringent energy codes, High initial capital expenditure and financial viability hurdles
-
-
Who are the major players in the Zero-energy Buildings Market?
-
ABB Ltd., Carrier Global Corp., CertainTeed, Cisco Systems Inc., Compagnie de Saint Gobain SA, Daikin Industries Ltd., Eaton Corp. Plc, Emerson Electric Co., General Electric Co., Hitachi Ltd., Honeywell International Inc., Johnson Controls International, Kingspan Group Plc, Legrand SA, Lutron Electronics Co. Inc., Mitsubishi Electric Corp., Panasonic Holdings Corp., Schneider Electric SE, Siemens AG and Trane Technologies Plc
-
Market Research Insights
- Market dynamics are increasingly shaped by the push for building electrification and higher indoor environmental quality, compelling a shift toward integrated design and advanced technologies. The adoption of heat recovery ventilation systems, for example, improves air quality while reducing energy losses by over 75% in tightly sealed buildings.
- This pursuit of efficiency is bolstered by green financing mechanisms that favor projects with passive house certification, where a building performance gap is minimized through rigorous quality control. Such projects often see a 15% higher asset valuation compared to conventional constructions.
- Furthermore, the principles of sustainable urban development are driving demand for prefabricated assembly and off-site manufacturing, which can accelerate project timelines by up to 40% while ensuring superior construction quality and alignment with net-zero operational targets.
We can help! Our analysts can customize this zero-energy buildings market research report to meet your requirements.
 RIA -
RIA - 
