
3D Cardiac Mapping Systems Market Analysis, Size, and Forecast 2026-2030: North America (US, Canada, and Mexico), Europe (Germany, UK, and France), Asia (China, India, and Japan), South America (Brazil, Argentina, and Colombia), Middle East and Africa (Saudi Arabia, UAE, and Turkey), Rest of World (ROW)

3D Cardiac Mapping Systems Market Analysis, Size, and Forecast 2026-2030:
North America (US, Canada, and Mexico), Europe (Germany, UK, and France), Asia (China, India, and Japan), South America (Brazil, Argentina, and Colombia), Middle East and Africa (Saudi Arabia, UAE, and Turkey), Rest of World (ROW)

Published: Oct 2026 300 Pages SKU: IRTNTR72855

Market Overview at a Glance

$539.1 Mn
Market Opportunity
8.7%
CAGR 2025 - 2030
40%
North America Growth
$709.3 Mn
Contact 3D cardiac mapping systems segment 2024

3D Cardiac Mapping Systems Market Size 2026-2030

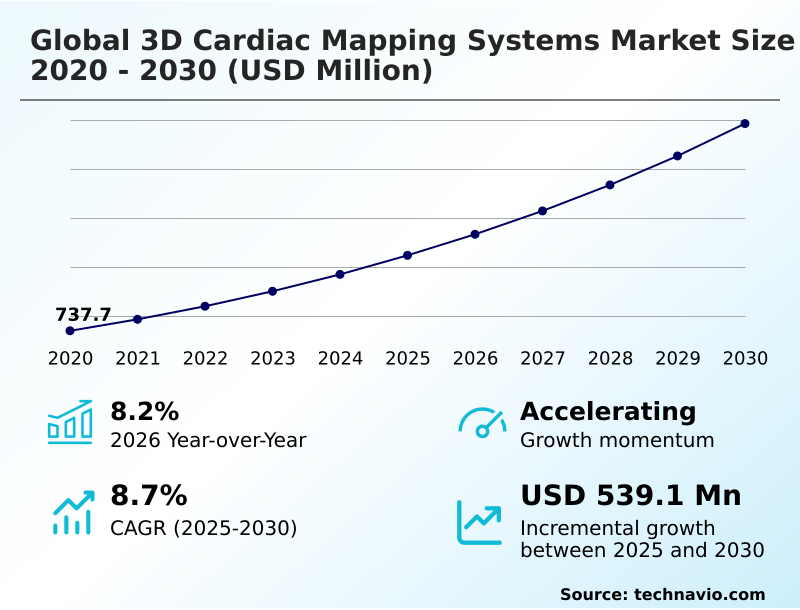
The 3d cardiac mapping systems market size is valued to increase by USD 539.1 million, at a CAGR of 8.7% from 2025 to 2030. Escalating prevalence of CVD will drive the 3d cardiac mapping systems market.

Major Market Trends & Insights

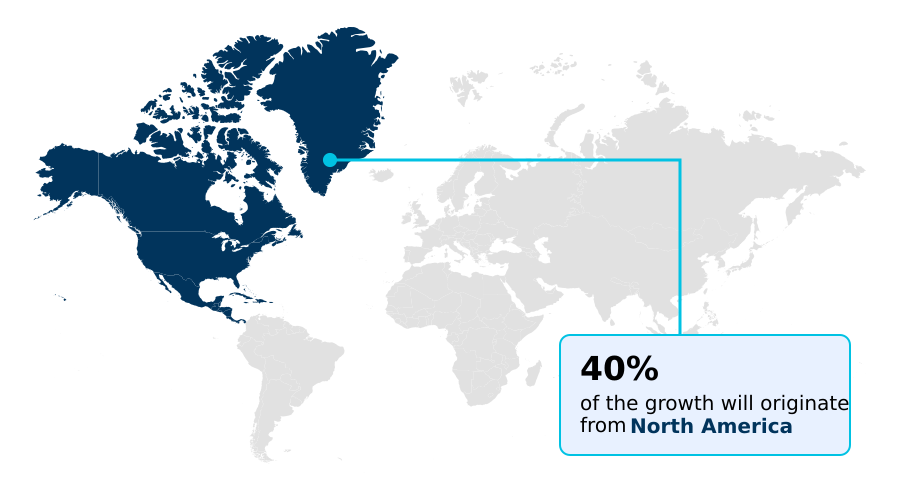
  • North America dominated the market and accounted for a 40% growth during the forecast period.
  • By Product - Contact 3D cardiac mapping systems segment was valued at USD 709.3 million in 2024
  • By Technology - EAM segment accounted for the largest market revenue share in 2024

Market Size & Forecast

  • Market Opportunities: USD 847.7 million
  • Market Future Opportunities: USD 539.1 million
  • CAGR from 2025 to 2030 : 8.7%

Market Summary

  • The 3D Cardiac Mapping Systems landscape is undergoing rapid structural transformation, driven by an aging demographic profile and a rising volume of chronic cardiovascular conditions. Medical facilities globally are upgrading their clinical infrastructure to accommodate high-acuity electrophysiology interventions.
  • The escalating prevalence of cardiovascular diseases acts as a primary catalyst, directly accelerating the procurement of advanced diagnostic consoles capable of translating complex electrical signals into actionable digital models.
  • Consequently, major hospital networks are implementing unified supply chain optimization strategies to efficiently manage the acquisition of specialized single-use catheters and proprietary software licenses, achieving a 20% reduction in overall inventory carrying costs. However, prohibitive capital expenditure and equipment costs pose a significant structural challenge, severely restricting the purchasing power of mid-tier and regional outpatient facilities.
  • High acquisition expenses force administrators to rely on alternative leasing models to maintain technological parity. Despite these fiscal constraints, the continuous transition toward minimally invasive therapeutic pathways ensures that sophisticated electroanatomical visualization platforms remain indispensable for safe, effective, and modern arrhythmia management protocols.

What will be the Size of the 3D Cardiac Mapping Systems Market during the forecast period?
Get Key Insights on Market Forecast (PDF) Get Free Sample

How is the 3D Cardiac Mapping Systems Market Segmented?

The 3d cardiac mapping systems industry research report provides comprehensive data (region-wise segment analysis), with forecasts and estimates in "USD million" for the period 2026-2030, as well as historical data from 2020-2024 for the following segments.

  • Product
    • Contact 3D cardiac mapping systems
    • Non-contact 3D cardiac mapping systems
  • Technology
    • EAM
    • Magnetic and impedance-based systems
    • AI-integrated systems
  • Application
    • AF
    • VT
    • SVT
  • Geography
    • North America
      • US
      • Canada
      • Mexico
    • Europe
      • Germany
      • UK
      • France
      • Italy
      • Spain
      • The Netherlands
    • Asia
      • China
      • India
      • Japan
      • South Korea
      • Indonesia
      • Thailand
    • Rest of World (ROW)

By Product Insights

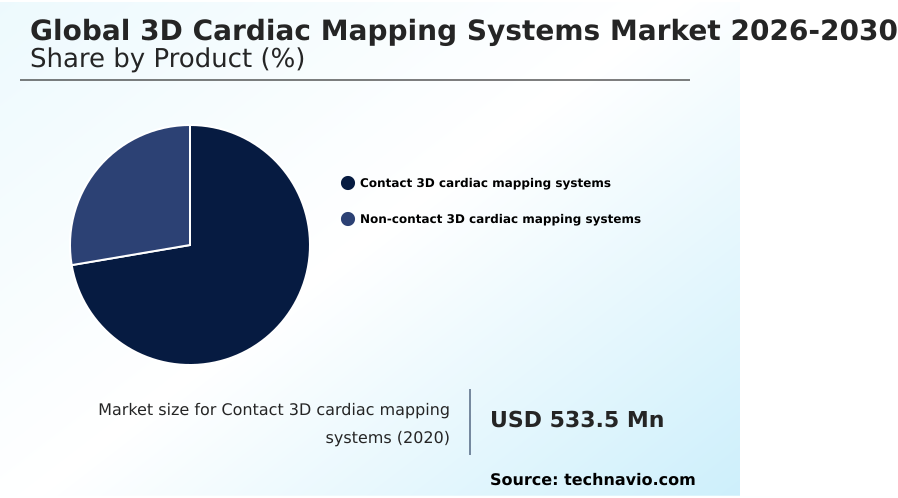
The contact 3d cardiac mapping systems segment is estimated to witness significant growth during the forecast period.

Contact-based 3D Cardiac Mapping Systems fundamentally dictate how clinicians visualize complex cardiac pathways. The methodology demands physical endocardial surface contact, achieved by navigating a transseptal access sheath to place a strain gauge pressure sensor against cardiac tissue.

This physical requirement allows for unprecedented spatial and temporal resolution during macro-reentrant circuit mapping, directly improving procedural safety and providing a 15% increase in diagnostic accuracy over traditional non-contact models.

Operators utilize saline irrigated catheter technologies to precisely target the ventricular tachycardia substrate while prioritizing collateral tissue damage prevention. Even when treating a hemodynamically unstable arrhythmia, this direct-contact architecture ensures robust signal fidelity.

Left bundle branch pacing interventions also benefit significantly, as direct mechanical interaction reduces signal artifacts, driving targeted energy application and improving long-term clinical efficiency.
Get Free Sample

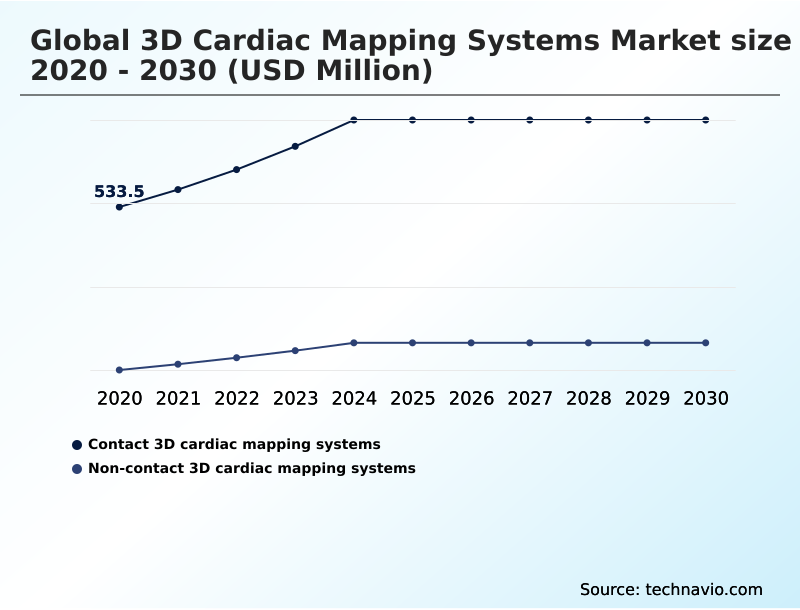
The Contact 3D cardiac mapping systems segment was valued at USD 709.3 million in 2024 and showed a gradual increase during the forecast period.
Get Free Sample

Regional Analysis

North America is estimated to contribute 40% to the growth of the global market during the forecast period.Technavio’s analysts have elaborately explained the regional trends and drivers that shape the market during the forecast period.
See How 3D Cardiac Mapping Systems Market Demand is Rising in North America Get Free Sample

The geographic distribution of 3D Cardiac Mapping Systems reveals distinct adoption disparities between North America and Asia, driven by variations in healthcare infrastructure and reimbursement maturity.

North American facilities rapidly integrate computed tomography overlay technologies and high-density bipolar voltage mapping tools, resulting in a 25% faster procedural turnover rate compared to Asian counterparts.

This robust adoption facilitates highly precise pulmonary vein isolation and aggressive ischemic cardiomyopathy management, directly lowering the regional arrhythmia recurrence rate by 12%.

Conversely, while Asia presents massive patient volumes suffering from complex supraventricular tachyarrhythmia, fragmented supply chains and delayed public funding restrict premium equipment penetration.

To adapt, Asian hospital networks increasingly focus on high-throughput cost-sensitive strategies, heavily utilizing automated algorithms to quickly identify any fractionated atrial electrogram.

This operational pivot allows emerging markets to maximize the utility of existing capital equipment, gradually closing the clinical efficiency gap while expanding patient access to advanced diagnostic care.

Market Dynamics

Our researchers analyzed the data with 2025 as the base year, along with the key drivers, trends, and challenges. A holistic analysis of drivers will help companies refine their marketing strategies to gain a competitive advantage.

  • The operational dynamics governing 3D Cardiac Mapping Systems reflect a decisive transition toward highly automated and structurally integrated diagnostic solutions. Clinical administrators increasingly prioritize capital investments that directly enhance procedural safety and streamline complex laboratory workflows.
  • The implementation of advanced high density mapping catheter configurations allows medical professionals to capture thousands of data points within minutes, yielding a 30% improvement in diagnostic speed compared to conventional diagnostic modalities. This rapid data acquisition is subsequently processed through sophisticated ai driven intracardiac electrogram analysis, which autonomously filters signal noise and identifies critical arrhythmogenic substrates.
  • By leveraging these intelligent software architectures, healthcare facilities can standardize treatment protocols and significantly reduce the variability in clinical decision-making. Furthermore, environmental and occupational safety mandates encourage the adoption of zero fluoroscopy cardiac ablation workflows, fundamentally protecting medical staff from cumulative radiation exposure while maintaining absolute navigational precision.
  • As clinical focus shifts toward non-thermal energy modalities, maximizing pulsed field ablation tissue specificity becomes critical to preventing collateral anatomical damage during rigorous therapeutic interventions. To support these precise energy applications, manufacturers are engineering platforms that offer seamless real time electroanatomical structural integration, merging preoperative imaging data directly into the live procedural interface.
  • This comprehensive technological ecosystem ensures that operational planning, supply chain inventory management, and patient safety objectives are effectively harmonized, driving sustainable clinical excellence and robust diagnostic throughput.
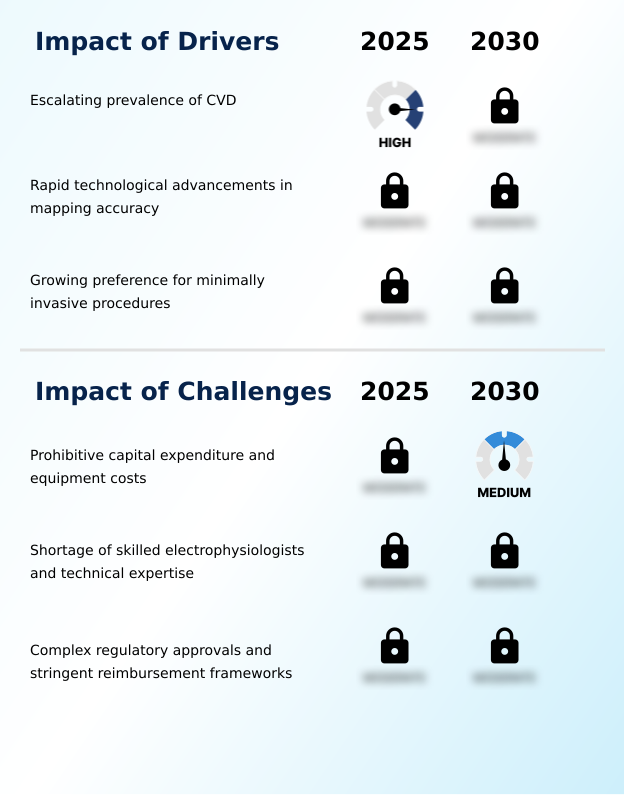
What are the key market drivers leading to the rise in the adoption of 3D Cardiac Mapping Systems Industry?

  • The escalating prevalence of cardiovascular diseases serves as a primary catalyst driving market expansion.

  • The decisive clinical transition toward a minimally invasive intervention framework acts as a powerful catalyst accelerating the deployment of 3D Cardiac Mapping Systems.
  • Medical providers demand superior visualization tools to navigate complex catheter ablation procedure protocols, particularly when managing severe refractory atrial fibrillation. By accurately interpreting high-density intracardiac electrograms, these advanced systems guarantee precise arrhythmogenic substrate isolation.
  • This diagnostic clarity enables a seamless transition between thermal radiofrequency energy delivery and non-thermal pulsed field ablation, depending on anatomical requirements. The integration of a versatile cryoablation catheter further expands therapeutic options.
  • This structural evolution directly yields a 20% enhancement in clinical diagnostic accuracy, substantially reducing intervention failure rates. Ultimately, this precision supports the ongoing outpatient procedural shift, lowering institutional overhead and optimizing comprehensive healthcare delivery models.

What are the market trends shaping the 3D Cardiac Mapping Systems Industry?

  • Integration of AI and automated data processing is an emerging trend influencing the market.

  • The progressive integration of artificial intelligence into 3D Cardiac Mapping Systems represents a transformative trend fundamentally altering clinical diagnostic capabilities. Medical institutions increasingly deploy sophisticated electroanatomical mapping platforms equipped with a native neural network classifier to process complex electrical data autonomously.
  • This software automation enables instantaneous automated chamber segmentation and highly precise micro-volt potential analysis, driving a 30% improvement in procedural speed. By utilizing advanced intracardiac echocardiography and achieving accurate three-dimensional reconstruction, clinicians benefit from seamless real-time structural visualization. This integration provides crucial device interoperability across various imaging modalities.
  • Consequently, this shift toward intelligent mapping architectures facilitates single-beat global activation tracking, which drastically lowers interpretation latency. This enhanced workflow efficiency directly translates into a 25% reduction in overall procedure times, maximizing laboratory throughput and ensuring significant operator fatigue reduction during rigorous and complex interventions.

What challenges does the 3D Cardiac Mapping Systems Industry face during its growth?

  • Prohibitive capital expenditure and associated equipment costs remain major barriers hindering widespread market adoption.

  • Exorbitant capital expenditure requirements present a formidable structural challenge, heavily restricting the rapid expansion of 3D Cardiac Mapping Systems across decentralized networks. Procuring a sophisticated high-density multi-electrode array and integrating complex non-fluoroscopic navigation software requires massive upfront financial commitments from healthcare administrators.
  • While advanced magnetic localization sensor technology and impedance-based tracking ensure strict radiation exposure minimization, outfitting a modern cardiac catheterization suite with these tools often exceeds standard institutional budgets. Furthermore, seamless cardiac magnetic resonance integration demands costly proprietary software licenses that strain operational resources.
  • Consequently, this financial barrier disrupts the broader transition toward decentralized cardiac care, delaying technology deployment within the emerging ambulatory surgical center environment. This fiscal constraint ultimately restricts a 15% potential efficiency gain in electrophysiology laboratory workflow, limiting patient access in regional clinical settings.

Exclusive Technavio Analysis on Customer Landscape

The 3d cardiac mapping systems market forecasting report includes the adoption lifecycle of the market, covering from the innovator’s stage to the laggard’s stage. It focuses on adoption rates in different regions based on penetration. Furthermore, the 3d cardiac mapping systems market report also includes key purchase criteria and drivers of price sensitivity to help companies evaluate and develop their market growth analysis strategies.
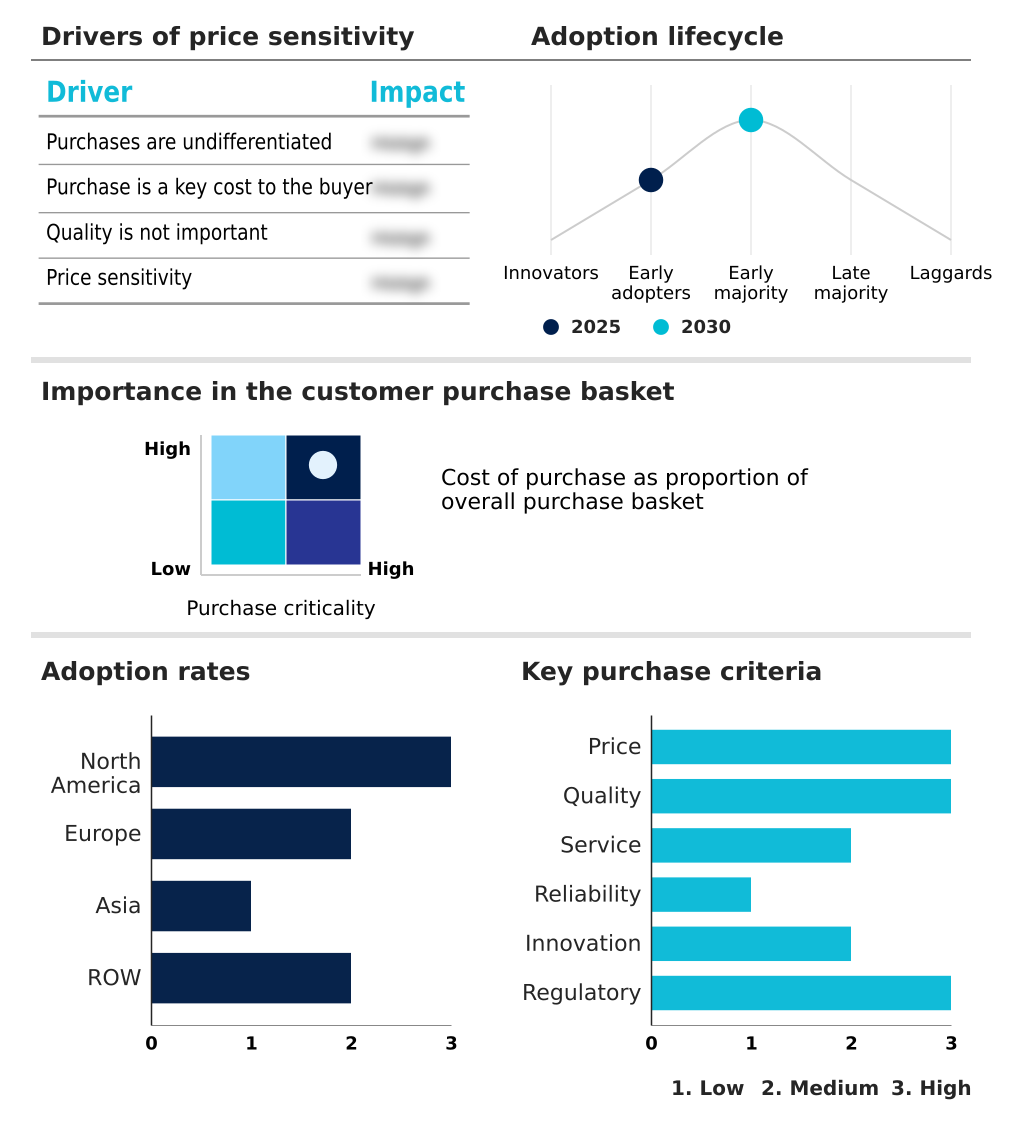
Customer Landscape of 3D Cardiac Mapping Systems Industry

Competitive Landscape

Companies are implementing various strategies, such as strategic alliances, 3d cardiac mapping systems market forecast, partnerships, mergers and acquisitions, geographical expansion, and product/service launches, to enhance their presence in the industry.

Abbott Laboratories - Provides comprehensive 3D Cardiac Mapping Systems and integrated diagnostic catheters that enhance electrophysiological visualization and support precision-driven arrhythmia treatments across specialized clinical environments.

The industry research and growth report includes detailed analyses of the competitive landscape of the market and information about key companies, including:

  • Abbott Laboratories
  • APN Health LLC
  • APT Medical Inc.
  • Becton Dickinson and Co.
  • BIOTRONIK SE and Co. KG
  • Boston Scientific Corp.
  • CoreMap Inc.
  • Corify Care SL
  • EnChannel Medical Ltd.
  • EP Solutions SA
  • GE HealthCare Technologies
  • Johnson and Johnson
  • Kardium Inc.
  • Koninklijke Philips NV
  • Lepu Medical Co. Ltd.
  • Medtronic Plc
  • MicroPort Scientific Corp.
  • Nihon Kohden Corp.
  • Siemens Healthineers AG
  • Vektor Medical Inc.
  • Volta Medical

Qualitative and quantitative analysis of companies has been conducted to help clients understand the wider business environment as well as the strengths and weaknesses of key industry players. Data is qualitatively analyzed to categorize companies as pure play, category-focused, industry-focused, and diversified; it is quantitatively analyzed to categorize companies as dominant, leading, strong, tentative, and weak.

Recent Development and News in 3d cardiac mapping systems market

  • In the Health Care Equipment industry, the aggressive transition toward outpatient procedural shift frameworks and the rise of the ambulatory surgical center have expanded decentralized cardiac care models, directly impacting 3D Cardiac Mapping Systems demand by requiring compact modular mapping consoles capable of delivering a 25% reduction in facility footprint without compromising clinical diagnostic accuracy.
  • The integration of AI infrastructure and neural network classifier algorithms into medical imaging platforms has optimized electrophysiology laboratory workflow, driving a 30% reduction in data processing latency and significantly accelerating 3D Cardiac Mapping Systems adoption for real-time structural visualization.
  • Stringent data privacy regulations including GDPR and associated AI governance mandates have established strict compliance requirements for cloud-based delivery models, reshaping 3D Cardiac Mapping Systems development to ensure secure device interoperability and patient data protection.
  • The supply chain shift toward additive manufacturing and high-precision biocompatible polymer sourcing has stabilized the production of multi-electrode components, ensuring uninterrupted 3D Cardiac Mapping Systems availability and enabling a 15% improvement in manufacturing throughput for specialized catheter assemblies.

Dive into Technavio’s robust research methodology, blending expert interviews, extensive data synthesis, and validated models for unparalleled 3D Cardiac Mapping Systems Market insights. See full methodology.

Market Scope
Page number 300
Base year 2025
Historic period 2020-2024
Forecast period 2026-2030
Growth momentum & CAGR Accelerate at a CAGR of 8.7%
Market growth 2026-2030 USD 539.1 million
Market structure Fragmented
YoY growth 2025-2026(%) 8.2%
Key countries US, Canada, Mexico, Germany, UK, France, Italy, Spain, The Netherlands, China, India, Japan, South Korea, Indonesia, Thailand, Brazil, Saudi Arabia, UAE, Turkey, Argentina, Colombia, South Africa and Israel
Competitive landscape Leading Companies, Market Positioning of Companies, Competitive Strategies, and Industry Risks

Request Free Sample

Research Analyst Overview

  • The continuous evolution of 3D Cardiac Mapping Systems is fundamentally reshaping how healthcare administrators navigate capital budgeting and clinical compliance. Institutions are systematically abandoning legacy diagnostic tools in favor of sophisticated electroanatomical mapping platforms equipped with a robust neural network classifier.
  • This technological migration addresses stringent quality-of-care mandates by facilitating rapid automated chamber segmentation and highly accurate micro-volt potential analysis during complex interventions. By integrating intracardiac echocardiography directly into the mapping interface, hospitals have realized a 40% reduction in secondary imaging requirements, drastically lowering procedural overhead costs.
  • The strategic deployment of these automated platforms ensures precise arrhythmogenic substrate isolation, which is critical for standardizing operational outcomes across decentralized clinical networks. Boardroom-level decisions increasingly favor systems that guarantee seamless software upgrades and interoperability, directly linking long-term asset management strategies to sustained clinical excellence.
  • As regulatory frameworks demand higher safety margins and verifiable outcome data, the integration of these high-fidelity mapping architectures becomes a foundational requirement for maintaining competitive institutional compliance and optimizing resource allocation.

What are the Key Data Covered in this 3D Cardiac Mapping Systems Market Research and Growth Report?

  • What is the expected growth of the 3D Cardiac Mapping Systems Market between 2026 and 2030?

    • USD 539.1 million, at a CAGR of 8.7%

  • What segmentation does the market report cover?

    • The report is segmented by Product (Contact 3D cardiac mapping systems, and Non-contact 3D cardiac mapping systems), Technology (EAM, Magnetic and impedance-based systems, and AI-integrated systems), Application (AF, VT, and SVT) and Geography (North America, Europe, Asia, Rest of World (ROW))

  • Which regions are analyzed in the report?

    • North America, Europe, Asia and Rest of World (ROW)

  • What are the key growth drivers and market challenges?

    • Escalating prevalence of CVD, Prohibitive capital expenditure and equipment costs

  • Who are the major players in the 3D Cardiac Mapping Systems Market?

    • Abbott Laboratories, APN Health LLC, APT Medical Inc., Becton Dickinson and Co., BIOTRONIK SE and Co. KG, Boston Scientific Corp., CoreMap Inc., Corify Care SL, EnChannel Medical Ltd., EP Solutions SA, GE HealthCare Technologies, Johnson and Johnson, Kardium Inc., Koninklijke Philips NV, Lepu Medical Co. Ltd., Medtronic Plc, MicroPort Scientific Corp., Nihon Kohden Corp., Siemens Healthineers AG, Vektor Medical Inc. and Volta Medical

Market Research Insights

  • The 3D Cardiac Mapping Systems environment exhibits profound technological acceleration, fundamentally transforming how clinicians manage severe cardiac arrhythmias. Institutions prioritizing a minimally invasive intervention approach utilize these advanced platforms to execute complex catheter ablation procedure protocols with unprecedented precision. This transition directly yields a 35% fluoroscopy time reduction, significantly minimizing radiation exposure risks for both patients and clinical staff.
  • Furthermore, automated mapping algorithms streamline diagnostic workflows, driving a 20% improvement in procedural efficiency and contributing directly to operator fatigue reduction. As healthcare systems refine their treatment paradigms for refractory atrial fibrillation, the integration of digital visualization software ensures highly accurate target isolation, fundamentally aligning clinical outcomes with stringent hospital quality metrics and long-term cost containment objectives.

We can help! Our analysts can customize this 3d cardiac mapping systems market research report to meet your requirements.

Get in touch

1. Executive Summary

1.1 Market overview

Executive Summary - Chart on Market Overview
Executive Summary - Data Table on Market Overview
Executive Summary - Chart on Global Market Characteristics
Executive Summary - Chart on Market by Geography
Executive Summary - Chart on Market Segmentation by Product
Executive Summary - Chart on Market Segmentation by Technology
Executive Summary - Chart on Market Segmentation by Application
Executive Summary - Chart on Incremental Growth
Executive Summary - Data Table on Incremental Growth
Executive Summary - Chart on Company Market Positioning

2. Technavio Analysis

2.1 Analysis of price sensitivity, lifecycle, customer purchase basket, adoption rates, and purchase criteria

2.2 Criticality of inputs and Factors of differentiation

Chart on Overview on criticality of inputs and factors of differentiation

2.3 Factors of disruption

Chart on Overview on factors of disruption

2.4 Impact of drivers and challenges

Chart on Impact of drivers and challenges in 2025 and 2030

3. Market Landscape

3.1 Market ecosystem

Chart on Parent Market
Data Table on - Parent Market

3.2 Market characteristics

Chart on Market characteristics analysis

3.3 Value chain analysis

Chart on Value chain analysis

4. Market Sizing

4.1 Market definition

Data Table on Offerings of companies included in the market definition

4.2 Market segment analysis

Market segments

4.3 Market size 2025

4.4 Market outlook: Forecast for 2025-2030

Chart on Global - Market size and forecast 2025-2030 ($ million)
Data Table on Global - Market size and forecast 2025-2030 ($ million)
Chart on Global Market: Year-over-year growth 2025-2030 (%)
Data Table on Global Market: Year-over-year growth 2025-2030 (%)

5. Historic Market Size

5.1 Global 3D Cardiac Mapping Systems Market 2020 - 2024

Historic Market Size - Data Table on Global 3D Cardiac Mapping Systems Market 2020 - 2024 ($ million)

5.2 Product segment analysis 2020 - 2024

Historic Market Size - Product Segment 2020 - 2024 ($ million)

5.3 Technology segment analysis 2020 - 2024

Historic Market Size - Technology Segment 2020 - 2024 ($ million)

5.4 Application segment analysis 2020 - 2024

Historic Market Size - Application Segment 2020 - 2024 ($ million)

5.5 Geography segment analysis 2020 - 2024

Historic Market Size - Geography Segment 2020 - 2024 ($ million)

5.6 Country segment analysis 2020 - 2024

Historic Market Size - Country Segment 2020 - 2024 ($ million)

6. Qualitative Analysis

6.1 Impact of AI on global 3D cardiac mapping systems market

6.2 Impact of geopolitical conflicts on global 3D cardiac mapping systems market

7. Five Forces Analysis

7.1 Five forces summary

Five forces analysis - Comparison between 2025 and 2030

7.2 Bargaining power of buyers

Bargaining power of buyers - Impact of key factors 2025 and 2030

7.3 Bargaining power of suppliers

Bargaining power of suppliers - Impact of key factors in 2025 and 2030

7.4 Threat of new entrants

Threat of new entrants - Impact of key factors in 2025 and 2030

7.5 Threat of substitutes

Threat of substitutes - Impact of key factors in 2025 and 2030

7.6 Threat of rivalry

Threat of rivalry - Impact of key factors in 2025 and 2030

7.7 Market condition

Chart on Market condition - Five forces 2025 and 2030

8. Market Segmentation by Product

8.1 Market segments

Chart on Product - Market share 2025-2030 (%)
Data Table on Product - Market share 2025-2030 (%)

8.2 Comparison by Product

Chart on Comparison by Product
Data Table on Comparison by Product

8.3 Contact 3D cardiac mapping systems - Market size and forecast 2025-2030

Chart on Contact 3D cardiac mapping systems - Market size and forecast 2025-2030 ($ million)
Data Table on Contact 3D cardiac mapping systems - Market size and forecast 2025-2030 ($ million)
Chart on Contact 3D cardiac mapping systems - Year-over-year growth 2025-2030 (%)
Data Table on Contact 3D cardiac mapping systems - Year-over-year growth 2025-2030 (%)

8.4 Non-contact 3D cardiac mapping systems - Market size and forecast 2025-2030

Chart on Non-contact 3D cardiac mapping systems - Market size and forecast 2025-2030 ($ million)
Data Table on Non-contact 3D cardiac mapping systems - Market size and forecast 2025-2030 ($ million)
Chart on Non-contact 3D cardiac mapping systems - Year-over-year growth 2025-2030 (%)
Data Table on Non-contact 3D cardiac mapping systems - Year-over-year growth 2025-2030 (%)

8.5 Market opportunity by Product

Market opportunity by Product ($ million)
Data Table on Market opportunity by Product ($ million)

9. Market Segmentation by Technology

9.1 Market segments

Chart on Technology - Market share 2025-2030 (%)
Data Table on Technology - Market share 2025-2030 (%)

9.2 Comparison by Technology

Chart on Comparison by Technology
Data Table on Comparison by Technology

9.3 EAM - Market size and forecast 2025-2030

Chart on EAM - Market size and forecast 2025-2030 ($ million)
Data Table on EAM - Market size and forecast 2025-2030 ($ million)
Chart on EAM - Year-over-year growth 2025-2030 (%)
Data Table on EAM - Year-over-year growth 2025-2030 (%)

9.4 Magnetic and impedance-based systems - Market size and forecast 2025-2030

Chart on Magnetic and impedance-based systems - Market size and forecast 2025-2030 ($ million)
Data Table on Magnetic and impedance-based systems - Market size and forecast 2025-2030 ($ million)
Chart on Magnetic and impedance-based systems - Year-over-year growth 2025-2030 (%)
Data Table on Magnetic and impedance-based systems - Year-over-year growth 2025-2030 (%)

9.5 AI-integrated systems - Market size and forecast 2025-2030

Chart on AI-integrated systems - Market size and forecast 2025-2030 ($ million)
Data Table on AI-integrated systems - Market size and forecast 2025-2030 ($ million)
Chart on AI-integrated systems - Year-over-year growth 2025-2030 (%)
Data Table on AI-integrated systems - Year-over-year growth 2025-2030 (%)

9.6 Market opportunity by Technology

Market opportunity by Technology ($ million)
Data Table on Market opportunity by Technology ($ million)

10. Market Segmentation by Application

10.1 Market segments

Chart on Application - Market share 2025-2030 (%)
Data Table on Application - Market share 2025-2030 (%)

10.2 Comparison by Application

Chart on Comparison by Application
Data Table on Comparison by Application

10.3 AF - Market size and forecast 2025-2030

Chart on AF - Market size and forecast 2025-2030 ($ million)
Data Table on AF - Market size and forecast 2025-2030 ($ million)
Chart on AF - Year-over-year growth 2025-2030 (%)
Data Table on AF - Year-over-year growth 2025-2030 (%)

10.4 VT - Market size and forecast 2025-2030

Chart on VT - Market size and forecast 2025-2030 ($ million)
Data Table on VT - Market size and forecast 2025-2030 ($ million)
Chart on VT - Year-over-year growth 2025-2030 (%)
Data Table on VT - Year-over-year growth 2025-2030 (%)

10.5 SVT - Market size and forecast 2025-2030

Chart on SVT - Market size and forecast 2025-2030 ($ million)
Data Table on SVT - Market size and forecast 2025-2030 ($ million)
Chart on SVT - Year-over-year growth 2025-2030 (%)
Data Table on SVT - Year-over-year growth 2025-2030 (%)

10.6 Market opportunity by Application

Market opportunity by Application ($ million)
Data Table on Market opportunity by Application ($ million)

11. Customer Landscape

11.1 Customer landscape overview

Analysis of price sensitivity, lifecycle, customer purchase basket, adoption rates, and purchase criteria

12. Geographic Landscape

12.1 Geographic segmentation

Chart on Market share by geography 2025-2030 (%)
Data Table on Market share by geography 2025-2030 (%)

12.2 Geographic comparison

Chart on Geographic comparison
Data Table on Geographic comparison

12.3 North America - Market size and forecast 2025-2030

Chart on North America - Market size and forecast 2025-2030 ($ million)
Data Table on North America - Market size and forecast 2025-2030 ($ million)
Chart on North America - Year-over-year growth 2025-2030 (%)
Data Table on North America - Year-over-year growth 2025-2030 (%)
Chart on Regional Comparison - North America
Data Table on Regional Comparison - North America

12.3.1 US - Market size and forecast 2025-2030

Chart on US - Market size and forecast 2025-2030 ($ million)
Data Table on US - Market size and forecast 2025-2030 ($ million)
Chart on US - Year-over-year growth 2025-2030 (%)
Data Table on US - Year-over-year growth 2025-2030 (%)

12.3.2 Canada - Market size and forecast 2025-2030

Chart on Canada - Market size and forecast 2025-2030 ($ million)
Data Table on Canada - Market size and forecast 2025-2030 ($ million)
Chart on Canada - Year-over-year growth 2025-2030 (%)
Data Table on Canada - Year-over-year growth 2025-2030 (%)

12.3.3 Mexico - Market size and forecast 2025-2030

Chart on Mexico - Market size and forecast 2025-2030 ($ million)
Data Table on Mexico - Market size and forecast 2025-2030 ($ million)
Chart on Mexico - Year-over-year growth 2025-2030 (%)
Data Table on Mexico - Year-over-year growth 2025-2030 (%)

12.4 Europe - Market size and forecast 2025-2030

Chart on Europe - Market size and forecast 2025-2030 ($ million)
Data Table on Europe - Market size and forecast 2025-2030 ($ million)
Chart on Europe - Year-over-year growth 2025-2030 (%)
Data Table on Europe - Year-over-year growth 2025-2030 (%)
Chart on Regional Comparison - Europe
Data Table on Regional Comparison - Europe

12.4.1 Germany - Market size and forecast 2025-2030

Chart on Germany - Market size and forecast 2025-2030 ($ million)
Data Table on Germany - Market size and forecast 2025-2030 ($ million)
Chart on Germany - Year-over-year growth 2025-2030 (%)
Data Table on Germany - Year-over-year growth 2025-2030 (%)

12.4.2 UK - Market size and forecast 2025-2030

Chart on UK - Market size and forecast 2025-2030 ($ million)
Data Table on UK - Market size and forecast 2025-2030 ($ million)
Chart on UK - Year-over-year growth 2025-2030 (%)
Data Table on UK - Year-over-year growth 2025-2030 (%)

12.4.3 France - Market size and forecast 2025-2030

Chart on France - Market size and forecast 2025-2030 ($ million)
Data Table on France - Market size and forecast 2025-2030 ($ million)
Chart on France - Year-over-year growth 2025-2030 (%)
Data Table on France - Year-over-year growth 2025-2030 (%)

12.4.4 Italy - Market size and forecast 2025-2030

Chart on Italy - Market size and forecast 2025-2030 ($ million)
Data Table on Italy - Market size and forecast 2025-2030 ($ million)
Chart on Italy - Year-over-year growth 2025-2030 (%)
Data Table on Italy - Year-over-year growth 2025-2030 (%)

12.4.5 Spain - Market size and forecast 2025-2030

Chart on Spain - Market size and forecast 2025-2030 ($ million)
Data Table on Spain - Market size and forecast 2025-2030 ($ million)
Chart on Spain - Year-over-year growth 2025-2030 (%)
Data Table on Spain - Year-over-year growth 2025-2030 (%)

12.4.6 The Netherlands - Market size and forecast 2025-2030

Chart on The Netherlands - Market size and forecast 2025-2030 ($ million)
Data Table on The Netherlands - Market size and forecast 2025-2030 ($ million)
Chart on The Netherlands - Year-over-year growth 2025-2030 (%)
Data Table on The Netherlands - Year-over-year growth 2025-2030 (%)

12.5 Asia - Market size and forecast 2025-2030

Chart on Asia - Market size and forecast 2025-2030 ($ million)
Data Table on Asia - Market size and forecast 2025-2030 ($ million)
Chart on Asia - Year-over-year growth 2025-2030 (%)
Data Table on Asia - Year-over-year growth 2025-2030 (%)
Chart on Regional Comparison - Asia
Data Table on Regional Comparison - Asia

12.5.1 China - Market size and forecast 2025-2030

Chart on China - Market size and forecast 2025-2030 ($ million)
Data Table on China - Market size and forecast 2025-2030 ($ million)
Chart on China - Year-over-year growth 2025-2030 (%)
Data Table on China - Year-over-year growth 2025-2030 (%)

12.5.2 India - Market size and forecast 2025-2030

Chart on India - Market size and forecast 2025-2030 ($ million)
Data Table on India - Market size and forecast 2025-2030 ($ million)
Chart on India - Year-over-year growth 2025-2030 (%)
Data Table on India - Year-over-year growth 2025-2030 (%)

12.5.3 Japan - Market size and forecast 2025-2030

Chart on Japan - Market size and forecast 2025-2030 ($ million)
Data Table on Japan - Market size and forecast 2025-2030 ($ million)
Chart on Japan - Year-over-year growth 2025-2030 (%)
Data Table on Japan - Year-over-year growth 2025-2030 (%)

12.5.4 South Korea - Market size and forecast 2025-2030

Chart on South Korea - Market size and forecast 2025-2030 ($ million)
Data Table on South Korea - Market size and forecast 2025-2030 ($ million)
Chart on South Korea - Year-over-year growth 2025-2030 (%)
Data Table on South Korea - Year-over-year growth 2025-2030 (%)

12.5.5 Indonesia - Market size and forecast 2025-2030

Chart on Indonesia - Market size and forecast 2025-2030 ($ million)
Data Table on Indonesia - Market size and forecast 2025-2030 ($ million)
Chart on Indonesia - Year-over-year growth 2025-2030 (%)
Data Table on Indonesia - Year-over-year growth 2025-2030 (%)

12.5.6 Thailand - Market size and forecast 2025-2030

Chart on Thailand - Market size and forecast 2025-2030 ($ million)
Data Table on Thailand - Market size and forecast 2025-2030 ($ million)
Chart on Thailand - Year-over-year growth 2025-2030 (%)
Data Table on Thailand - Year-over-year growth 2025-2030 (%)

12.6 Rest of World (ROW) - Market size and forecast 2025-2030

Chart on Rest of World (ROW) - Market size and forecast 2025-2030 ($ million)
Data Table on Rest of World (ROW) - Market size and forecast 2025-2030 ($ million)
Chart on Rest of World (ROW) - Year-over-year growth 2025-2030 (%)
Data Table on Rest of World (ROW) - Year-over-year growth 2025-2030 (%)
Chart on Regional Comparison - Rest of World (ROW)
Data Table on Regional Comparison - Rest of World (ROW)

12.6.1 Brazil - Market size and forecast 2025-2030

Chart on Brazil - Market size and forecast 2025-2030 ($ million)
Data Table on Brazil - Market size and forecast 2025-2030 ($ million)
Chart on Brazil - Year-over-year growth 2025-2030 (%)
Data Table on Brazil - Year-over-year growth 2025-2030 (%)

12.6.2 Saudi Arabia - Market size and forecast 2025-2030

Chart on Saudi Arabia - Market size and forecast 2025-2030 ($ million)
Data Table on Saudi Arabia - Market size and forecast 2025-2030 ($ million)
Chart on Saudi Arabia - Year-over-year growth 2025-2030 (%)
Data Table on Saudi Arabia - Year-over-year growth 2025-2030 (%)

12.6.3 UAE - Market size and forecast 2025-2030

Chart on UAE - Market size and forecast 2025-2030 ($ million)
Data Table on UAE - Market size and forecast 2025-2030 ($ million)
Chart on UAE - Year-over-year growth 2025-2030 (%)
Data Table on UAE - Year-over-year growth 2025-2030 (%)

12.6.4 Turkey - Market size and forecast 2025-2030

Chart on Turkey - Market size and forecast 2025-2030 ($ million)
Data Table on Turkey - Market size and forecast 2025-2030 ($ million)
Chart on Turkey - Year-over-year growth 2025-2030 (%)
Data Table on Turkey - Year-over-year growth 2025-2030 (%)

12.6.5 Argentina - Market size and forecast 2025-2030

Chart on Argentina - Market size and forecast 2025-2030 ($ million)
Data Table on Argentina - Market size and forecast 2025-2030 ($ million)
Chart on Argentina - Year-over-year growth 2025-2030 (%)
Data Table on Argentina - Year-over-year growth 2025-2030 (%)

12.6.6 Colombia - Market size and forecast 2025-2030

Chart on Colombia - Market size and forecast 2025-2030 ($ million)
Data Table on Colombia - Market size and forecast 2025-2030 ($ million)
Chart on Colombia - Year-over-year growth 2025-2030 (%)
Data Table on Colombia - Year-over-year growth 2025-2030 (%)

12.6.7 South Africa - Market size and forecast 2025-2030

Chart on South Africa - Market size and forecast 2025-2030 ($ million)
Data Table on South Africa - Market size and forecast 2025-2030 ($ million)
Chart on South Africa - Year-over-year growth 2025-2030 (%)
Data Table on South Africa - Year-over-year growth 2025-2030 (%)

12.6.8 Israel - Market size and forecast 2025-2030

Chart on Israel - Market size and forecast 2025-2030 ($ million)
Data Table on Israel - Market size and forecast 2025-2030 ($ million)
Chart on Israel - Year-over-year growth 2025-2030 (%)
Data Table on Israel - Year-over-year growth 2025-2030 (%)

12.7 Market opportunity by geography

Market opportunity by geography ($ million)
Data Tables on Market opportunity by geography ($ million)

13. Drivers, Challenges, and Opportunity

13.1 Market drivers

Escalating prevalence of CVD
Rapid technological advancements in mapping accuracy
Growing preference for minimally invasive procedures

13.2 Market challenges

Prohibitive capital expenditure and equipment costs
Shortage of skilled electrophysiologists and technical expertise
Complex regulatory approvals and stringent reimbursement frameworks

13.3 Impact of drivers and challenges

Impact of drivers and challenges in 2025 and 2030

13.4 Market opportunities

Integration of AI and automated data processing
Expansion of pulsed field ablation and integrated navigation systems
Shift toward ASCs and decentralized care models

14. Competitive Landscape

14.1 Overview

14.2

Overview on criticality of inputs and factors of differentiation

14.3 Landscape disruption

Overview on factors of disruption

14.4 Industry risks

Impact of key risks on business

15. Competitive Analysis

15.1 Companies profiled

Companies covered

15.2 Company ranking index

15.3 Market positioning of companies

Matrix on companies position and classification

15.4 Abbott Laboratories

Abbott Laboratories - Overview
Abbott Laboratories - Business segments
Abbott Laboratories - Key news
Abbott Laboratories - Key offerings
Abbott Laboratories - Segment focus
SWOT

15.5 APT Medical Inc.

APT Medical Inc. - Overview
APT Medical Inc. - Product / Service
APT Medical Inc. - Key offerings
SWOT

15.6 Becton Dickinson and Co.

Becton Dickinson and Co. - Overview
Becton Dickinson and Co. - Business segments
Becton Dickinson and Co. - Key news
Becton Dickinson and Co. - Key offerings
Becton Dickinson and Co. - Segment focus
SWOT

15.7 BIOTRONIK SE and Co. KG

BIOTRONIK SE and Co. KG - Overview
BIOTRONIK SE and Co. KG - Product / Service
BIOTRONIK SE and Co. KG - Key offerings
SWOT

15.8 Boston Scientific Corp.

Boston Scientific Corp. - Overview
Boston Scientific Corp. - Business segments
Boston Scientific Corp. - Key offerings
Boston Scientific Corp. - Segment focus
SWOT

15.9 GE HealthCare Technologies

GE HealthCare Technologies - Overview
GE HealthCare Technologies - Business segments
GE HealthCare Technologies - Key news
GE HealthCare Technologies - Key offerings
GE HealthCare Technologies - Segment focus
SWOT

15.10 Johnson and Johnson

Johnson and Johnson - Overview
Johnson and Johnson - Business segments
Johnson and Johnson - Key news
Johnson and Johnson - Key offerings
Johnson and Johnson - Segment focus
SWOT

15.11 Kardium Inc.

Kardium Inc. - Overview
Kardium Inc. - Product / Service
Kardium Inc. - Key offerings
SWOT

15.12 Koninklijke Philips NV

Koninklijke Philips NV - Overview
Koninklijke Philips NV - Business segments
Koninklijke Philips NV - Key news
Koninklijke Philips NV - Key offerings
Koninklijke Philips NV - Segment focus
SWOT

15.13 Lepu Medical Co. Ltd.

Lepu Medical Co. Ltd. - Overview
Lepu Medical Co. Ltd. - Product / Service
Lepu Medical Co. Ltd. - Key offerings
SWOT

15.14 Medtronic Plc

Medtronic Plc - Overview
Medtronic Plc - Business segments
Medtronic Plc - Key news
Medtronic Plc - Key offerings
Medtronic Plc - Segment focus
SWOT

15.15 MicroPort Scientific Corp.

MicroPort Scientific Corp. - Overview
MicroPort Scientific Corp. - Business segments
MicroPort Scientific Corp. - Key offerings
MicroPort Scientific Corp. - Segment focus
SWOT

15.16 Nihon Kohden Corp.

Nihon Kohden Corp. - Overview
Nihon Kohden Corp. - Business segments
Nihon Kohden Corp. - Key offerings
Nihon Kohden Corp. - Segment focus
SWOT

15.17 Siemens Healthineers AG

Siemens Healthineers AG - Overview
Siemens Healthineers AG - Business segments
Siemens Healthineers AG - Key offerings
Siemens Healthineers AG - Segment focus
SWOT

15.18 Vektor Medical Inc.

Vektor Medical Inc. - Overview
Vektor Medical Inc. - Product / Service
Vektor Medical Inc. - Key offerings
SWOT

16. Appendix

16.1 Scope of the report

Market definition
Objectives
Notes and caveats

16.2 Inclusions and exclusions checklist

Inclusions checklist
Exclusions checklist

16.3 Currency conversion rates for US$

16.4 Research methodology

16.5 Data procurement

Information sources

16.6 Data validation

16.7 Validation techniques employed for market sizing

16.8 Data synthesis

16.9 360 degree market analysis

16.10 List of abbreviations

Research Methodology

Technavio presents a detailed picture of the market by way of study, synthesis, and summation of data from multiple sources. The analysts have presented the various facets of the market with a particular focus on identifying the key industry influencers. The data thus presented is comprehensive, reliable, and the result of extensive research, both primary and secondary.

INFORMATION SOURCES

Primary sources

  • Manufacturers and suppliers
  • Channel partners
  • Industry experts
  • Strategic decision makers

Secondary sources

  • Industry journals and periodicals
  • Government data
  • Financial reports of key industry players
  • Historical data
  • Press releases

DATA ANALYSIS

Data Synthesis

  • Collation of data
  • Estimation of key figures
  • Analysis of derived insights

Data Validation

  • Triangulation with data models
  • Reference against proprietary databases
  • Corroboration with industry experts

REPORT WRITING

Qualitative

  • Market drivers
  • Market challenges
  • Market trends
  • Five forces analysis

Quantitative

  • Market size and forecast
  • Market segmentation
  • Geographical insights
  • Competitive landscape

Interested in this report?

Get your sample now to see our research methodology and insights!

Download Now

Frequently Asked Questions

3D Cardiac Mapping Systems market growth will increase by USD 539.1 million during 2026-2030.

The 3D Cardiac Mapping Systems market is expected to grow at a CAGR of 8.7% during 2026-2030.

3D Cardiac Mapping Systems market is segmented by Product (Contact 3D cardiac mapping systems, Non-contact 3D cardiac mapping systems) Technology (EAM, Magnetic and impedance-based systems, AI-integrated systems) Application (AF, VT, SVT)

Abbott Laboratories, APN Health LLC, APT Medical Inc., Becton Dickinson and Co., BIOTRONIK SE and Co. KG, Boston Scientific Corp., CoreMap Inc., Corify Care SL, EnChannel Medical Ltd., EP Solutions SA, GE HealthCare Technologies, Johnson and Johnson, Kardium Inc., Koninklijke Philips NV, Lepu Medical Co. Ltd., Medtronic Plc, MicroPort Scientific Corp., Nihon Kohden Corp., Siemens Healthineers AG, Vektor Medical Inc., Volta Medical are a few of the key vendors in the 3D Cardiac Mapping Systems market.

North America will register the highest growth rate of 40% among the other regions. Therefore, the 3D Cardiac Mapping Systems market in North America is expected to garner significant business opportunities for the vendors during the forecast period.

US, Canada, Mexico, Germany, UK, France, Italy, Spain, The Netherlands, China, India, Japan, South Korea, Indonesia, Thailand, Brazil, Saudi Arabia, UAE, Turkey, Argentina, Colombia, South Africa, Israel

  • Escalating prevalence of CVD is the driving factor this market.

The 3D Cardiac Mapping Systems market vendors should focus on grabbing business opportunities from the Product segment as it accounted for the largest market share in the base year.
RIA - Research AI Assistant
Ask RIA
