3D Cell Culture Market Analysis, Size, and Forecast 2026-2030: North America (US, Canada, and Mexico), Europe (Germany, UK, and France), APAC (China, Japan, and South Korea), South America (Brazil, Argentina, and Colombia), Middle East and Africa (Saudi Arabia, UAE, and Turkey), Asia, Rest of World (ROW)

3D Cell Culture Market Analysis, Size, and Forecast 2026-2030:
North America (US, Canada, and Mexico), Europe (Germany, UK, and France), APAC (China, Japan, and South Korea), South America (Brazil, Argentina, and Colombia), Middle East and Africa (Saudi Arabia, UAE, and Turkey), Asia, Rest of World (ROW)

Published: Jan 2026 299 Pages SKU: IRTNTR72570

Market Overview at a Glance

$2.21 B
Market Opportunity
19.2%
CAGR 2025 - 2030
40.4%
North America Growth
$677.1 Mn
Cancer and stem cell research segment 2024

3D Cell Culture Market Size 2026-2030

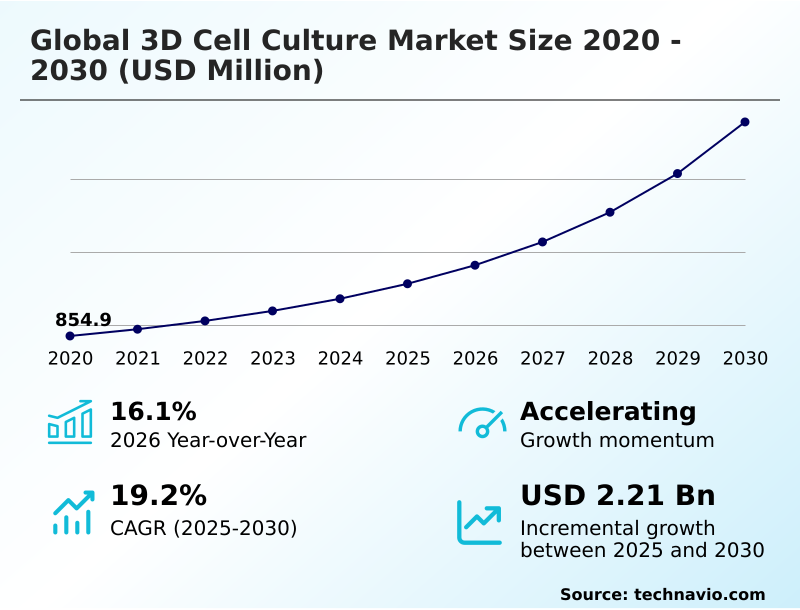
The 3d cell culture market size is valued to increase by USD 2.21 billion, at a CAGR of 19.2% from 2025 to 2030. Growing demand for predictive preclinical models will drive the 3d cell culture market.

Major Market Trends & Insights

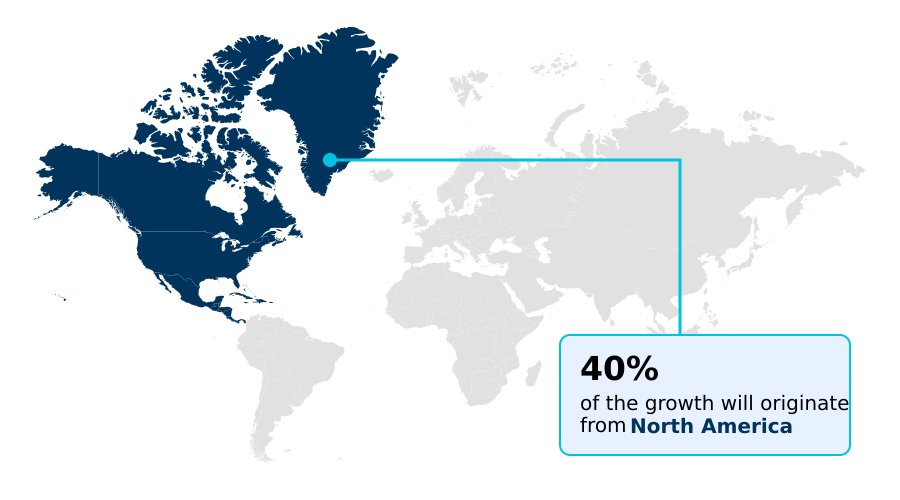
  • North America dominated the market and accounted for a 40.4% growth during the forecast period.
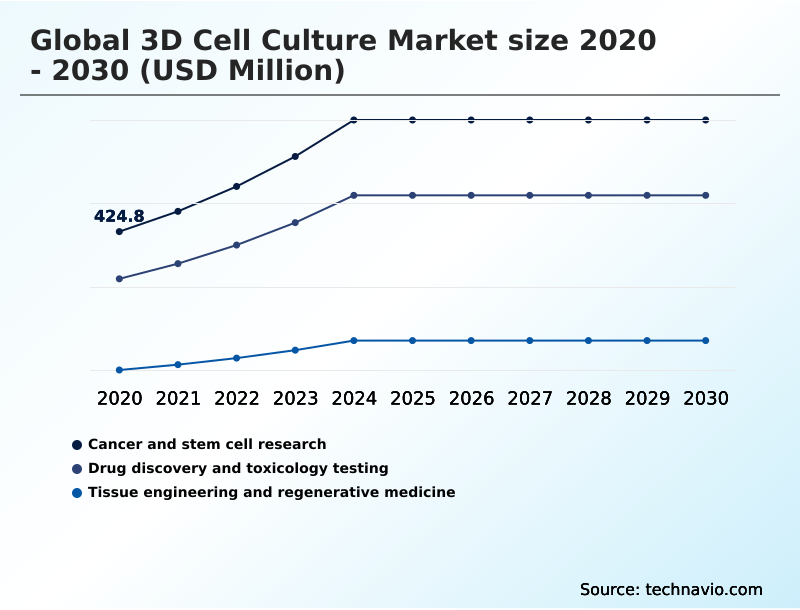
  • By Application - Cancer and stem cell research segment was valued at USD 677.1 million in 2024
  • By Type - Scaffold-based segment accounted for the largest market revenue share in 2024

Market Size & Forecast

  • Market Opportunities: USD 2.92 billion
  • Market Future Opportunities: USD 2.21 billion
  • CAGR from 2025 to 2030 : 19.2%

Market Summary

  • The 3D cell culture market is driven by the increasing need for physiologically relevant in vitro models that better predict human responses in drug discovery and toxicology testing. Technologies such as scaffold-based, scaffold-free, and microfluidics-based systems are enabling the creation of complex structures like organoids and spheroids.
  • These preclinical models are crucial for tissue engineering, regenerative medicine, and advanced cancer research, offering deeper insights into the tumor microenvironment. For instance, a pharmaceutical firm leveraging patient-derived organoids for oncology drug screening can identify non-viable compounds earlier, optimizing R&D expenditure and de-risking late-stage clinical trials.
  • However, challenges related to standardization, cost, and the technical complexity of high-content imaging and automated liquid handling systems persist. The integration of bioinks and advanced biomaterial engineering continues to push the boundaries of what is possible in disease modeling and personalized medicine, making functional tissue constructs and multi-tissue integration key areas of innovation.

What will be the Size of the 3D Cell Culture Market during the forecast period?

Get Key Insights on Market Forecast (PDF) Request Free Sample

How is the 3D Cell Culture Market Segmented?

The 3d cell culture industry research report provides comprehensive data (region-wise segment analysis), with forecasts and estimates in "USD million" for the period 2026-2030, as well as historical data from 2020-2024 for the following segments.

  • Application
    • Cancer and stem cell research
    • Drug discovery and toxicology testing
    • Tissue engineering and regenerative medicine
  • Type
    • Scaffold-based
    • Scaffold-free
    • Bioprinted systems
    • Microfluidics-based
  • End-user
    • Pharmaceutical and biotechnology companies
    • Academic and research institutes
    • CROs
    • Cosmetics industry
  • Geography
    • North America
      • US
      • Canada
      • Mexico
    • Europe
      • Germany
      • UK
      • France
    • Asia
    • Rest of World (ROW)

By Application Insights

The cancer and stem cell research segment is estimated to witness significant growth during the forecast period.

The market is segmented by application, including cancer and stem cell research, which focuses on providing deeper insights into cancer progression and therapeutic resistance.

3D tumor models, patient-derived organoids, and stem cell-derived tissues replicate human tumor microenvironments more accurately than traditional cultures, making them essential for precision oncology. These preclinical models and spheroids improve predictive accuracy by over 40% in some disease modeling scenarios.

As personalized medicine advances, these culture models are central to biomarker discovery and therapeutic validation for drug discovery, leveraging both scaffold-based and scaffold-free systems. This approach to toxicology testing and tissue engineering is crucial for developing next-generation regenerative technologies.

Request Free Sample

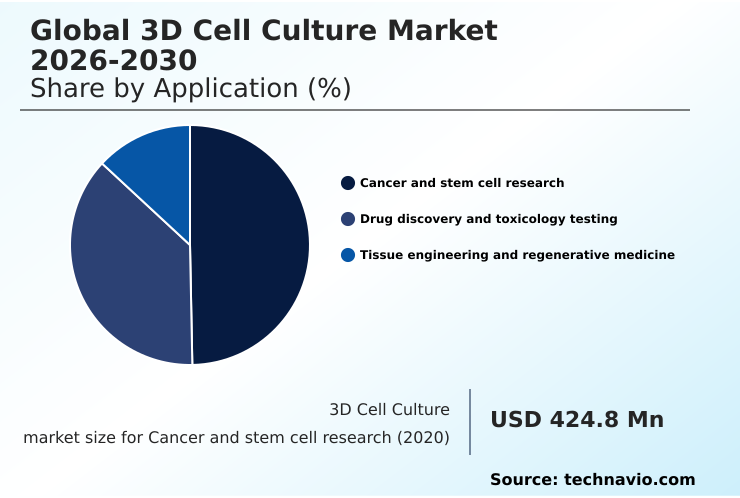
The Cancer and stem cell research segment was valued at USD 677.1 million in 2024 and showed a gradual increase during the forecast period.

Request Free Sample

Regional Analysis

North America is estimated to contribute 40.4% to the growth of the global market during the forecast period.Technavio’s analysts have elaborately explained the regional trends and drivers that shape the market during the forecast period.

See How 3D Cell Culture Market Demand is Rising in North America Request Free Sample

The geographic landscape of the 3D cell culture market is characterized by robust and varied regional growth. North America, a mature market, shows consistent expansion driven by strong pharmaceutical investment and advanced research infrastructure, with a growth rate of 19.2%.

In contrast, Asia is emerging as the fastest-growing region, with a projected expansion of 20.4%, fueled by increasing government funding in biomedical science and a rapidly expanding biopharmaceutical sector.

Europe maintains significant momentum with an 18.6% growth rate, supported by stringent regulations promoting alternatives to animal testing and a focus on microphysiological systems.

These regional disparities highlight diverse market drivers, from technological adoption in the US to policy-driven incentives in Europe and infrastructure development in Asia. The integration of high-content imaging, bioinks, and growth factors is a common thread advancing capabilities worldwide.

Market Dynamics

Our researchers analyzed the data with 2025 as the base year, along with the key drivers, trends, and challenges. A holistic analysis of drivers will help companies refine their marketing strategies to gain a competitive advantage.

  • The strategic implementation of advanced technologies is reshaping the 3D cell culture landscape, with a clear focus on enhancing efficiency and predictive power. Automating 3D cell culture workflows is no longer a niche capability but a core requirement for achieving the scale needed in modern drug discovery.
  • This automation is particularly critical for leveraging organoid models for cancer drug screening, where high-throughput capabilities can reduce manual error rates by a factor of five compared to traditional methods, allowing for more compounds to be evaluated.
  • Concurrently, advancements in microfluidics in organ-on-chip systems are central to the progress of 3D cell culture for personalized medicine, enabling the creation of patient-specific models that mimic human physiological responses with unprecedented accuracy. These systems provide dynamic environments essential for studying complex diseases.
  • Furthermore, the evolution of bioprinting for regenerative medicine applications is opening new frontiers in creating functional tissues for therapeutic use, building upon the foundational principles of controlled cellular organization and biomaterial engineering.

What are the key market drivers leading to the rise in the adoption of 3D Cell Culture Industry?

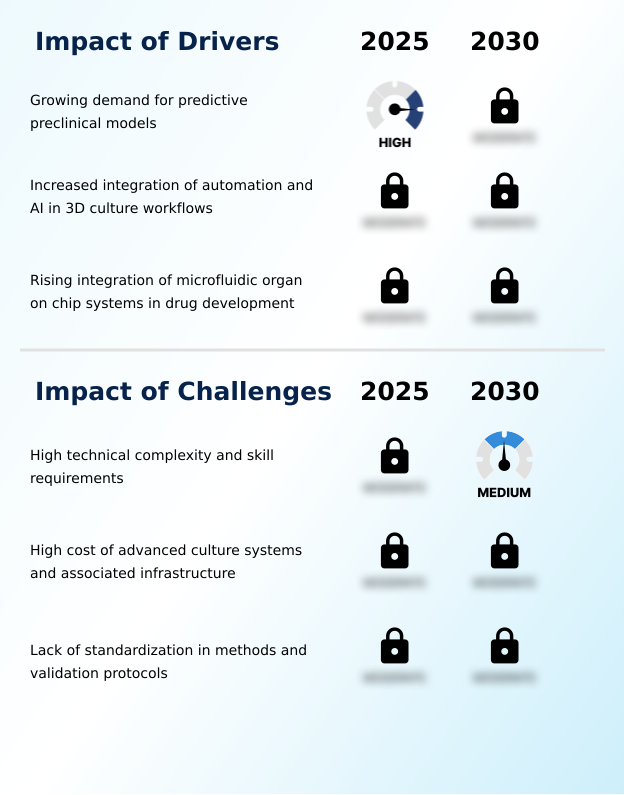
  • The growing demand for predictive preclinical models that offer higher physiological relevance is a key driver for market expansion.

  • Market growth is fundamentally driven by the demand for more predictive and human-relevant preclinical data, with the market expanding at a rate nearly 20% higher than previous averages.
  • The rising integration of microfluidic organ-on-chip systems, which enable dynamic cell culture and multi-tissue integration, is a significant factor. These platforms allow researchers to simulate human biological responses with greater fidelity, improving translational accuracy in drug development.
  • The industry's shift toward physiologically relevant models is also supported by regulatory incentives to reduce animal testing.
  • Innovations in growth factors and air-liquid interface techniques are further enhancing the complexity and functionality of in vitro models, making them indispensable for modern research.

What are the market trends shaping the 3D Cell Culture Industry?

  • The advancement of automation and AI-enabled 3D culture workflows is a significant market trend. This development enhances scalability, reproducibility, and data analysis in preclinical research.

  • Key trends are centered on increasing the physiological relevance and throughput of experimental models. The expansion of organoid-based personalized medicine, driven by advances in biomaterial engineering and stem cell research, is a primary focus. Automation and AI are transforming workflows, with next-generation platforms cutting consumable costs four-fold and reducing in-lab labor by half compared to legacy systems.
  • This allows for more complex phenotypic screening and high-throughput screening of compounds. The development of advanced biofabrication techniques and biocompatible polymers is enhancing the creation of functional tissue constructs.
  • These innovations in disease modeling and personalized medicine are leading to improved assay reproducibility and more reliable preclinical validation, which are critical for accelerating therapeutic development and ensuring cell viability in long-term studies.

What challenges does the 3D Cell Culture Industry face during its growth?

  • High technical complexity and the need for specialized skill sets present a significant challenge, potentially limiting widespread adoption and affecting industry growth.

  • Despite strong growth drivers, the market faces significant challenges related to technical complexity, cost, and standardization. The operation of advanced 3D culture systems requires specialized expertise, creating a skills gap that can slow adoption.
  • Furthermore, the high cost of bioreactors, microfluidic chips, and specialized reagents can be prohibitive, with advanced systems representing an investment up to 10 times greater than traditional 2D culture setups. A lack of standardized protocols for mechanistic studies and cell-cell interactions hinders the ability to compare data across different laboratories, affecting result reproducibility.
  • Addressing these issues is crucial for unlocking the full potential of human-relevant models and ensuring broader market penetration and acceptance.

Exclusive Technavio Analysis on Customer Landscape

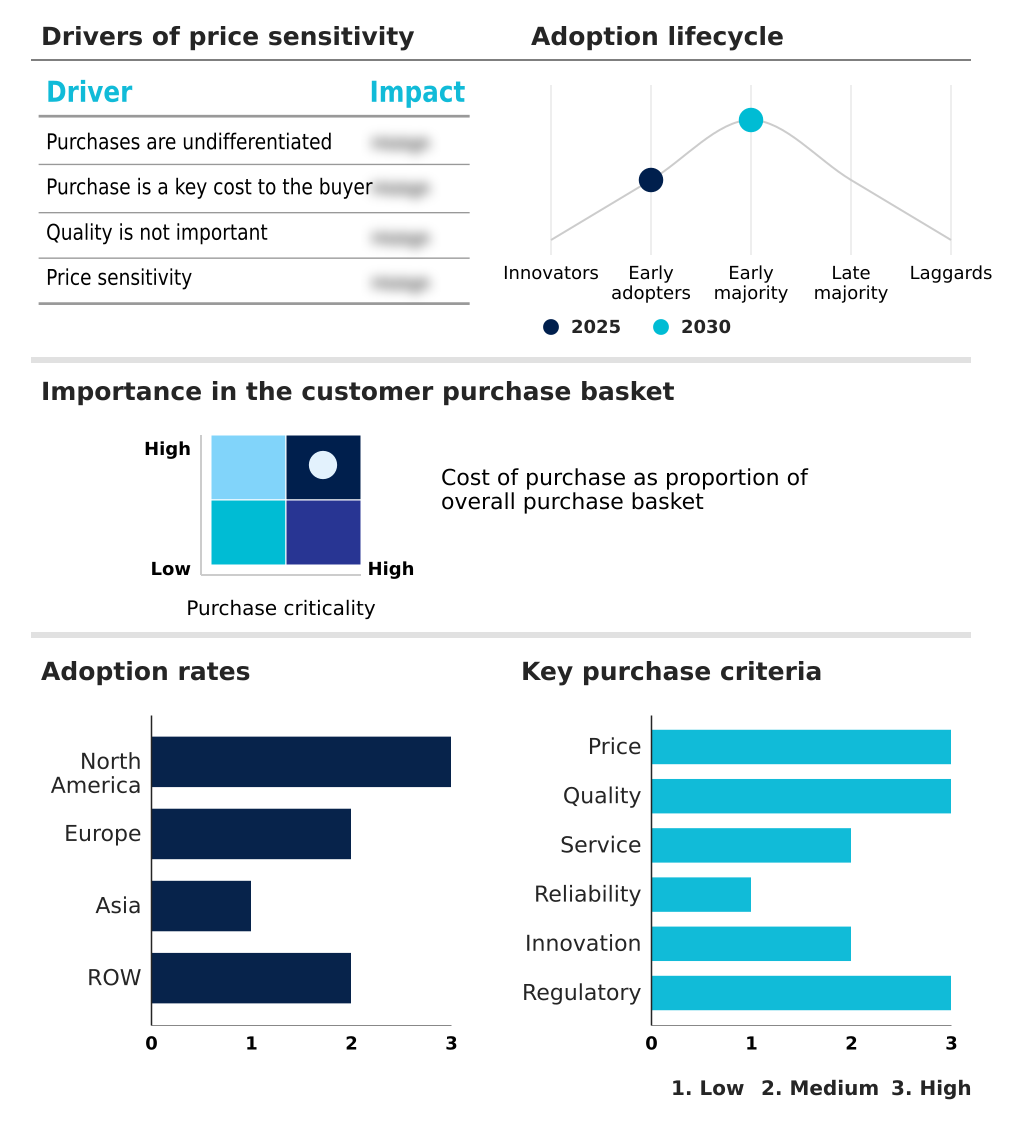
The 3d cell culture market forecasting report includes the adoption lifecycle of the market, covering from the innovator’s stage to the laggard’s stage. It focuses on adoption rates in different regions based on penetration. Furthermore, the 3d cell culture market report also includes key purchase criteria and drivers of price sensitivity to help companies evaluate and develop their market growth analysis strategies.

Customer Landscape of 3D Cell Culture Industry

Competitive Landscape

Companies are implementing various strategies, such as strategic alliances, 3d cell culture market forecast, partnerships, mergers and acquisitions, geographical expansion, and product/service launches, to enhance their presence in the industry.

3D Biotek LLC - Analyzes advanced microphysiological systems, including single and multi-organ platforms, for enhanced preclinical research and development.

The industry research and growth report includes detailed analyses of the competitive landscape of the market and information about key companies, including:

  • 3D Biotek LLC
  • BICO Group AB
  • CN Bio Innovations Ltd.
  • Corning Inc.
  • Elveflow
  • Greiner Bio One International GmbH
  • Hamilton Co.
  • InSphero AG
  • Lonza Group Ltd.
  • Merck KGaA
  • MIMETAS BV
  • PromoCell GmbH
  • REPROCELL Inc.
  • Revvity Inc.
  • Synthecon Inc.
  • Tecan Trading AG
  • Thermo Fisher Scientific Inc.

Qualitative and quantitative analysis of companies has been conducted to help clients understand the wider business environment as well as the strengths and weaknesses of key industry players. Data is qualitatively analyzed to categorize companies as pure play, category-focused, industry-focused, and diversified; it is quantitatively analyzed to categorize companies as dominant, leading, strong, tentative, and weak.

Recent Development and News in 3d cell culture market

  • In August, 2025, Shanghai Biochip Co Ltd. announced its first automated and intelligent in vitro organoid production system, CellXpress AI, marking a significant step toward automation and standardization in organoid technology.
  • In March, 2025, More, a German life science startup, raised around $2.6 million in seed funding to accelerate the commercialization of its lab platform, which automates the planning, culture, and analysis of complex 3D cell culture models.
  • In February, 2025, Queen Mary University of London opened one of Europe's largest organ-on-chip facilities, the Centre for Predictive in vitro Models (CPM), to advance the development of complex in vitro models and reduce reliance on animal testing.
  • In January, 2025, MIMETAS launched OrganoPlate UniFlow (UF), the first commercially available unidirectional, gravity-driven pumpless flow system designed to simplify operations while enhancing model accuracy for drug discovery and disease research.

Dive into Technavio’s robust research methodology, blending expert interviews, extensive data synthesis, and validated models for unparalleled 3D Cell Culture Market insights. See full methodology.

Market Scope
Page number 299
Base year 2025
Historic period 2020-2024
Forecast period 2026-2030
Growth momentum & CAGR Accelerate at a CAGR of 19.2%
Market growth 2026-2030 USD 2206.3 million
Market structure Fragmented
YoY growth 2025-2026(%) 16.1%
Key countries US, Canada, Mexico, Germany, UK, France, Italy, Spain, The Netherlands, China, Japan, South Korea, India, Indonesia, Thailand, Brazil, Saudi Arabia, UAE, Turkey, Argentina, Colombia, South Africa and Israel
Competitive landscape Leading Companies, Market Positioning of Companies, Competitive Strategies, and Industry Risks

Request Free Sample

Research Analyst Overview

  • The 3D cell culture market is defined by a convergence of advanced biological and engineering disciplines aimed at creating more predictive preclinical models. Key technologies including scaffold-based and scaffold-free systems, bioprinted systems, and microfluidics-based platforms are fundamental to this shift.
  • The use of organoids and spheroids is becoming standard in drug discovery, toxicology testing, and cancer research, allowing for sophisticated analysis of the tumor microenvironment and therapeutic efficacy. For boardroom consideration, investing in automated liquid handling and high-content imaging platforms is a strategic imperative that can de-risk pharmaceutical pipelines by reducing preclinical timelines by up to 25%.
  • Innovations in tissue engineering and regenerative medicine are facilitated by advanced bioinks and extracellular matrix compositions, enabling the development of patient-derived organoids for personalized medicine. The integration of these technologies into microphysiological systems is setting a new benchmark for in vitro modeling and stem cell research.

What are the Key Data Covered in this 3D Cell Culture Market Research and Growth Report?

  • What is the expected growth of the 3D Cell Culture Market between 2026 and 2030?

    • USD 2.21 billion, at a CAGR of 19.2%

  • What segmentation does the market report cover?

    • The report is segmented by Application (Cancer and stem cell research, Drug discovery and toxicology testing, and Tissue engineering and regenerative medicine), Type (Scaffold-based, Scaffold-free, Bioprinted systems, and Microfluidics-based), End-user (Pharmaceutical and biotechnology companies, Academic and research institutes, CROs, and Cosmetics industry) and Geography (North America, Europe, Asia, Rest of World (ROW))

  • Which regions are analyzed in the report?

    • North America, Europe, Asia and Rest of World (ROW)

  • What are the key growth drivers and market challenges?

    • Growing demand for predictive preclinical models, High technical complexity and skill requirements

  • Who are the major players in the 3D Cell Culture Market?

    • 3D Biotek LLC, BICO Group AB, CN Bio Innovations Ltd., Corning Inc., Elveflow, Greiner Bio One International GmbH, Hamilton Co., InSphero AG, Lonza Group Ltd., Merck KGaA, MIMETAS BV, PromoCell GmbH, REPROCELL Inc., Revvity Inc., Synthecon Inc., Tecan Trading AG and Thermo Fisher Scientific Inc.

Market Research Insights

  • Market dynamics are shaped by the pursuit of higher translational accuracy in preclinical research, with organizations achieving up to a 40% improvement in predictive outcomes using advanced systems. North America accounts for over 40% of the incremental growth, while Asia demonstrates the fastest expansion, with a rate nearly 10% higher than other regions.
  • The adoption of physiologically relevant models and high-throughput screening methods is critical, as is ensuring assay reproducibility for reliable disease modeling. Innovations in microfluidics-based platforms and dynamic cell culture techniques are enabling more complex cell-cell interactions, which is essential for developing effective personalized medicine strategies and accelerating preclinical validation timelines across the industry.

We can help! Our analysts can customize this 3d cell culture market research report to meet your requirements.

Get in touch

1. Executive Summary

1.1 Market overview

Executive Summary - Chart on Market Overview
Executive Summary - Data Table on Market Overview
Executive Summary - Chart on Global Market Characteristics
Executive Summary - Chart on Market by Geography
Executive Summary - Chart on Market Segmentation by Application
Executive Summary - Chart on Market Segmentation by Type
Executive Summary - Chart on Market Segmentation by End-user
Executive Summary - Chart on Incremental Growth
Executive Summary - Data Table on Incremental Growth
Executive Summary - Chart on Company Market Positioning

2. Technavio Analysis

2.1 Analysis of price sensitivity, lifecycle, customer purchase basket, adoption rates, and purchase criteria

2.2 Criticality of inputs and Factors of differentiation

Chart on Overview on criticality of inputs and factors of differentiation

2.3 Factors of disruption

Chart on Overview on factors of disruption

2.4 Impact of drivers and challenges

Chart on Impact of drivers and challenges in 2025 and 2030

3. Market Landscape

3.1 Market ecosystem

Chart on Parent Market
Data Table on - Parent Market

3.2 Market characteristics

Chart on Market characteristics analysis

3.3 Value chain analysis

Chart on Value chain analysis

4. Market Sizing

4.1 Market definition

Data Table on Offerings of companies included in the market definition

4.2 Market segment analysis

Market segments

4.3 Market size 2025

4.4 Market outlook: Forecast for 2025-2030

Chart on Global - Market size and forecast 2025-2030 ($ million)
Data Table on Global - Market size and forecast 2025-2030 ($ million)
Chart on Global Market: Year-over-year growth 2025-2030 (%)
Data Table on Global Market: Year-over-year growth 2025-2030 (%)

5. Historic Market Size

5.1 Global 3D Cell Culture Market 2020 - 2024

Historic Market Size - Data Table on Global 3D Cell Culture Market 2020 - 2024 ($ million)

5.2 Application segment analysis 2020 - 2024

Historic Market Size - Application Segment 2020 - 2024 ($ million)

5.3 Type segment analysis 2020 - 2024

Historic Market Size - Type Segment 2020 - 2024 ($ million)

5.4 End-user segment analysis 2020 - 2024

Historic Market Size - End-user Segment 2020 - 2024 ($ million)

5.5 Geography segment analysis 2020 - 2024

Historic Market Size - Geography Segment 2020 - 2024 ($ million)

5.6 Country segment analysis 2020 - 2024

Historic Market Size - Country Segment 2020 - 2024 ($ million)

6. Qualitative Analysis

6.1 Impact of AI on Global 3D cell culture Market

7. Five Forces Analysis

7.1 Five forces summary

Five forces analysis - Comparison between 2025 and 2030

7.2 Bargaining power of buyers

Bargaining power of buyers - Impact of key factors 2025 and 2030

7.3 Bargaining power of suppliers

Bargaining power of suppliers - Impact of key factors in 2025 and 2030

7.4 Threat of new entrants

Threat of new entrants - Impact of key factors in 2025 and 2030

7.5 Threat of substitutes

Threat of substitutes - Impact of key factors in 2025 and 2030

7.6 Threat of rivalry

Threat of rivalry - Impact of key factors in 2025 and 2030

7.7 Market condition

Chart on Market condition - Five forces 2025 and 2030

8. Market Segmentation by Application

8.1 Market segments

Chart on Application - Market share 2025-2030 (%)
Data Table on Application - Market share 2025-2030 (%)

8.2 Comparison by Application

Chart on Comparison by Application
Data Table on Comparison by Application

8.3 Cancer and stem cell research - Market size and forecast 2025-2030

Chart on Cancer and stem cell research - Market size and forecast 2025-2030 ($ million)
Data Table on Cancer and stem cell research - Market size and forecast 2025-2030 ($ million)
Chart on Cancer and stem cell research - Year-over-year growth 2025-2030 (%)
Data Table on Cancer and stem cell research - Year-over-year growth 2025-2030 (%)

8.4 Drug discovery and toxicology testing - Market size and forecast 2025-2030

Chart on Drug discovery and toxicology testing - Market size and forecast 2025-2030 ($ million)
Data Table on Drug discovery and toxicology testing - Market size and forecast 2025-2030 ($ million)
Chart on Drug discovery and toxicology testing - Year-over-year growth 2025-2030 (%)
Data Table on Drug discovery and toxicology testing - Year-over-year growth 2025-2030 (%)

8.5 Tissue engineering and regenerative medicine - Market size and forecast 2025-2030

Chart on Tissue engineering and regenerative medicine - Market size and forecast 2025-2030 ($ million)
Data Table on Tissue engineering and regenerative medicine - Market size and forecast 2025-2030 ($ million)
Chart on Tissue engineering and regenerative medicine - Year-over-year growth 2025-2030 (%)
Data Table on Tissue engineering and regenerative medicine - Year-over-year growth 2025-2030 (%)

8.6 Market opportunity by Application

Market opportunity by Application ($ million)
Data Table on Market opportunity by Application ($ million)

9. Market Segmentation by Type

9.1 Market segments

Chart on Type - Market share 2025-2030 (%)
Data Table on Type - Market share 2025-2030 (%)

9.2 Comparison by Type

Chart on Comparison by Type
Data Table on Comparison by Type

9.3 Scaffold-based - Market size and forecast 2025-2030

Chart on Scaffold-based - Market size and forecast 2025-2030 ($ million)
Data Table on Scaffold-based - Market size and forecast 2025-2030 ($ million)
Chart on Scaffold-based - Year-over-year growth 2025-2030 (%)
Data Table on Scaffold-based - Year-over-year growth 2025-2030 (%)

9.4 Scaffold-free - Market size and forecast 2025-2030

Chart on Scaffold-free - Market size and forecast 2025-2030 ($ million)
Data Table on Scaffold-free - Market size and forecast 2025-2030 ($ million)
Chart on Scaffold-free - Year-over-year growth 2025-2030 (%)
Data Table on Scaffold-free - Year-over-year growth 2025-2030 (%)

9.5 Bioprinted systems - Market size and forecast 2025-2030

Chart on Bioprinted systems - Market size and forecast 2025-2030 ($ million)
Data Table on Bioprinted systems - Market size and forecast 2025-2030 ($ million)
Chart on Bioprinted systems - Year-over-year growth 2025-2030 (%)
Data Table on Bioprinted systems - Year-over-year growth 2025-2030 (%)

9.6 Microfluidics-based - Market size and forecast 2025-2030

Chart on Microfluidics-based - Market size and forecast 2025-2030 ($ million)
Data Table on Microfluidics-based - Market size and forecast 2025-2030 ($ million)
Chart on Microfluidics-based - Year-over-year growth 2025-2030 (%)
Data Table on Microfluidics-based - Year-over-year growth 2025-2030 (%)

9.7 Market opportunity by Type

Market opportunity by Type ($ million)
Data Table on Market opportunity by Type ($ million)

10. Market Segmentation by End-user

10.1 Market segments

Chart on End-user - Market share 2025-2030 (%)
Data Table on End-user - Market share 2025-2030 (%)

10.2 Comparison by End-user

Chart on Comparison by End-user
Data Table on Comparison by End-user

10.3 Pharmaceutical and biotechnology companies - Market size and forecast 2025-2030

Chart on Pharmaceutical and biotechnology companies - Market size and forecast 2025-2030 ($ million)
Data Table on Pharmaceutical and biotechnology companies - Market size and forecast 2025-2030 ($ million)
Chart on Pharmaceutical and biotechnology companies - Year-over-year growth 2025-2030 (%)
Data Table on Pharmaceutical and biotechnology companies - Year-over-year growth 2025-2030 (%)

10.4 Academic and research institutes - Market size and forecast 2025-2030

Chart on Academic and research institutes - Market size and forecast 2025-2030 ($ million)
Data Table on Academic and research institutes - Market size and forecast 2025-2030 ($ million)
Chart on Academic and research institutes - Year-over-year growth 2025-2030 (%)
Data Table on Academic and research institutes - Year-over-year growth 2025-2030 (%)

10.5 CROs - Market size and forecast 2025-2030

Chart on CROs - Market size and forecast 2025-2030 ($ million)
Data Table on CROs - Market size and forecast 2025-2030 ($ million)
Chart on CROs - Year-over-year growth 2025-2030 (%)
Data Table on CROs - Year-over-year growth 2025-2030 (%)

10.6 Cosmetics industry - Market size and forecast 2025-2030

Chart on Cosmetics industry - Market size and forecast 2025-2030 ($ million)
Data Table on Cosmetics industry - Market size and forecast 2025-2030 ($ million)
Chart on Cosmetics industry - Year-over-year growth 2025-2030 (%)
Data Table on Cosmetics industry - Year-over-year growth 2025-2030 (%)

10.7 Market opportunity by End-user

Market opportunity by End-user ($ million)
Data Table on Market opportunity by End-user ($ million)

11. Customer Landscape

11.1 Customer landscape overview

Analysis of price sensitivity, lifecycle, customer purchase basket, adoption rates, and purchase criteria

12. Geographic Landscape

12.1 Geographic segmentation

Chart on Market share by geography 2025-2030 (%)
Data Table on Market share by geography 2025-2030 (%)

12.2 Geographic comparison

Chart on Geographic comparison
Data Table on Geographic comparison

12.3 North America - Market size and forecast 2025-2030

Chart on North America - Market size and forecast 2025-2030 ($ million)
Data Table on North America - Market size and forecast 2025-2030 ($ million)
Chart on North America - Year-over-year growth 2025-2030 (%)
Data Table on North America - Year-over-year growth 2025-2030 (%)
Chart on Regional Comparison - North America
Data Table on Regional Comparison - North America

12.3.1 US - Market size and forecast 2025-2030

Chart on US - Market size and forecast 2025-2030 ($ million)
Data Table on US - Market size and forecast 2025-2030 ($ million)
Chart on US - Year-over-year growth 2025-2030 (%)
Data Table on US - Year-over-year growth 2025-2030 (%)

12.3.2 Canada - Market size and forecast 2025-2030

Chart on Canada - Market size and forecast 2025-2030 ($ million)
Data Table on Canada - Market size and forecast 2025-2030 ($ million)
Chart on Canada - Year-over-year growth 2025-2030 (%)
Data Table on Canada - Year-over-year growth 2025-2030 (%)

12.3.3 Mexico - Market size and forecast 2025-2030

Chart on Mexico - Market size and forecast 2025-2030 ($ million)
Data Table on Mexico - Market size and forecast 2025-2030 ($ million)
Chart on Mexico - Year-over-year growth 2025-2030 (%)
Data Table on Mexico - Year-over-year growth 2025-2030 (%)

12.4 Europe - Market size and forecast 2025-2030

Chart on Europe - Market size and forecast 2025-2030 ($ million)
Data Table on Europe - Market size and forecast 2025-2030 ($ million)
Chart on Europe - Year-over-year growth 2025-2030 (%)
Data Table on Europe - Year-over-year growth 2025-2030 (%)
Chart on Regional Comparison - Europe
Data Table on Regional Comparison - Europe

12.4.1 Germany - Market size and forecast 2025-2030

Chart on Germany - Market size and forecast 2025-2030 ($ million)
Data Table on Germany - Market size and forecast 2025-2030 ($ million)
Chart on Germany - Year-over-year growth 2025-2030 (%)
Data Table on Germany - Year-over-year growth 2025-2030 (%)

12.4.2 UK - Market size and forecast 2025-2030

Chart on UK - Market size and forecast 2025-2030 ($ million)
Data Table on UK - Market size and forecast 2025-2030 ($ million)
Chart on UK - Year-over-year growth 2025-2030 (%)
Data Table on UK - Year-over-year growth 2025-2030 (%)

12.4.3 France - Market size and forecast 2025-2030

Chart on France - Market size and forecast 2025-2030 ($ million)
Data Table on France - Market size and forecast 2025-2030 ($ million)
Chart on France - Year-over-year growth 2025-2030 (%)
Data Table on France - Year-over-year growth 2025-2030 (%)

12.4.4 Italy - Market size and forecast 2025-2030

Chart on Italy - Market size and forecast 2025-2030 ($ million)
Data Table on Italy - Market size and forecast 2025-2030 ($ million)
Chart on Italy - Year-over-year growth 2025-2030 (%)
Data Table on Italy - Year-over-year growth 2025-2030 (%)

12.4.5 Spain - Market size and forecast 2025-2030

Chart on Spain - Market size and forecast 2025-2030 ($ million)
Data Table on Spain - Market size and forecast 2025-2030 ($ million)
Chart on Spain - Year-over-year growth 2025-2030 (%)
Data Table on Spain - Year-over-year growth 2025-2030 (%)

12.4.6 The Netherlands - Market size and forecast 2025-2030

Chart on The Netherlands - Market size and forecast 2025-2030 ($ million)
Data Table on The Netherlands - Market size and forecast 2025-2030 ($ million)
Chart on The Netherlands - Year-over-year growth 2025-2030 (%)
Data Table on The Netherlands - Year-over-year growth 2025-2030 (%)

12.5 Asia - Market size and forecast 2025-2030

Chart on Asia - Market size and forecast 2025-2030 ($ million)
Data Table on Asia - Market size and forecast 2025-2030 ($ million)
Chart on Asia - Year-over-year growth 2025-2030 (%)
Data Table on Asia - Year-over-year growth 2025-2030 (%)
Chart on Regional Comparison - Asia
Data Table on Regional Comparison - Asia

12.5.1 China - Market size and forecast 2025-2030

Chart on China - Market size and forecast 2025-2030 ($ million)
Data Table on China - Market size and forecast 2025-2030 ($ million)
Chart on China - Year-over-year growth 2025-2030 (%)
Data Table on China - Year-over-year growth 2025-2030 (%)

12.5.2 Japan - Market size and forecast 2025-2030

Chart on Japan - Market size and forecast 2025-2030 ($ million)
Data Table on Japan - Market size and forecast 2025-2030 ($ million)
Chart on Japan - Year-over-year growth 2025-2030 (%)
Data Table on Japan - Year-over-year growth 2025-2030 (%)

12.5.3 South Korea - Market size and forecast 2025-2030

Chart on South Korea - Market size and forecast 2025-2030 ($ million)
Data Table on South Korea - Market size and forecast 2025-2030 ($ million)
Chart on South Korea - Year-over-year growth 2025-2030 (%)
Data Table on South Korea - Year-over-year growth 2025-2030 (%)

12.5.4 India - Market size and forecast 2025-2030

Chart on India - Market size and forecast 2025-2030 ($ million)
Data Table on India - Market size and forecast 2025-2030 ($ million)
Chart on India - Year-over-year growth 2025-2030 (%)
Data Table on India - Year-over-year growth 2025-2030 (%)

12.5.5 Indonesia - Market size and forecast 2025-2030

Chart on Indonesia - Market size and forecast 2025-2030 ($ million)
Data Table on Indonesia - Market size and forecast 2025-2030 ($ million)
Chart on Indonesia - Year-over-year growth 2025-2030 (%)
Data Table on Indonesia - Year-over-year growth 2025-2030 (%)

12.5.6 Thailand - Market size and forecast 2025-2030

Chart on Thailand - Market size and forecast 2025-2030 ($ million)
Data Table on Thailand - Market size and forecast 2025-2030 ($ million)
Chart on Thailand - Year-over-year growth 2025-2030 (%)
Data Table on Thailand - Year-over-year growth 2025-2030 (%)

12.6 Rest of World (ROW) - Market size and forecast 2025-2030

Chart on Rest of World (ROW) - Market size and forecast 2025-2030 ($ million)
Data Table on Rest of World (ROW) - Market size and forecast 2025-2030 ($ million)
Chart on Rest of World (ROW) - Year-over-year growth 2025-2030 (%)
Data Table on Rest of World (ROW) - Year-over-year growth 2025-2030 (%)
Chart on Regional Comparison - Rest of World (ROW)
Data Table on Regional Comparison - Rest of World (ROW)

12.6.1 Brazil - Market size and forecast 2025-2030

Chart on Brazil - Market size and forecast 2025-2030 ($ million)
Data Table on Brazil - Market size and forecast 2025-2030 ($ million)
Chart on Brazil - Year-over-year growth 2025-2030 (%)
Data Table on Brazil - Year-over-year growth 2025-2030 (%)

12.6.2 Saudi Arabia - Market size and forecast 2025-2030

Chart on Saudi Arabia - Market size and forecast 2025-2030 ($ million)
Data Table on Saudi Arabia - Market size and forecast 2025-2030 ($ million)
Chart on Saudi Arabia - Year-over-year growth 2025-2030 (%)
Data Table on Saudi Arabia - Year-over-year growth 2025-2030 (%)

12.6.3 UAE - Market size and forecast 2025-2030

Chart on UAE - Market size and forecast 2025-2030 ($ million)
Data Table on UAE - Market size and forecast 2025-2030 ($ million)
Chart on UAE - Year-over-year growth 2025-2030 (%)
Data Table on UAE - Year-over-year growth 2025-2030 (%)

12.6.4 Turkey - Market size and forecast 2025-2030

Chart on Turkey - Market size and forecast 2025-2030 ($ million)
Data Table on Turkey - Market size and forecast 2025-2030 ($ million)
Chart on Turkey - Year-over-year growth 2025-2030 (%)
Data Table on Turkey - Year-over-year growth 2025-2030 (%)

12.6.5 Argentina - Market size and forecast 2025-2030

Chart on Argentina - Market size and forecast 2025-2030 ($ million)
Data Table on Argentina - Market size and forecast 2025-2030 ($ million)
Chart on Argentina - Year-over-year growth 2025-2030 (%)
Data Table on Argentina - Year-over-year growth 2025-2030 (%)

12.6.6 Colombia - Market size and forecast 2025-2030

Chart on Colombia - Market size and forecast 2025-2030 ($ million)
Data Table on Colombia - Market size and forecast 2025-2030 ($ million)
Chart on Colombia - Year-over-year growth 2025-2030 (%)
Data Table on Colombia - Year-over-year growth 2025-2030 (%)

12.6.7 South Africa - Market size and forecast 2025-2030

Chart on South Africa - Market size and forecast 2025-2030 ($ million)
Data Table on South Africa - Market size and forecast 2025-2030 ($ million)
Chart on South Africa - Year-over-year growth 2025-2030 (%)
Data Table on South Africa - Year-over-year growth 2025-2030 (%)

12.6.8 Israel - Market size and forecast 2025-2030

Chart on Israel - Market size and forecast 2025-2030 ($ million)
Data Table on Israel - Market size and forecast 2025-2030 ($ million)
Chart on Israel - Year-over-year growth 2025-2030 (%)
Data Table on Israel - Year-over-year growth 2025-2030 (%)

12.7 Market opportunity by geography

Market opportunity by geography ($ million)
Data Tables on Market opportunity by geography ($ million)

13. Drivers, Challenges, and Opportunity

13.1 Market drivers

Growing demand for predictive preclinical models
Increased integration of automation and AI in 3D culture workflows
Rising integration of microfluidic organ on chip systems in drug development

13.2 Market challenges

High technical complexity and skill requirements
High cost of advanced culture systems and associated infrastructure
Lack of standardization in methods and validation protocols

13.3 Impact of drivers and challenges

Impact of drivers and challenges in 2025 and 2030

13.4 Market opportunities

Advancement of automation and AI enabled 3D culture workflows
Advancements in microfluidic and organ on chip technologies
Expansion of organoid based personalized medicine models

14. Competitive Landscape

14.1 Overview

14.2

Overview on criticality of inputs and factors of differentiation

14.3 Landscape disruption

Overview on factors of disruption

14.4 Industry risks

Impact of key risks on business

15. Competitive Analysis

15.1 Companies profiled

Companies covered

15.2 Company ranking index

15.3 Market positioning of companies

Matrix on companies position and classification

15.4 3D Biotek LLC

3D Biotek LLC - Overview
3D Biotek LLC - Product / Service
3D Biotek LLC - Key offerings
SWOT

15.5 CN Bio Innovations Ltd.

CN Bio Innovations Ltd. - Overview
CN Bio Innovations Ltd. - Product / Service
CN Bio Innovations Ltd. - Key offerings
SWOT

15.6 Corning Inc.

Corning Inc. - Overview
Corning Inc. - Business segments
Corning Inc. - Key offerings
Corning Inc. - Segment focus
SWOT

15.7 Greiner Bio One International GmbH

Greiner Bio One International GmbH - Overview
Greiner Bio One International GmbH - Product / Service
Greiner Bio One International GmbH - Key offerings
SWOT

15.8 Hamilton Co.

Hamilton Co. - Overview
Hamilton Co. - Product / Service
Hamilton Co. - Key offerings
SWOT

15.9 InSphero AG

InSphero AG - Overview
InSphero AG - Product / Service
InSphero AG - Key offerings
SWOT

15.10 Lonza Group Ltd.

Lonza Group Ltd. - Overview
Lonza Group Ltd. - Business segments
Lonza Group Ltd. - Key news
Lonza Group Ltd. - Key offerings
Lonza Group Ltd. - Segment focus
SWOT

15.11 Merck KGaA

Merck KGaA - Overview
Merck KGaA - Business segments
Merck KGaA - Key news
Merck KGaA - Key offerings
Merck KGaA - Segment focus
SWOT

15.12 MIMETAS BV

MIMETAS BV - Overview
MIMETAS BV - Product / Service
MIMETAS BV - Key offerings
SWOT

15.13 PromoCell GmbH

PromoCell GmbH - Overview
PromoCell GmbH - Product / Service
PromoCell GmbH - Key offerings
SWOT

15.14 REPROCELL Inc.

REPROCELL Inc. - Overview
REPROCELL Inc. - Product / Service
REPROCELL Inc. - Key offerings
SWOT

15.15 Revvity Inc.

Revvity Inc. - Overview
Revvity Inc. - Business segments
Revvity Inc. - Key offerings
Revvity Inc. - Segment focus
SWOT

15.16 Synthecon Inc.

Synthecon Inc. - Overview
Synthecon Inc. - Product / Service
Synthecon Inc. - Key offerings
SWOT

15.17 Tecan Trading AG

Tecan Trading AG - Overview
Tecan Trading AG - Business segments
Tecan Trading AG - Key offerings
Tecan Trading AG - Segment focus
SWOT

15.18 Thermo Fisher Scientific Inc.

Thermo Fisher Scientific Inc. - Overview
Thermo Fisher Scientific Inc. - Business segments
Thermo Fisher Scientific Inc. - Key news
Thermo Fisher Scientific Inc. - Key offerings
Thermo Fisher Scientific Inc. - Segment focus
SWOT

16. Appendix

16.1 Scope of the report

Market definition
Objectives
Notes and caveats

16.2 Inclusions and exclusions checklist

Inclusions checklist
Exclusions checklist

16.3 Currency conversion rates for US$

16.4 Research methodology

16.5 Data procurement

Information sources

16.6 Data validation

16.7 Validation techniques employed for market sizing

16.8 Data synthesis

16.9 360 degree market analysis

16.10 List of abbreviations

Research Methodology

Technavio presents a detailed picture of the market by way of study, synthesis, and summation of data from multiple sources. The analysts have presented the various facets of the market with a particular focus on identifying the key industry influencers. The data thus presented is comprehensive, reliable, and the result of extensive research, both primary and secondary.

INFORMATION SOURCES

Primary sources

  • Manufacturers and suppliers
  • Channel partners
  • Industry experts
  • Strategic decision makers

Secondary sources

  • Industry journals and periodicals
  • Government data
  • Financial reports of key industry players
  • Historical data
  • Press releases

DATA ANALYSIS

Data Synthesis

  • Collation of data
  • Estimation of key figures
  • Analysis of derived insights

Data Validation

  • Triangulation with data models
  • Reference against proprietary databases
  • Corroboration with industry experts

REPORT WRITING

Qualitative

  • Market drivers
  • Market challenges
  • Market trends
  • Five forces analysis

Quantitative

  • Market size and forecast
  • Market segmentation
  • Geographical insights
  • Competitive landscape

Interested in this report?

Get your sample now to see our research methodology and insights!

Download Now

Frequently Asked Questions

3D Cell Culture market growth will increase by USD 2206.3 million during 2026-2030.

The 3D Cell Culture market is expected to grow at a CAGR of 19.2% during 2026-2030.

3D Cell Culture market is segmented by Application (Cancer and stem cell research, Drug discovery and toxicology testing, Tissue engineering and regenerative medicine) Type (Scaffold-based, Scaffold-free, Bioprinted systems, Microfluidics-based) End-user (Pharmaceutical and biotechnology companies, Academic and research institutes, CROs, Cosmetics industry)

3D Biotek LLC, BICO Group AB, CN Bio Innovations Ltd., Corning Inc., Elveflow, Greiner Bio One International GmbH, Hamilton Co., InSphero AG, Lonza Group Ltd., Merck KGaA, MIMETAS BV, PromoCell GmbH, REPROCELL Inc., Revvity Inc., Synthecon Inc., Tecan Trading AG, Thermo Fisher Scientific Inc. are a few of the key vendors in the 3D Cell Culture market.

North America will register the highest growth rate of 40.4% among the other regions. Therefore, the 3D Cell Culture market in North America is expected to garner significant business opportunities for the vendors during the forecast period.

US, Canada, Mexico, Germany, UK, France, Italy, Spain, The Netherlands, China, Japan, South Korea, India, Indonesia, Thailand, Brazil, Saudi Arabia, UAE, Turkey, Argentina, Colombia, South Africa, Israel

  • Growing demand for predictive preclinical models is the driving factor this market.

The 3D Cell Culture market vendors should focus on grabbing business opportunities from the Application segment as it accounted for the largest market share in the base year.