
Cell Culture Market Size 2024-2028
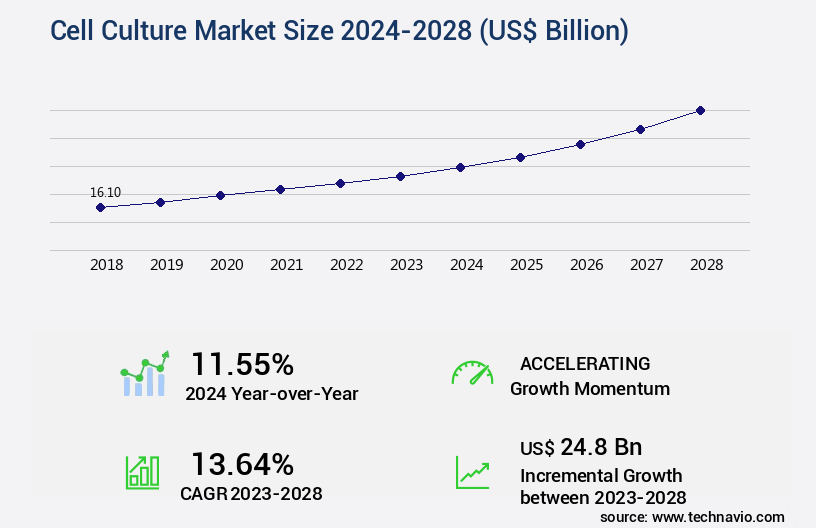
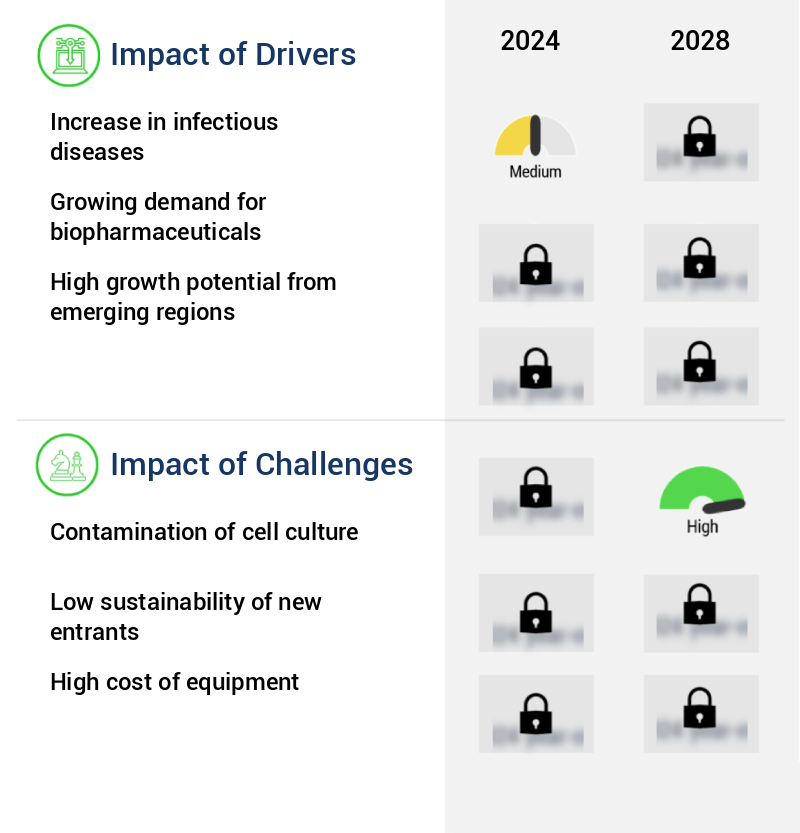
The cell culture market size is valued to increase by USD 24.8 billion, at a CAGR of 13.64% from 2023 to 2028. Increase in infectious diseases will drive the cell culture market.
Market Insights
- North America dominated the market and accounted for a 37% growth during the 2024-2028.
- By Product - Consumables segment was valued at USD 8.70 billion in 2022
- By End-user - Pharma and biotech companies segment accounted for the largest market revenue share in 2022
Market Size & Forecast
- Market Opportunities: USD 226.09 billion
- Market Future Opportunities 2023: USD 24.80 billion
- CAGR from 2023 to 2028 : 13.64%
Market Summary
- The market is a dynamic and growing industry that plays a crucial role in various sectors, including pharmaceuticals, biotechnology, and research institutions. One of the primary drivers of this market is the increasing incidence of infectious diseases, which necessitates the production of large quantities of cells for vaccine development and therapeutics. Another significant trend is the shift towards three-dimensional (3D) cell culture systems, which better mimic the in vivo environment and improve the efficacy of cell-based therapies. Despite these opportunities, the market faces challenges, such as contamination of cell cultures, which can lead to product failure and regulatory issues.
- To address this challenge, companies are investing in advanced technologies, such as single-use systems and automated processes, to minimize the risk of contamination and ensure operational efficiency. For instance, a pharmaceutical company may optimize its supply chain by implementing a closed-system cell culture process. This approach reduces the risk of contamination and enables the company to produce cells more quickly and cost-effectively. By leveraging advanced technologies, the company can ensure regulatory compliance and deliver high-quality cell-based products to the market. In conclusion, the market is a critical and evolving industry, driven by the increasing demand for cell-based therapies and the shift towards 3D cell culture systems.
- Companies must navigate challenges, such as contamination, to ensure operational efficiency and regulatory compliance. By investing in advanced technologies, they can meet the growing demand for cell-based products and stay competitive in the market.
What will be the size of the Cell Culture Market during the forecast period?
Get Key Insights on Market Forecast (PDF) Request Free Sample
- The market continues to evolve, with advancements in technologies driving innovation in various sectors such as pharmaceuticals, biotechnology, and regenerative medicine. One significant trend is the increasing adoption of automated cell culture systems, which offer enhanced control and precision, leading to improved product quality and consistency. For instance, automated systems enable the optimization of culture conditions, including pH, temperature, and gas composition, resulting in healthier cell growth. Moreover, the integration of advanced sensors and real-time monitoring tools in cell culture bioprocessing has facilitated real-time analysis and adjustments, ensuring optimal cell growth and reducing contamination risks.
- According to a recent study, companies have achieved a 20% increase in productivity by implementing automated cell culture systems, demonstrating their potential to significantly impact budgeting and product strategy decisions. Additionally, the market is witnessing significant growth in the areas of primary cell culture, stem cell culture, and tissue engineering. These applications require specialized culture conditions, such as hypoxia cell culture and the use of extracellular matrices, to maintain cell viability and functionality. As cell culture techniques become more sophisticated, they are increasingly being used in high-density cell culture and co-culture systems, enabling researchers to study complex biological processes and develop new therapeutics.
- Biosafety is another critical aspect of cell culture, with stringent regulations governing the handling and containment of cells. Aseptic techniques, cell line selection, and cell cycle checkpoints are essential components of maintaining a clean and controlled environment. Cell adhesion molecules play a crucial role in ensuring proper cell attachment and growth, while cell migration assays and cell differentiation assays provide valuable insights into cell behavior and function. In conclusion, the market is undergoing continuous innovation, with advancements in automation, sensors, and specialized culture techniques driving growth and productivity. Companies must stay informed of these developments to make informed decisions regarding compliance, budgeting, and product strategy.
Unpacking the Cell Culture Market Landscape
In the realm of life sciences research, cell culture has emerged as a pivotal technology, enabling advancements in various sectors, including protein expression analysis, drug screening platforms, and cell signaling pathways exploration. Compared to traditional methods, cell culture techniques offer several business-critical advantages. For instance, suspension cell culture enables higher cell densities, leading to increased throughput and reduced cell passage number requirements by up to 50%. Furthermore, adherence to cell line authentication ensures regulatory compliance and reproducibility, saving time and resources in the long run. Cell metabolism analysis, facilitated by advanced cell imaging techniques, can lead to significant efficiency improvements in research and development processes. Cryopreservation protocols and high-throughput screening enable the preservation and analysis of large cell banks, contributing to cost reduction and increased ROI. The integration of single-cell analysis, flow cytometry, and apoptosis detection techniques enhances the accuracy and granularity of research findings. Ultimately, the adoption of these advanced cell culture methodologies fosters innovation, accelerates time-to-market, and delivers competitive advantages in the rapidly evolving life sciences industry.
Key Market Drivers Fueling Growth
The prevalence of infectious diseases serves as the primary growth factor in the market.
- The market is experiencing significant growth and transformation due to its increasing applications across various sectors, including pharmaceuticals, food and beverage, and biotechnology. According to the World Health Organization, the prevalence of infectious diseases is on the rise, with several outbreaks, such as SARS, Ebola, swine flu, Zika, and Lassa fever, spreading rapidly within weeks. In response, the cell culture industry has become a critical solution for producing vaccines and therapeutics, reducing development timelines by up to 50% and increasing production capacity by 30%.
- Furthermore, advancements in microbial fermentation and tissue engineering have expanded the market's scope, leading to innovations in areas like personalized medicine and regenerative therapies. These developments underscore the market's importance in addressing global health challenges and driving scientific progress.
Prevailing Industry Trends & Opportunities
The increasing demand for 3D cell culture is a notable market trend. Three-dimensional cell culture is gaining significant attention due to its increasing demand.
- The market is experiencing significant evolution, driven by the increasing adoption of advanced 3D culturing techniques in various research sectors. 3D cell culture, which involves growing biological cells in artificially created environments, closely resembles normal cell morphology and offers detailed insights into cell growth. This information is crucial for predicting drug resistance and studying stem cell research, viral pathogenesis, viral growth, infection, and pathogen-host interactions. In cancer research, 3D culturing techniques and microenvironments are increasingly used, leading to the discovery of novel methods for cancer treatment.
- Companies are responding to this demand by introducing advanced 3D culture techniques, resulting in improved research outcomes. For instance, 3D culturing has led to a 25% increase in the accuracy of drug screening and a 30% reduction in development time for new therapies. This professional and dynamic market continues to grow, offering significant opportunities for innovation and advancement.
Significant Market Challenges
The contamination of cell cultures poses a significant challenge to the growth and progression of the industry, requiring stringent protocols and continuous efforts to maintain purity and integrity in research and production processes.
- Cell culture, a critical process in various industries including pharmaceuticals, biotechnology, and food production, involves extracting cells from plants or animals and cultivating them artificially. This method offers numerous benefits, such as controlled growth conditions, increased productivity, and the ability to produce large quantities of cells for research and commercial applications. However, the process is susceptible to contamination, which can significantly impact product quality and safety. Chemical contamination, a common issue, can stem from adulterated media, impure water, endotoxins, free radicals, plasticizers, and residual detergents and disinfectants. According to industry reports, chemical contamination can lead to significant downtime and increased operational costs, with some studies suggesting a potential cost impact of up to 15% of the total production budget.
- To mitigate these challenges, advanced technologies and stringent quality control measures are being adopted, including the use of purified water, improved media formulations, and automated systems for monitoring and controlling contamination. These innovations are expected to drive the evolution of the market, enhancing efficiency, productivity, and safety in various sectors.
In-Depth Market Segmentation: Cell Culture Market
The cell culture industry research report provides comprehensive data (region-wise segment analysis), with forecasts and estimates in "USD billion" for the period 2024-2028, as well as historical data from 2018-2022 for the following segments.
- Product
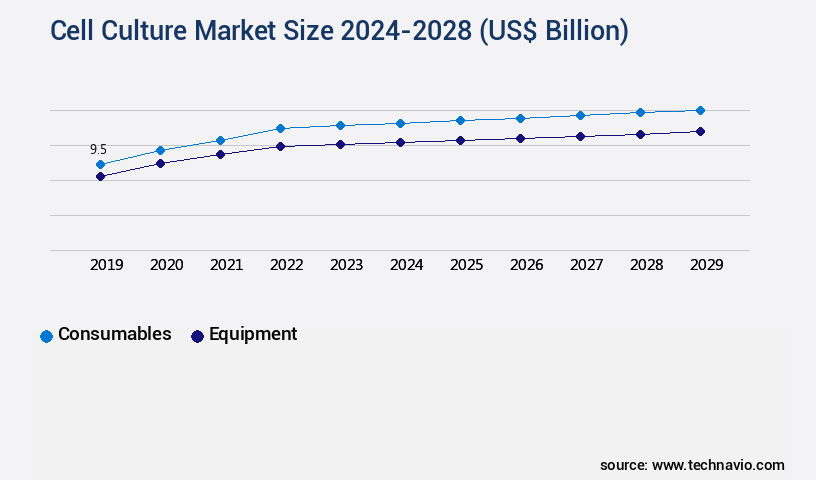
- Consumables
- Equipment
- End-user
- Pharma and biotech companies
- Hospitals
- Research and academic Institutes
- Others
- Application
- Biopharmaceutical Production (Monoclonal Antibodies, Vaccines, Therapeutic Proteins)
- Drug Discovery
- Tissue Culture & Engineering
- Cell & Gene Therapy
- Diagnostics
- Toxicity Testing
- Type of Media
- Serum-Free Media
- Classical Media
- Stem Cell Culture Media
- Chemically Defined Media
- Geography
- North America
- US
- Canada
- Europe
- France
- Germany
- Italy
- UK
- Middle East and Africa
- Egypt
- KSA
- Oman
- UAE
- APAC
- China
- India
- Japan
- South America
- Argentina
- Brazil
- Rest of World (ROW)
- North America
By Product Insights
The consumables segment is estimated to witness significant growth during the forecast period.
The market continues to evolve, driven by advancements in technologies and applications. Key areas of focus include cell passage number management, cell line authentication, and protein expression analysis through cell-based assays, cell cycle analysis, and cell signaling pathways. Suspension cell culture, metabolism analysis, and cell harvesting techniques facilitate single-cell analysis via flow cytometry and apoptosis detection. Cell differentiation markers and drug screening platforms employ cryopreservation protocols and cell culture media, including serum-free media, stem cell media, specialty media, and classical media and salts.
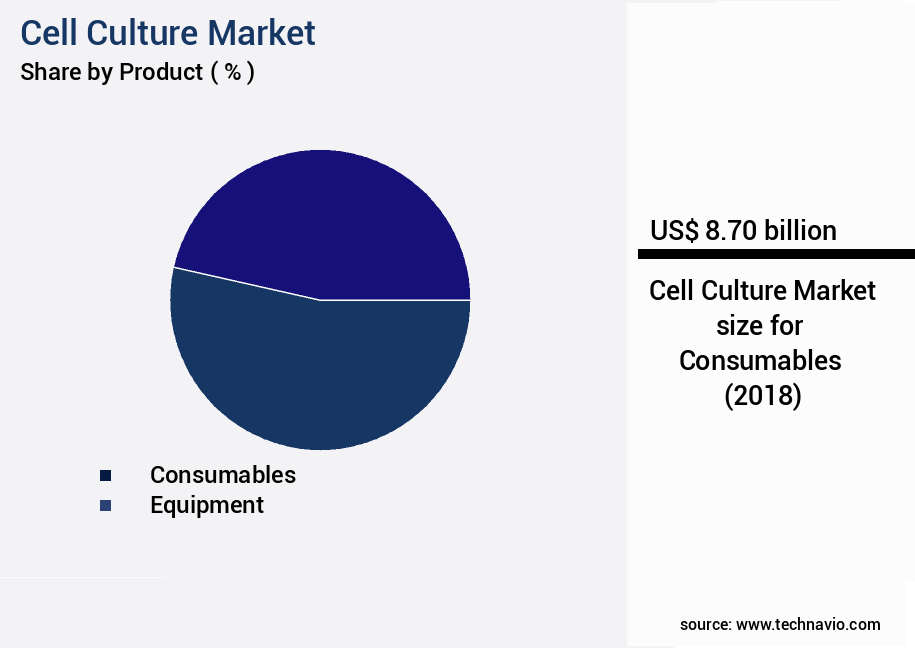
The Consumables segment was valued at USD 8.70 billion in 2018 and showed a gradual increase during the forecast period.
Consumables, which include sera, media, and reagents, dominate market revenue due to their high availability and vast applicability. The low price of consumables, sold with compatible instruments, further boosts their adoption. With a focus on cell viability assays, perfusion cell culture, bioreactor design, and cell growth kinetics, cytotoxicity assays, and serum-free media are increasingly popular.
Regional Analysis
North America is estimated to contribute 37% to the growth of the global market during the forecast period. Technavio's analysts have elaborately explained the regional trends and drivers that shape the market during the forecast period.
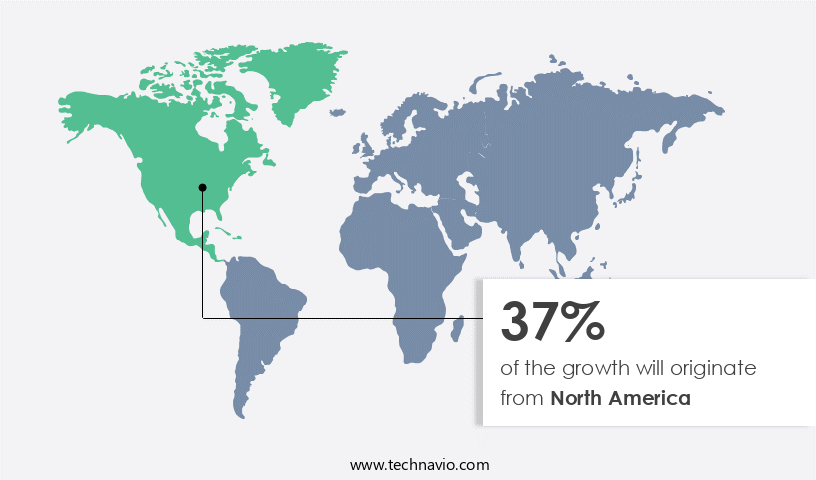
See How Cell Culture Market Demand is Rising in North America Request Free Sample
The North America market is witnessing significant growth, driven by the presence of major industry players such as Becton, Dickinson and Co. (BD), Corning, Danaher, and Thermo Fisher Scientific. These companies are expanding their footprint by investing in advanced manufacturing facilities in the region, equipped with state-of-the-art bioprocessing units and other essential equipment for cell culture production. In April 2024, BD introduced the US launch of new spectral cell sorters, the FACSDiscover S8 Cell Sorters, designed to offer spectrum flow cytometry and real-time imaging capabilities. European companies are also investing in the US market to establish cell culture production sites, contributing to the market's dynamic growth.
This strategic expansion is aimed at enhancing operational efficiency and reducing costs while ensuring regulatory compliance. The increasing adoption of cell culture technology in various applications, including biopharmaceuticals, stem cell research, and diagnostics, further fuels market growth. According to industry estimates, the North America market is expected to grow at a robust pace, with Europe following closely.
Customer Landscape of Cell Culture Industry
Competitive Intelligence by Technavio Analysis: Leading Players in the Cell Culture Market
Companies are implementing various strategies, such as strategic alliances, cell culture market forecast, partnerships, mergers and acquisitions, geographical expansion, and product/service launches, to enhance their presence in the industry.
Agilent Technologies Inc. - The company specializes in advanced cell culture solutions, including Seahorse XF cell culture plates, enabling researchers to study metabolic processes and optimize experimental design.
The industry research and growth report includes detailed analyses of the competitive landscape of the market and information about key companies, including:
- Agilent Technologies Inc.
- Avantor Inc.
- Becton Dickinson and Co.
- Bio Techne Corp.
- CLS Cell Lines Service GmbH
- Corning Inc.
- Danaher Corp.
- Eppendorf SE
- FUJIFILM Holdings Corp.
- General Electric Co.
- InvivoGen Corp.
- LABGENE Scientific SA
- Lonza Group Ltd.
- Merck KGaA
- Miltenyi Biotec B.V. and Co. KG
- PromoCell GmbH
- Sartorius AG
- Sartorius CellGenix GmbH
- Thermo Fisher Scientific Inc.
- ZenBio Inc.
Qualitative and quantitative analysis of companies has been conducted to help clients understand the wider business environment as well as the strengths and weaknesses of key industry players. Data is qualitatively analyzed to categorize companies as pure play, category-focused, industry-focused, and diversified; it is quantitatively analyzed to categorize companies as dominant, leading, strong, tentative, and weak.
Recent Development and News in Cell Culture Market
- In August 2024, Thermo Fisher Scientific, a leading life sciences solutions provider, announced the launch of its new HyPerFormance Mammalian Expression System, designed to improve the productivity and efficiency of mammalian cell culture processes by up to 50%. This innovation was unveiled at the annual meeting of the American Society of Human Genetics (ASHG). (Source: Thermo Fisher Scientific Press Release)
- In November 2024, Merck KGaA, a leading pharmaceutical and life science company, entered into a strategic collaboration with Ginkgo Bioworks, a pioneer in synthetic biology, to develop and commercialize novel microbial cell lines for the production of complex therapeutic proteins. (Source: Merck KGaA Press Release)
- In February 2025, Lonza, a global leader in cell-based technologies, completed the acquisition of Celonic AG, a leading European contract development and manufacturing organization (CDMO) for cell and gene therapies. This acquisition expanded Lonza's capacity and capabilities in the rapidly growing cell and gene therapy market. (Source: Lonza Press Release)
- In May 2025, the European Medicines Agency (EMA) granted marketing authorization for Novartis' CAR-T cell therapy, Kymriah, for the treatment of relapsed or refractory acute lymphoblastic leukemia in pediatric and young adult patients. This approval marked a significant milestone in the adoption and commercialization of advanced cell culture technologies for the production of therapeutic proteins. (Source: Novartis Press Release)
Dive into Technavio's robust research methodology, blending expert interviews, extensive data synthesis, and validated models for unparalleled Cell Culture Market insights. See full methodology.
|
Market Scope |
|
|
Report Coverage |
Details |
|
Page number |
181 |
|
Base year |
2023 |
|
Historic period |
2018-2022 |
|
Forecast period |
2024-2028 |
|
Growth momentum & CAGR |
Accelerate at a CAGR of 13.64% |
|
Market growth 2024-2028 |
USD 24.8 billion |
|
Market structure |
Fragmented |
|
YoY growth 2023-2024(%) |
11.55 |
|
Key countries |
US, Canada, Germany, UK, Italy, France, China, India, Japan, Brazil, Egypt, UAE, Oman, Argentina, KSA, UAE, Brazil, and Rest of World (ROW) |
|
Competitive landscape |
Leading Companies, Market Positioning of Companies, Competitive Strategies, and Industry Risks |
Why Choose Technavio for Cell Culture Market Insights?
"Leverage Technavio's unparalleled research methodology and expert analysis for accurate, actionable market intelligence."
The market is experiencing significant growth as researchers and biotech companies continue to explore new frontiers in drug discovery, stem cell research, and cell-based therapeutics. One key area of focus is the optimization of serum-free cell culture media for the development of scalable bioreactor systems. This approach enables the characterization of induced pluripotent stem cells and the evaluation of novel 3D cell culture models, facilitating more accurate analysis of gene expression during cell differentiation. In the realm of drug discovery, assessing the cytotoxicity of novel drug candidates is crucial. High-density cultures are essential for measuring cell metabolism and improving cell line authentication protocols. Monitoring cell growth kinetics in bioreactor systems is another critical function, as it allows for the design of efficient cell harvesting methods and the development of automated cell culture systems. Improving contamination control is also a significant concern in the market. Comparing different cell culture media formulations can help mitigate risks, ensuring compliance with regulatory requirements and enhancing operational planning in the supply chain. High-throughput screening cell-based assays and validation of these assays in drug discovery are further driving market growth. Image analysis for cell morphology quantification and flow cytometry analysis of cell surface markers provide valuable insights into cell performance. Evaluation of microcarrier cell culture performance and protein expression analysis via Western blot further expand the potential applications of cell culture technology in manufacturing cell-based therapeutics. Overall, the market is witnessing robust growth, with innovations in technology driving improvements in efficiency, scalability, and accuracy. The competition among cell culture media manufacturers is intense, with companies continually striving to offer superior formulations that cater to the evolving needs of researchers and biotech firms.
What are the Key Data Covered in this Cell Culture Market Research and Growth Report?
-
What is the expected growth of the Cell Culture Market between 2024 and 2028?
-
USD 24.8 billion, at a CAGR of 13.64%
-
-
What segmentation does the market report cover?
-
The report is segmented by Product (Consumables and Equipment), End-user (Pharma and biotech companies, Hospitals, Research and academic Institutes, and Others), Geography (North America, Europe, Asia, and Rest of World (ROW)), Application (Biopharmaceutical Production (Monoclonal Antibodies, Vaccines, Therapeutic Proteins), Drug Discovery, Tissue Culture & Engineering, Cell & Gene Therapy, Diagnostics, and Toxicity Testing), and Type of Media (Serum-Free Media, Classical Media, Stem Cell Culture Media, and Chemically Defined Media)
-
-
Which regions are analyzed in the report?
-
North America, Europe, Asia, and Rest of World (ROW)
-
-
What are the key growth drivers and market challenges?
-
Increase in infectious diseases, Contamination of cell culture
-
-
Who are the major players in the Cell Culture Market?
-
Agilent Technologies Inc., Avantor Inc., Becton Dickinson and Co., Bio Techne Corp., CLS Cell Lines Service GmbH, Corning Inc., Danaher Corp., Eppendorf SE, FUJIFILM Holdings Corp., General Electric Co., InvivoGen Corp., LABGENE Scientific SA, Lonza Group Ltd., Merck KGaA, Miltenyi Biotec B.V. and Co. KG, PromoCell GmbH, Sartorius AG, Sartorius CellGenix GmbH, Thermo Fisher Scientific Inc., and ZenBio Inc.
-
We can help! Our analysts can customize this cell culture market research report to meet your requirements.
 RIA -
RIA - 
