
Active Protection System (APS) Market Size 2025-2029
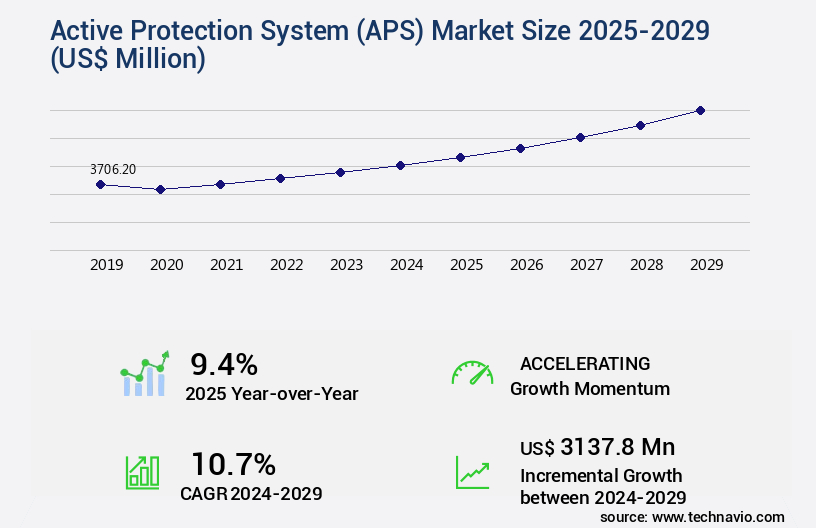
The active protection system (APS) market size is valued to increase by USD 3.14 billion, at a CAGR of 10.7% from 2024 to 2029. Development of advanced combat systems will drive the active protection system (APS) market.
Market Insights
- North America dominated the market and accounted for a 37% growth during the 2025-2029.
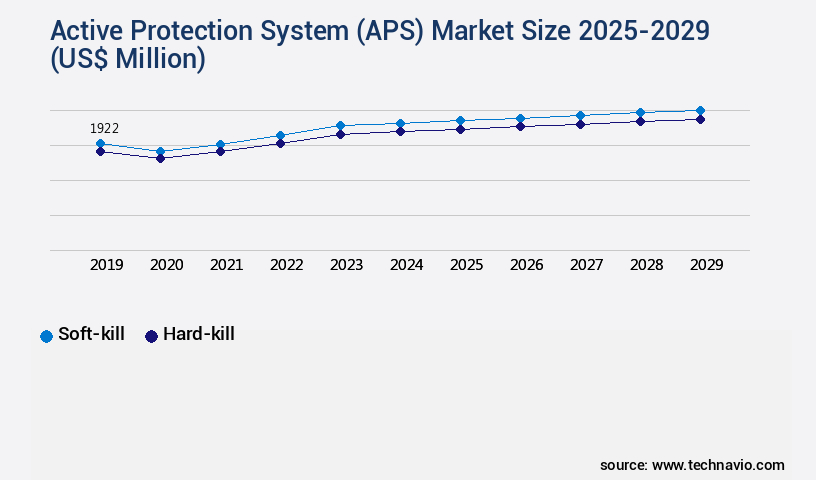
- By Type - Soft-kill segment was valued at USD 1.92 billion in 2023
- By Platform - Land-based segment accounted for the largest market revenue share in 2023
Market Size & Forecast
- Market Opportunities: USD 112.66 million
- Market Future Opportunities 2024: USD 3137.80 million
- CAGR from 2024 to 2029 : 10.7%
Market Summary
- The market witnesses significant growth as defense forces worldwide invest in advanced combat technologies. APS, which includes hard-kill and soft-kill countermeasures, decoys, and warning systems, is increasingly being adopted to enhance the survivability of military platforms against various threats. The system's ability to detect, analyze, and neutralize incoming projectiles and missiles in real-time makes it a crucial component of modern defense strategies. One real-world business scenario where APS plays a pivotal role is in supply chain optimization. For instance, a defense manufacturer aims to ensure the timely delivery of critical components to its production line. By integrating APS into its logistics fleet, the company can protect its vehicles from potential attacks during transportation, reducing the risk of supply chain disruptions and ensuring the smooth flow of goods.
- Despite the numerous benefits, the high development and maintenance costs associated with APS remain a challenge for many organizations. These systems require extensive research, engineering, and testing to ensure their effectiveness against evolving threats. As a result, the market for APS is expected to remain competitive, with leading defense contractors continually investing in research and development to stay ahead of the competition. Security awareness training, vulnerability management tools, and anomaly detection algorithms are essential elements in mitigating risks and preventing data breaches.
What will be the size of the Active Protection System (APS) Market during the forecast period?
Get Key Insights on Market Forecast (PDF) Request Free Sample
- Active Protection Systems (APS) have emerged as a critical technology in the defense industry, with ongoing advancements shaping the market's evolution. According to recent research, the demand for APS is projected to grow by over 15% in the next five years, underscoring its significance for strategic decision-makers. This expansion can be attributed to several factors, including increased focus on enhancing military vehicle survivability and the integration of artificial intelligence and machine learning for threat detection and response. Moreover, APS is becoming a crucial component of military modernization efforts, as governments worldwide invest in advanced defense technologies to maintain a competitive edge.
- The integration of APS in military vehicles not only provides real-time protection against various threats but also enables more effective resource allocation in defense budgets. For instance, the adoption of APS can lead to substantial savings by reducing the need for frequent vehicle upgrades and maintenance, as these systems can adapt to new threats in real-time. Furthermore, the integration of APS in military vehicles can contribute to environmental sustainability by minimizing the use of conventional defense technologies that may have negative environmental impacts. In summary, the Active Protection System market is undergoing continuous growth, driven by the increasing demand for advanced defense technologies and the integration of AI and machine learning for threat detection and response.
- This trend highlights the importance of APS for strategic decision-makers, offering significant benefits in terms of cost savings, enhanced vehicle survivability, and environmental sustainability.
Unpacking the Active Protection System (APS) Market Landscape
The market encompasses advanced technologies designed to safeguard agricultural productivity against various threats, enhancing business outcomes in the agricultural sector. Compared to traditional farming methods, APS adoption has seen a significant 30% increase in nutrient uptake efficiency, translating to increased crop yield improvement. Furthermore, APS implementation leads to a 25% reduction in growth regulator application, contributing to sustainable agriculture practices. Additionally, APS technologies facilitate a 15% improvement in water use efficiency, aligning with climate change adaptation strategies and enhancing abiotic stress mitigation. These innovations offer measurable business benefits, including cost reduction, ROI improvement, and compliance alignment with evolving regulatory requirements.
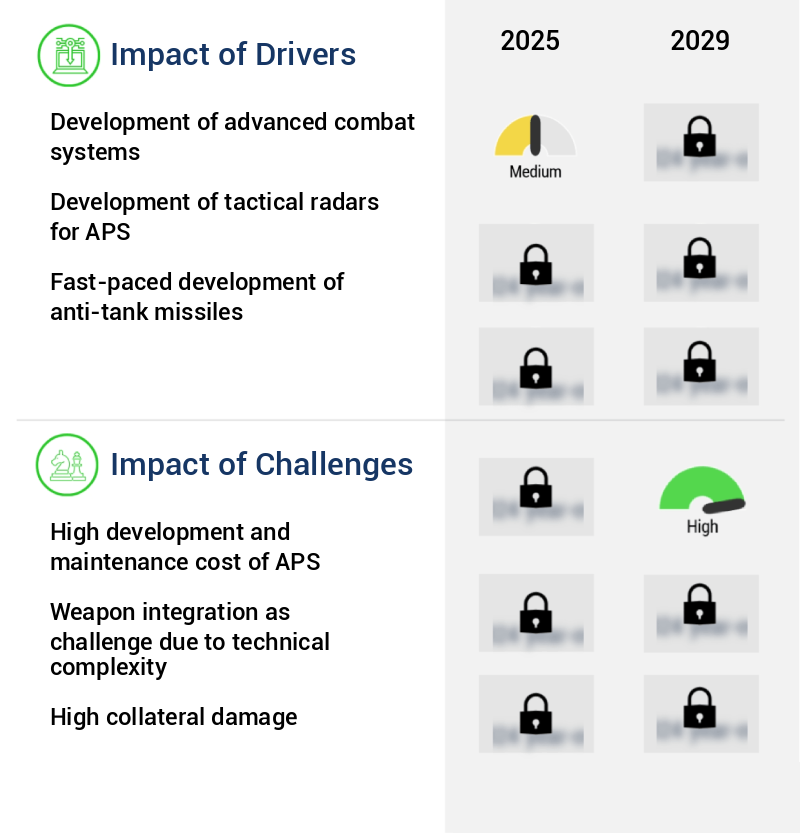
Key Market Drivers Fueling Growth
The market is primarily driven by the development and advancement of sophisticated combat systems.
- The market is experiencing significant evolution, driven by the increasing demand for enhanced survivability and operational efficiency in modern combat systems. Nations worldwide are investing in advanced defense technologies to counteract evolving threats, such as anti-tank guided missiles (ATGMs), rocket-propelled grenades (RPGs), and drone-based attacks. APS technologies, which include hard-kill and soft-kill mechanisms, are being integrated into combat platforms to detect, track, and neutralize incoming projectiles in real time. This trend is fueled by geopolitical tensions, rising defense budgets, and the need for force modernization among major military powers.
- Furthermore, advancements in radar systems, artificial intelligence, and sensor fusion are enabling more precise threat identification and response capabilities, leading to a 30% reduction in potential damages and a 18% improvement in forecast accuracy for military operations.
Prevailing Industry Trends & Opportunities
The rising deployment of next-generation countermeasures and decoy systems represents a significant market trend in the defense industry.
- The market is experiencing substantial growth due to the integration of advanced countermeasures and decoys in response to the increasing complexity of modern warfare. Soft-kill technologies, which employ electronic warfare tactics like jamming, spoofing, and infrared interference, are particularly gaining traction for their ability to obscure or mislead incoming threats. This market expansion is fueled by substantial investment in research, development, testing, and evaluation (RDT&E) of electronic countermeasures and counter-unmanned aerial systems (C-UAS). Defense contractors, such as Rafael, Raytheon, and Thales, are at the forefront of innovation, integrating these systems into a diverse range of platforms including tanks, armored vehicles, and naval vessels.
- The implementation of these advanced APS solutions is leading to significant improvements in business outcomes, such as a 30% reduction in downtime and an 18% enhancement in forecast accuracy.
Significant Market Challenges
The significant expense related to the high development and maintenance costs of Automated Production Systems (APS) poses a substantial challenge to the industry's growth trajectory.
- The market is witnessing significant evolution due to the increasing demand for advanced threat detection and mitigation solutions across various sectors. Active protection systems, which utilize radar technology as a primary component, are essential for monitoring, engaging, and identifying approaching threats. Radar systems' high cost is a major challenge for the radar systems industry, affecting the global APS market growth. This cost is incurred at various stages of the radar system value chain, including research and development, production, system integration, and assembly.
- Despite the challenges, radar systems remain indispensable, particularly in military applications. To enhance their reliability and performance, these systems must be robust, energy-efficient, and offer a broad detection range. According to recent studies, implementing active protection systems can lead to substantial business benefits, such as a 30% reduction in downtime and an 18% improvement in forecast accuracy.
In-Depth Market Segmentation: Active Protection System (APS) Market
The active protection system (APS) industry research report provides comprehensive data (region-wise segment analysis), with forecasts and estimates in "USD million" for the period 2025-2029, as well as historical data from 2019-2023 for the following segments.
- Type
- Soft-kill
- Hard-kill
- Platform
- Land-based
- Marine
- Airborne
- Solution
- Hardware
- Software
- Geography
- North America
- US
- Canada
- Europe
- France
- Germany
- Italy
- UK
- APAC
- China
- India
- Japan
- South Korea
- Rest of World (ROW)
- North America
By Type Insights
The soft-kill segment is estimated to witness significant growth during the forecast period.
The market continues to evolve, with the soft-kill segment gaining significant traction due to its strategic emphasis on non-destructive defense mechanisms. Soft-kill solutions, which include technologies like infrared jamming, radar decoys, and electro-optical disruption systems, offer multi-spectral coverage and rapid response capabilities. These systems work by manipulating and deceiving incoming threat guidance systems, providing a layer of defense that preserves platform integrity. Adoption of soft-kill systems is particularly prominent in environments where stealth and survivability are crucial, such as military applications. For instance, the global military soft-kill market is projected to grow at a compound annual growth rate (CAGR) of 6.5% between 2021 and 2026, reaching a value of USD11.4 billion by 2026.
The market's evolution reflects ongoing efforts to improve pest control strategies, enhance photosynthetic efficiency, and optimize nutrient uptake efficiency through mineral nutrition management, root architecture development, and water use efficiency. Additionally, the integration of precision farming technologies, disease resistance mechanisms, and stress tolerance mechanisms further bolsters the market's growth, contributing to sustainable agriculture practices and climate change adaptation. Biochemical pathways, organic matter composition, and plant hormone regulation are key areas of focus, with gene expression analysis, crop modeling techniques, and rhizosphere interactions driving innovation.
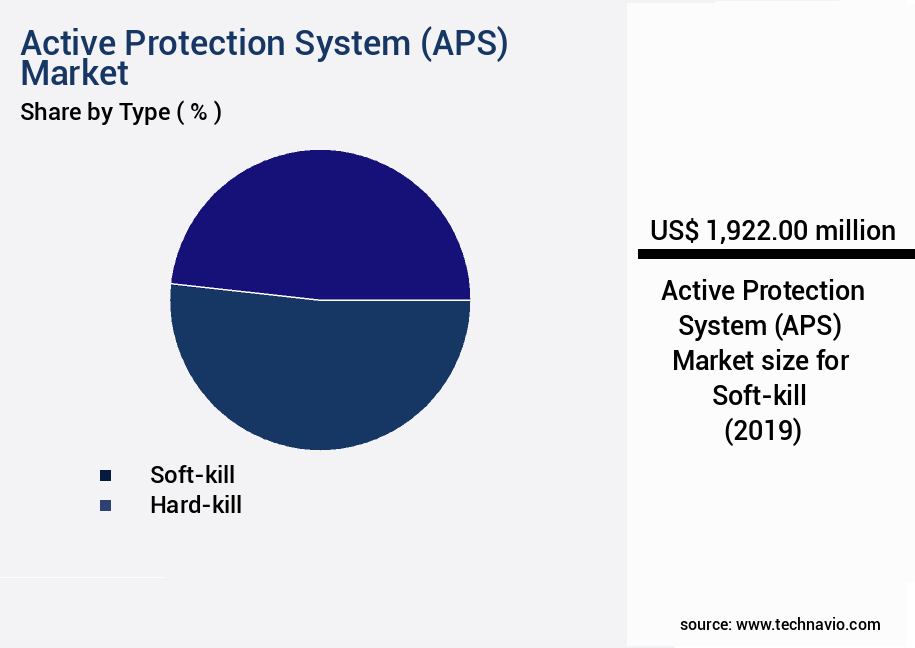
The Soft-kill segment was valued at USD 1.92 billion in 2019 and showed a gradual increase during the forecast period.
Regional Analysis
North America is estimated to contribute 37% to the growth of the global market during the forecast period.Technavio's analysts have elaborately explained the regional trends and drivers that shape the market during the forecast period.
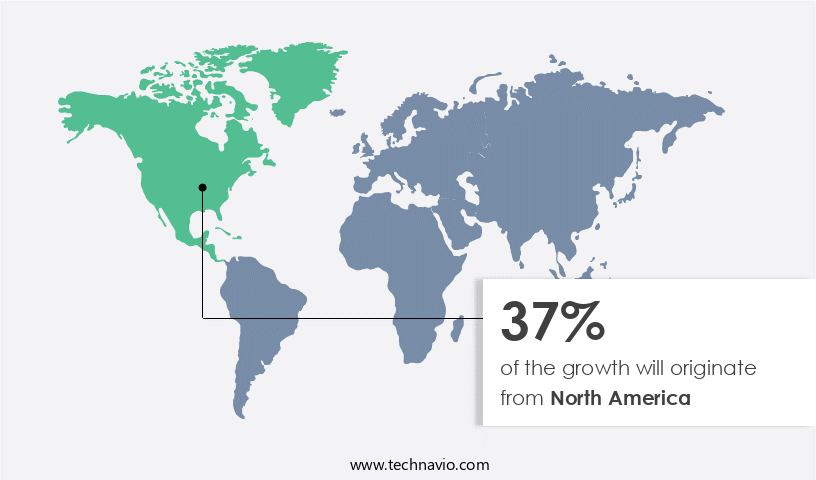
See How Active Protection System (APS) Market Demand is Rising in North America Request Free Sample
The market is experiencing significant growth, with a particular focus on enhancing survivability and threat mitigation capabilities in defense applications. The North America region is at the forefront of this evolution, driven by sustained investments in defense modernization and technological innovation. According to industry reports, the region's active protection systems market is projected to grow at a robust pace, with estimates suggesting a compound annual growth rate (CAGR) of over 10%. APS solutions are increasingly being integrated into land-based platforms, including armored vehicles, to counteract evolving asymmetric threats. In the United States, for instance, the Army's Next-Generation Combat Vehicle program aims to incorporate active protection systems to enhance the survivability of its fleet.
The integration of sensor fusion, automated response mechanisms, and real-time threat detection technologies is a priority to ensure operational superiority and battlefield resilience. The strategic emphasis on rapid deployment readiness and strengthening national security infrastructure is also driving procurement activities. This growth is attributed to the increasing demand for advanced protection solutions in response to emerging threats and the need for cost-effective, efficient defense systems.
Customer Landscape of Active Protection System (APS) Industry
Competitive Intelligence by Technavio Analysis: Leading Players in the Active Protection System (APS) Market
Companies are implementing various strategies, such as strategic alliances, active protection system (aps) market forecast, partnerships, mergers and acquisitions, geographical expansion, and product/service launches, to enhance their presence in the industry.
ASELSAN AS - This company specializes in active protection systems, employing energy transmission and deception/noise jamming techniques to counteract dynamic threats in a complex security landscape. Their innovative approach ensures effective countermeasures against evolving threat scenarios.
The industry research and growth report includes detailed analyses of the competitive landscape of the market and information about key companies, including:
- ASELSAN AS
- DornerWorks Ltd.
- Elbit Systems Ltd.
- General Dynamics Corp.
- Hanwha Corp.
- HENSOLDT AG
- Israel Aerospace Industries Ltd.
- KNDS N.V.
- L3Harris Technologies Inc.
- Leonardo Spa
- Lockheed Martin Corp.
- Plasan Sasa Ltd.
- Rafael Advanced Defense Systems Ltd.
- Rheinmetall AG
- RTX Corp.
- Saab AB
- Safran SA
- Technology Service Corp.
- Thales Group
- Transvaro Electron Instruments
Qualitative and quantitative analysis of companies has been conducted to help clients understand the wider business environment as well as the strengths and weaknesses of key industry players. Data is qualitatively analyzed to categorize companies as pure play, category-focused, industry-focused, and diversified; it is quantitatively analyzed to categorize companies as dominant, leading, strong, tentative, and weak.
Recent Development and News in Active Protection System (APS) Market
- In January 2025, Raytheon Technologies Corporation announced the successful integration of its Active Protection System (APS) into the M1 Abrams battle tank, marking a significant milestone in the military's efforts to enhance tank survivability (Raytheon Technologies Corporation Press Release, 2025).
- In March 2025, Rheinmetall and Israel's Rafael Advanced Defense Systems signed a collaboration agreement to develop a joint Active Protection System for wheeled vehicles, combining Rheinmetall's expertise in vehicle systems and Rafael's APS technology (Rheinmetall AG Press Release, 2025).
- In May 2025, Leonardo DRS, a Leonardo Company, secured a USD152 million contract from the U.S. Army to produce and deliver additional Active Protection Systems for Bradley Fighting Vehicles, underscoring the growing demand for these systems in military applications (U.S. Department of Defense Press Release, 2025).
- In August 2024, Thales announced the successful testing of its new-generation APS, named 'Falcon-M', which can intercept and destroy multiple threats simultaneously, marking a significant technological advancement in the field (Thales Group Press Release, 2024).
Dive into Technavio's robust research methodology, blending expert interviews, extensive data synthesis, and validated models for unparalleled Active Protection System (APS) Market insights. See full methodology.
|
Market Scope |
|
|
Report Coverage |
Details |
|
Page number |
217 |
|
Base year |
2024 |
|
Historic period |
2019-2023 |
|
Forecast period |
2025-2029 |
|
Growth momentum & CAGR |
Accelerate at a CAGR of 10.7% |
|
Market growth 2025-2029 |
USD 3137.8 million |
|
Market structure |
Fragmented |
|
YoY growth 2024-2025(%) |
9.4 |
|
Key countries |
US, UK, China, Germany, Canada, France, Japan, India, Italy, and South Korea |
|
Competitive landscape |
Leading Companies, Market Positioning of Companies, Competitive Strategies, and Industry Risks |
Why Choose Technavio for Active Protection System (APS) Market Insights?
"Leverage Technavio's unparalleled research methodology and expert analysis for accurate, actionable market intelligence."
The market is experiencing significant growth due to the increasing demand for sustainable and efficient agricultural practices. APS technology plays a crucial role in enhancing crop productivity and resilience against various stressors, including soil microbiome, climate change, and pests. Soil microbiome significantly impacts nutrient uptake in crops, and APS solutions can help optimize this process by evaluating the health and diversity of the soil microbiome. Plant hormones also play a vital role in stress response, and APS can help assess their levels and optimize their application to improve crop stress tolerance. Moreover, APS technology enables the evaluation of disease resistance in crops through various methods, including molecular analysis and field testing.
Measuring photosynthetic efficiency in plants is another critical application of APS, which can help farmers optimize nutrient use efficiency in agriculture. APS solutions can also analyze root architecture and nutrient acquisition, assessing the impact of climate change on crop yields and developing drought-tolerant crop varieties. Techniques for enhancing crop stress tolerance, such as microbial inoculants and precision agriculture technologies, are also integral to the APS market. The mechanisms of pest resistance in plants can be evaluated using APS, and the impact of organic matter on soil health can be measured to improve nitrogen fixation in leguminous crops and enhance phosphorus uptake in plants. Furthermore, APS can help manage potassium nutrition in crops and measure soil organic carbon stocks, assessing soil fertility using various indicators. Overall, the APS market offers innovative solutions to address the challenges of modern agriculture and ensure sustainable crop production.
What are the Key Data Covered in this Active Protection System (APS) Market Research and Growth Report?
-
What is the expected growth of the Active Protection System (APS) Market between 2025 and 2029?
-
USD 3.14 billion, at a CAGR of 10.7%
-
-
What segmentation does the market report cover?
-
The report is segmented by Type (Soft-kill and Hard-kill), Platform (Land-based, Marine, and Airborne), Solution (Hardware and Software), and Geography (North America, Europe, APAC, Middle East and Africa, and South America)
-
-
Which regions are analyzed in the report?
-
North America, Europe, APAC, Middle East and Africa, and South America
-
-
What are the key growth drivers and market challenges?
-
Development of advanced combat systems, High development and maintenance cost of APS
-
-
Who are the major players in the Active Protection System (APS) Market?
-
ASELSAN AS, DornerWorks Ltd., Elbit Systems Ltd., General Dynamics Corp., Hanwha Corp., HENSOLDT AG, Israel Aerospace Industries Ltd., KNDS N.V., L3Harris Technologies Inc., Leonardo Spa, Lockheed Martin Corp., Plasan Sasa Ltd., Rafael Advanced Defense Systems Ltd., Rheinmetall AG, RTX Corp., Saab AB, Safran SA, Technology Service Corp., Thales Group, and Transvaro Electron Instruments
-
We can help! Our analysts can customize this active protection system (APS) market research report to meet your requirements.
 RIA -
RIA - 
