Aeroderivative Gas Turbine Market Size 2026-2030
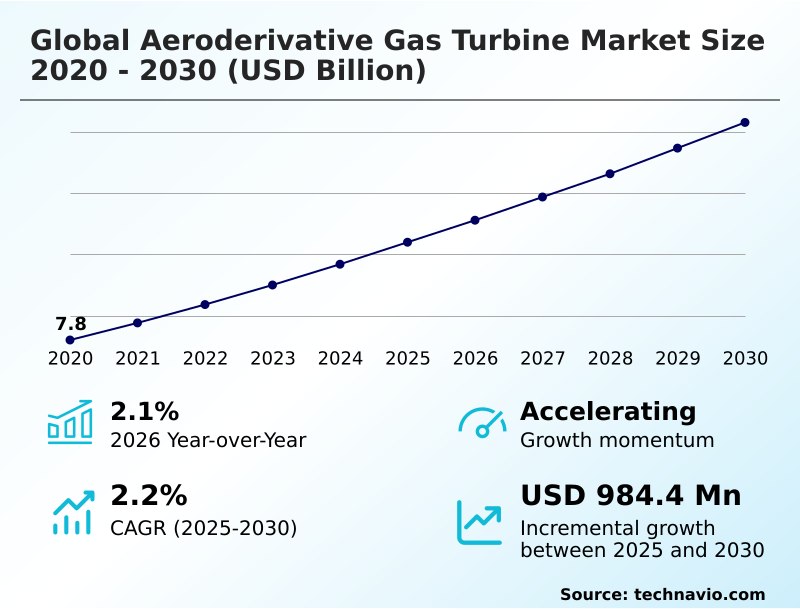
The aeroderivative gas turbine market size is valued to increase by USD 984.4 million, at a CAGR of 2.2% from 2025 to 2030. Integrating intermittent renewable energy and grid stabilization requirements will drive the aeroderivative gas turbine market.
Major Market Trends & Insights
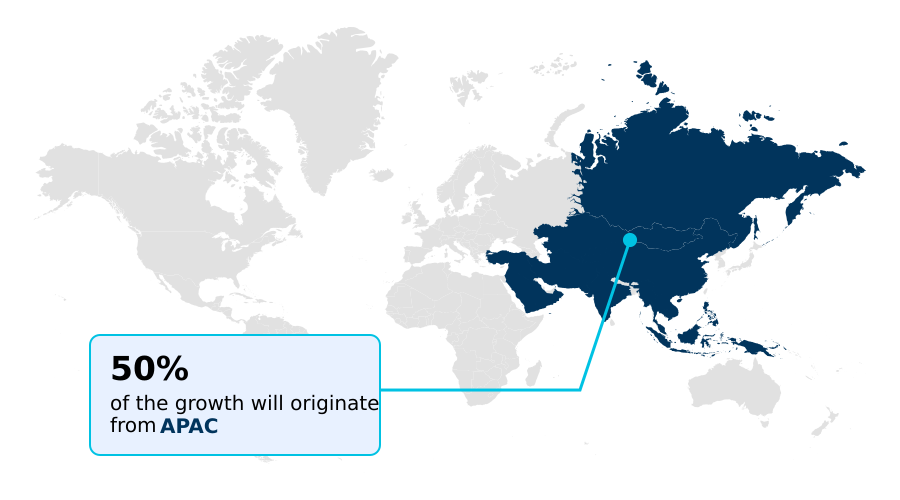
- APAC dominated the market and accounted for a 49.6% growth during the forecast period.
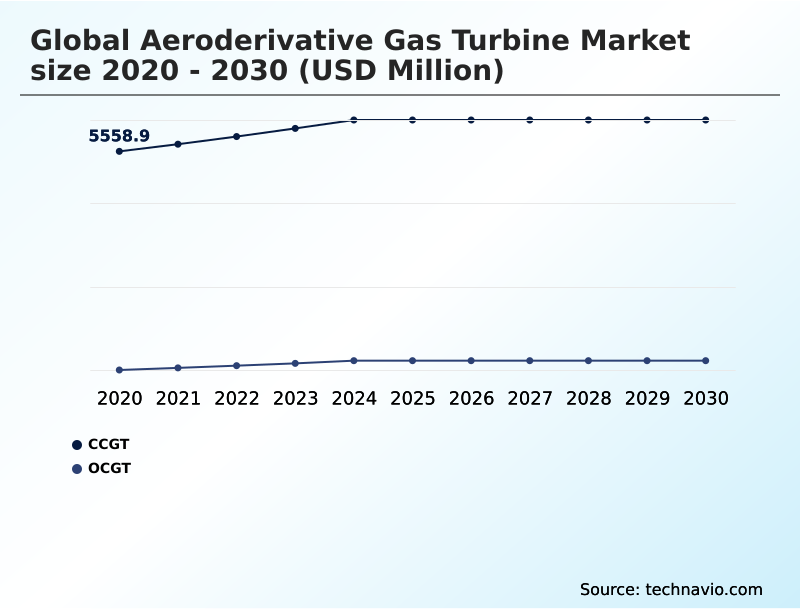
- By Technology - CCGT segment was valued at USD 6.03 billion in 2024
- By End-user - Power generation segment accounted for the largest market revenue share in 2024
Market Size & Forecast
- Market Opportunities: USD 1.78 billion
- Market Future Opportunities: USD 984.4 million
- CAGR from 2025 to 2030 : 2.2%
Market Summary
- The aeroderivative gas turbine market is shaped by the need for flexible, high-efficiency power solutions capable of supporting the global energy transition. These systems, derived from aviation engine technology, are crucial for balancing electrical grids with high penetration of intermittent renewable energy sources.
- A key driver is the exponential growth of mission-critical digital infrastructure, where data centers for AI require uninterruptible power that often exceeds local grid capacity. In response, operators are deploying behind-the-meter power solutions. For instance, a utility provider facing grid frequency instability might invest in a fleet of aeroderivative units.
- Their fast-start capability allows the operator to bid into lucrative ancillary service markets and avoid penalties associated with power shortfalls, turning an operational challenge into a revenue opportunity. This dynamic is complemented by a trend toward fuel flexibility, with significant investment in hydrogen co-firing and advanced combustion systems to reduce emissions.
- However, the industry grapples with significant supply chain constraints for high-temperature materials and components, creating procurement-centric challenges for project developers.
What will be the Size of the Aeroderivative Gas Turbine Market during the forecast period?
Get Key Insights on Market Forecast (PDF) Get Free Sample
How is the Aeroderivative Gas Turbine Market Segmented?
The aeroderivative gas turbine industry research report provides comprehensive data (region-wise segment analysis), with forecasts and estimates in "USD million" for the period 2026-2030, as well as historical data from 2020-2024 for the following segments.
- Technology
- CCGT
- OCGT
- End-user
- Power generation
- Oil and gas
- Mobility
- Capacity
- More than 31-100 MW
- Less than 30 MW
- Above 100 MW
- Geography
- APAC
- China
- Japan
- India
- North America
- US
- Canada
- Mexico
- Europe
- Germany
- UK
- France
- Middle East and Africa
- Saudi Arabia
- UAE
- South Africa
- South America
- Brazil
- Argentina
- Rest of World (ROW)
- APAC
By Technology Insights
The ccgt segment is estimated to witness significant growth during the forecast period.
The Combined Cycle Gas Turbine (CCGT) segment is defined by high thermal efficiency, making it ideal for base-load power generation.
This aeroderivative technology functions by pairing a gas turbine with a heat recovery steam generator, a configuration that enables efficiency levels often exceeding 60%.
The modular design of these cogeneration systems provides operators with the operational agility to meet grid demands while supporting district heating. As industrial users prioritize energy security, CCGT systems built on flexible peaking capabilities are essential for the energy transition.
The use of advanced combustion systems and dual-fuel capabilities within this framework ensures both reliable power and adherence to decarbonization pathways, mitigating asset stranding risk.

The CCGT segment was valued at USD 6.03 billion in 2024 and showed a gradual increase during the forecast period.
Regional Analysis
APAC is estimated to contribute 49.6% to the growth of the global market during the forecast period.Technavio’s analysts have elaborately explained the regional trends and drivers that shape the market during the forecast period.
See How Aeroderivative Gas Turbine Market Demand is Rising in APAC Get Free Sample
The geographic landscape is defined by distinct regional drivers. In North America and Europe, the focus is on grid reliability and integrating renewable energy, leveraging the fast-dispatchable power of aeroderivative turbines.
Market activity in APAC, however, is propelled by industrialization and electrification, with regional growth outpacing that of North America.
In this region, a recent plant upgrade successfully reduced annual carbon dioxide emissions by over 10,000 tons, highlighting a commitment to environmental compliance alongside capacity expansion.
The need for ancillary services and the development of distributed energy hubs are common themes globally. Fuel flexibility is also a key consideration, especially in remote power solutions where access to natural gas may be limited.
The ongoing energy transition ensures that these systems remain critical for providing both peaking power and firming capacity worldwide.
Market Dynamics
Our researchers analyzed the data with 2025 as the base year, along with the key drivers, trends, and challenges. A holistic analysis of drivers will help companies refine their marketing strategies to gain a competitive advantage.
- Strategic decisions in the energy sector are increasingly shaped by a nuanced understanding of aeroderivative turbines for data centers and their role in the evolving power landscape. The debate over aeroderivative vs industrial gas turbine technology often centers on operational flexibility, where the benefits of fast-start gas turbines are crucial for grid stability.
- As utilities seek to provide reliable renewable firming, modular power plant construction allows for phased capacity additions. This approach is particularly relevant for managing turbine lifecycle costs and future-proofing thermal power assets against regulatory shifts.
- A key advantage is ramp rate; these turbines can reach full load in under ten minutes, a stark contrast to the hours required for some conventional plants, directly impacting operational planning and the ability to capitalize on ancillary services. The industry is also focused on upgrading gas turbines for efficiency and developing combustion technology for alternative fuels.
- This includes advancements in hydrogen blending in gas turbines and the deployment of high-efficiency cogeneration power plants. For sectors like oil and gas, aeroderivative turbines offer compact and reliable mechanical drives.
- Even with challenges, such as overcoming gas turbine supply chain delays, innovations in gas turbine maintenance and overhaul and the availability of mobile gas turbine power solutions continue to drive adoption, with a core focus on reducing emissions with gas turbines.
What are the key market drivers leading to the rise in the adoption of Aeroderivative Gas Turbine Industry?
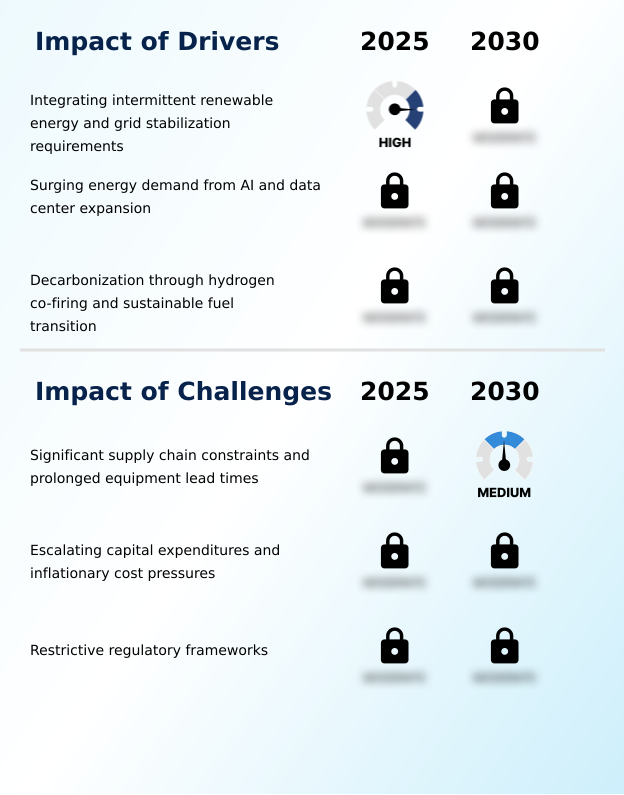
- The integration of intermittent renewable energy, coupled with the critical requirement for grid stabilization, serves as a primary driver for market growth.
- Market growth is propelled by the need for flexible power to support the modern energy grid and digital economy. The rapid expansion of intermittent renewable energy sources necessitates fast-dispatchable power solutions to ensure grid stabilization.
- Aeroderivative turbines provide this with exceptional ramp rate agility, capable of reaching full load in under ten minutes. This load following capability is critical for managing grid frequency fluctuations.
- Furthermore, the surging energy demand from AI and data centers is a transformative driver, leading to major agreements for equipment delivery, such as a recent deal for 29 turbine packages to power AI infrastructure.
- This demand for uninterruptible power has led to a focus on behind-the-meter power and industrial self-generation, where the high power density of these turbines is a key advantage.
What are the market trends shaping the Aeroderivative Gas Turbine Industry?
- A primary market trend is the proliferation of hydrogen-ready architectures, a development that aligns with broader decarbonization pathways for sustainable fuel transitions.
- Key market trends are centered on decarbonization and digitalization. The industry is pivoting toward hydrogen-ready architecture, with advancements enabling the use of alternative fuels. Successful demonstrations of 100% ammonia combustion in full-scale turbines underscore the technical viability of carbon-neutral fuel options. This trend towards enhanced fuel flexibility is critical for future-proofing assets.
- On-site power generation is expanding, driven by the intense energy demands of digital infrastructure. Concurrently, the adoption of digital twin modeling allows operators to simulate operational scenarios and predict failures, enhancing grid inertia and reliability.
- For example, a recent project in Saudi Arabia will add 3.6 gigawatts of capacity supported by a 25-year maintenance agreement, ensuring long-term operational performance and highlighting the trend toward comprehensive lifecycle support.
What challenges does the Aeroderivative Gas Turbine Industry face during its growth?
- Significant supply chain constraints and prolonged equipment lead times present a key challenge impacting the industry's growth trajectory.
- The market faces significant operational and economic headwinds. Foremost among these are severe supply chain constraints for specialized components, which have extended equipment lead times to between 18 and 36 months, shifting focus to procurement-centric viability.
- This bottleneck is compounded by inflationary pressures that have caused equipment prices to surge by approximately 195% compared to prior years, elevating the total cost of ownership and challenging the levelized cost of electricity against alternatives. Furthermore, complex regulatory frameworks and lengthy permitting processes, which can exceed 10 years for new thermal plants, create substantial delays.
- These hurdles present a mismatch between the rapid need for power, particularly for ancillary service markets, and the ability to deploy new assets.
Exclusive Technavio Analysis on Customer Landscape
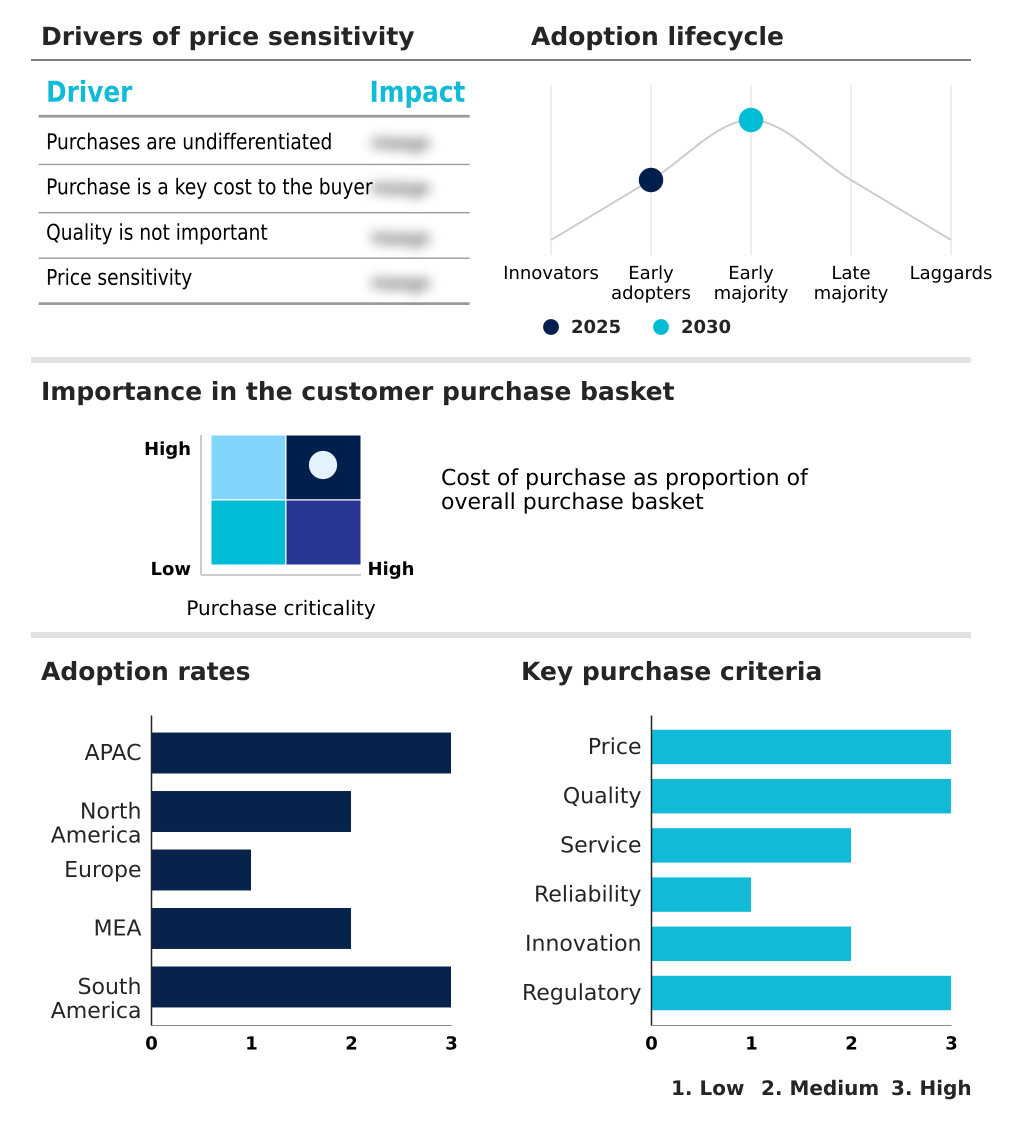
The aeroderivative gas turbine market forecasting report includes the adoption lifecycle of the market, covering from the innovator’s stage to the laggard’s stage. It focuses on adoption rates in different regions based on penetration. Furthermore, the aeroderivative gas turbine market report also includes key purchase criteria and drivers of price sensitivity to help companies evaluate and develop their market growth analysis strategies.
Customer Landscape of Aeroderivative Gas Turbine Industry
Competitive Landscape
Companies are implementing various strategies, such as strategic alliances, aeroderivative gas turbine market forecast, partnerships, mergers and acquisitions, geographical expansion, and product/service launches, to enhance their presence in the industry.
Ansaldo Energia S.p.A. - Key offerings encompass advanced aeroderivative turbines for high-efficiency power generation and critical industrial applications, addressing modern flexible power needs.
The industry research and growth report includes detailed analyses of the competitive landscape of the market and information about key companies, including:
- Ansaldo Energia S.p.A.
- ARANER
- Baker Hughes Co.
- Bharat Heavy Electricals Ltd.
- Capstone Green Energy Corp.
- Centrax Ltd.
- Doosan Enerbility Co. Ltd.
- GE Vernova Inc.
- Harbin Electric Co. Ltd.
- IHI Corp.
- Kawasaki Heavy Industries Ltd.
- MAN Energy Solutions SE
- MAPNA Turbine Company
- Mitsubishi Heavy Industries
- MTU Aero Engines AG
- Pratt and Whitney
- Rolls Royce Holdings Plc
- Siemens Energy AG
- Solar Turbines Inc.
- Vericor Power Systems
Qualitative and quantitative analysis of companies has been conducted to help clients understand the wider business environment as well as the strengths and weaknesses of key industry players. Data is qualitatively analyzed to categorize companies as pure play, category-focused, industry-focused, and diversified; it is quantitatively analyzed to categorize companies as dominant, leading, strong, tentative, and weak.
Recent Development and News in Aeroderivative gas turbine market
- In December 2024, GE Vernova and Crusoe finalized an agreement that included an initial order for 10 LM2500XPRESS turbine packages intended to supply power for AI-focused data centers.
- In March 2025, Siemens Energy AG secured a significant contract to deliver six SGT6-9000HL gas turbines and provide long-term maintenance services for two major gas-fired power plants in Saudi Arabia, adding 3.6 gigawatts of capacity.
- In April 2025, GE Vernova introduced its AGP XPAND upgrade, a technical solution designed to boost the performance and operational flexibility of gas turbine fleets to support high-demand industrial clusters.
- In May 2025, GE Vernova Inc. announced a partnership with United Power and Kindle Energy to deploy six LM2500XPRESS aeroderivative gas turbines in Colorado, enhancing flexible capacity for renewables integration.
Dive into Technavio’s robust research methodology, blending expert interviews, extensive data synthesis, and validated models for unparalleled Aeroderivative Gas Turbine Market insights. See full methodology.
| Market Scope | |
|---|---|
| Page number | 294 |
| Base year | 2025 |
| Historic period | 2020-2024 |
| Forecast period | 2026-2030 |
| Growth momentum & CAGR | Accelerate at a CAGR of 2.2% |
| Market growth 2026-2030 | USD 984.4 million |
| Market structure | Fragmented |
| YoY growth 2025-2026(%) | 2.1% |
| Key countries | China, Japan, India, South Korea, Australia, Indonesia, US, Canada, Mexico, Germany, UK, France, Italy, Spain, The Netherlands, Saudi Arabia, UAE, South Africa, Israel, Turkey, Brazil, Argentina and Chile |
| Competitive landscape | Leading Companies, Market Positioning of Companies, Competitive Strategies, and Industry Risks |
Research Analyst Overview
- The aeroderivative gas turbine market is centered on providing high-performance, flexible power solutions. The core aeroderivative technology, encompassing both combined cycle gas turbine and open cycle gas turbine configurations, is critical for decentralized power generation.
- A key trend driving boardroom decisions on capital expenditure is the push for fuel flexibility and decarbonization, exemplified by breakthroughs in hydrogen co-firing and the successful demonstration of 100% ammonia combustion. This achievement in developing new combustion systems offers a clear path to utilizing low-carbon fuels and synthetic natural gas, mitigating the risk of stranded assets.
- Firms are leveraging digital twin modeling and predictive maintenance to enhance the operational lifecycle of these systems, which are essential for grid stabilization and providing peaking power. The technology’s ramp rate agility and fast-start capability are indispensable for balancing intermittent renewable energy.
- As a result, these turbines, known for their high power-to-weight ratio and modular design, are fundamental for applications ranging from mechanical drive and cogeneration systems to ensuring power for mission-critical digital infrastructure, all while supporting load following and managing grid frequency.
What are the Key Data Covered in this Aeroderivative Gas Turbine Market Research and Growth Report?
-
What is the expected growth of the Aeroderivative Gas Turbine Market between 2026 and 2030?
-
USD 984.4 million, at a CAGR of 2.2%
-
-
What segmentation does the market report cover?
-
The report is segmented by Technology (CCGT, and OCGT), End-user (Power generation, Oil and gas, and Mobility), Capacity (More than 31-100 MW, Less than 30 MW, and Above 100 MW) and Geography (APAC, North America, Europe, Middle East and Africa, South America)
-
-
Which regions are analyzed in the report?
-
APAC, North America, Europe, Middle East and Africa and South America
-
-
What are the key growth drivers and market challenges?
-
Integrating intermittent renewable energy and grid stabilization requirements, Significant supply chain constraints and prolonged equipment lead times
-
-
Who are the major players in the Aeroderivative Gas Turbine Market?
-
Ansaldo Energia S.p.A., ARANER, Baker Hughes Co., Bharat Heavy Electricals Ltd., Capstone Green Energy Corp., Centrax Ltd., Doosan Enerbility Co. Ltd., GE Vernova Inc., Harbin Electric Co. Ltd., IHI Corp., Kawasaki Heavy Industries Ltd., MAN Energy Solutions SE, MAPNA Turbine Company, Mitsubishi Heavy Industries, MTU Aero Engines AG, Pratt and Whitney, Rolls Royce Holdings Plc, Siemens Energy AG, Solar Turbines Inc. and Vericor Power Systems
-
Market Research Insights
- Market dynamics are increasingly influenced by the dual needs for grid reliability and decarbonization. The high power density of these turbines makes them ideal for on-site power generation, especially as industrial self-generation becomes more common to ensure uninterruptible power.
- However, procurement-centric viability is a growing concern, as equipment prices have surged by approximately 195% in recent years, impacting the total cost of ownership. This pressure requires a focus on advanced control systems and condition-based monitoring to maximize uptime and efficiency.
- Upgrades to existing fleets are delivering tangible results, with some projects achieving an efficiency improvement of 0.9% while increasing power output. These resilient power solutions are essential for providing firming capacity and grid inertia, though operators must navigate complex regulatory frameworks to deploy them.
We can help! Our analysts can customize this aeroderivative gas turbine market research report to meet your requirements.
 RIA -
RIA - 
