Gas Turbine Market Analysis, Size, and Forecast 2026-2030: APAC (China, India, and Japan), North America (US, Canada, and Mexico), Europe (Germany, UK, and France), Middle East and Africa (UAE, Saudi Arabia, and South Africa), South America (Brazil and Argentina), and Rest of World (ROW)

Gas Turbine Market Analysis, Size, and Forecast 2026-2030:
APAC (China, India, and Japan), North America (US, Canada, and Mexico), Europe (Germany, UK, and France), Middle East and Africa (UAE, Saudi Arabia, and South Africa), South America (Brazil and Argentina), and Rest of World (ROW)

Published: Apr 2026 324 Pages SKU: IRTNTR43446

Market Overview at a Glance

$3.43 B
Market Opportunity
2.2%
CAGR 2025 - 2030
48.5%
APAC Growth
$20.72 B
Heavy-duty gas turbine segment 2024

Gas Turbine Market Size 2026-2030

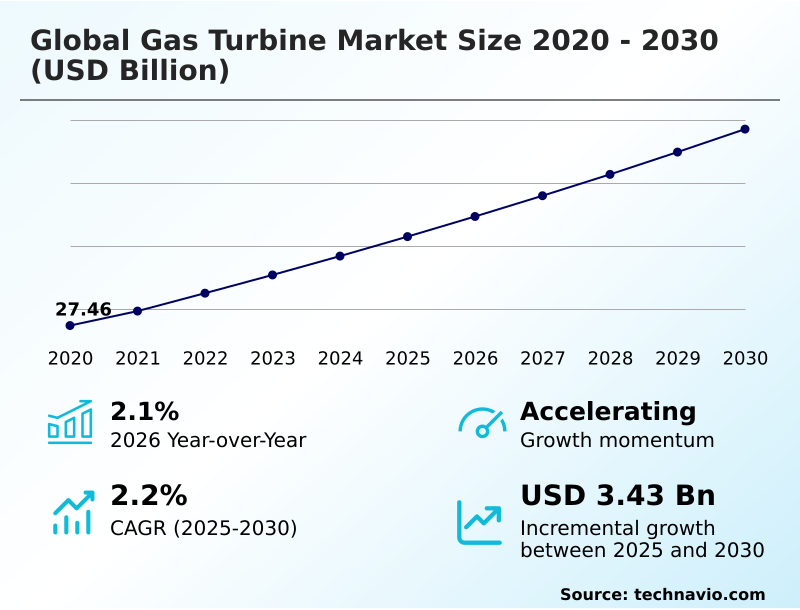
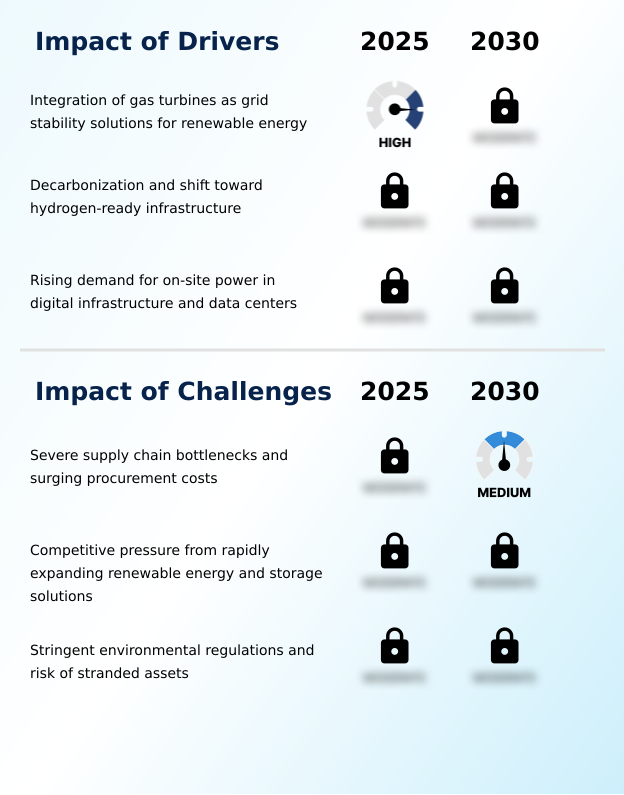
The gas turbine market size is valued to increase by USD 3.43 billion, at a CAGR of 2.2% from 2025 to 2030. Integration of gas turbines as grid stability solutions for renewable energy will drive the gas turbine market.

Major Market Trends & Insights

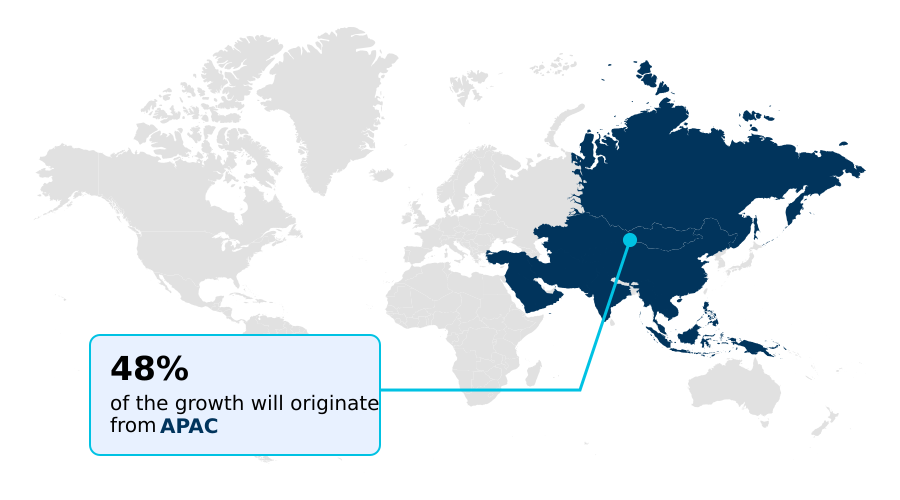
  • APAC dominated the market and accounted for a 48.5% growth during the forecast period.
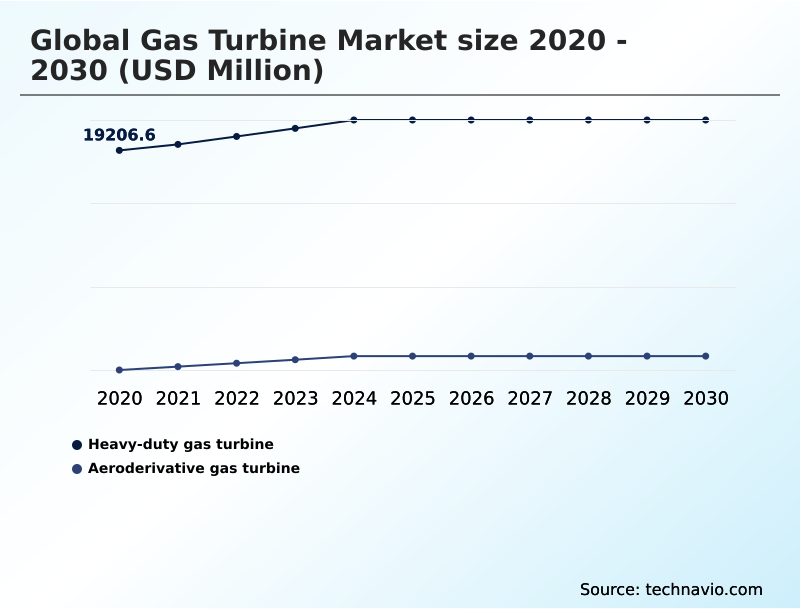
  • By Product - Heavy-duty gas turbine segment was valued at USD 20.72 billion in 2024
  • By Technology - CCGT segment accounted for the largest market revenue share in 2024

Market Size & Forecast

  • Market Opportunities: USD 6.26 billion
  • Market Future Opportunities: USD 3.43 billion
  • CAGR from 2025 to 2030 : 2.2%

Market Summary

  • The gas turbine market is undergoing a significant transformation, driven by the dual needs of decarbonization and grid reliability. The expansion of intermittent renewable energy sources necessitates the deployment of gas turbines as a critical grid stability solution, offering the fast-ramping capabilities required to balance supply and demand.
  • This role is evolving beyond a transitional phase, with significant investments in hydrogen-ready combustion system technology to ensure long-term viability. A key trend is the rise of on-site power generation for energy-intensive facilities like data centers, which utilize decentralized energy system configurations to guarantee operational continuity.
  • For instance, a hyperscale data center operator may deploy a combined heat and power (CHP) system to ensure an uninterruptible power supply, using digital twin technology for predictive maintenance analytics to maintain uptime.
  • However, the industry faces challenges related to emissions compliance and the potential for stranded asset risk, pushing for greater fuel flexibility and the adoption of advanced materials to improve the thermal efficiency of both ccgt and ocgt plants. This complex landscape requires a focus on lifecycle management and innovative fleet optimization service models.

What will be the Size of the Gas Turbine Market during the forecast period?

Get Key Insights on Market Forecast (PDF) Get Free Sample

How is the Gas Turbine Market Segmented?

The gas turbine industry research report provides comprehensive data (region-wise segment analysis), with forecasts and estimates in "USD million" for the period 2026-2030, as well as historical data from 2020-2024 for the following segments.

  • Product
    • Heavy-duty gas turbine
    • Aeroderivative gas turbine
  • Technology
    • CCGT
    • OCGT
  • End-user
    • Energy and utilities
    • Oil and gas
    • Aerospace and defense
    • Manufacturing
    • Marine
  • Capacity
    • Above 300 MW
    • More than 41-120 MW
    • More than 121-300 MW
    • Less than 40 MW
  • Geography
    • APAC
      • China
      • India
      • Japan
    • North America
      • US
      • Canada
      • Mexico
    • Europe
      • Germany
      • UK
      • France
    • Middle East and Africa
      • UAE
      • Saudi Arabia
      • South Africa
    • South America
      • Brazil
      • Argentina
    • Rest of World (ROW)

By Product Insights

The heavy-duty gas turbine segment is estimated to witness significant growth during the forecast period.

The heavy-duty gas turbine segment is central to large-scale utility power, providing reliable base-load power generation.

These systems are key components in combined cycle gas turbine (ccgt) plants, which maximize thermal efficiency by using exhaust heat recovery in a heat recovery steam generator (hrsg).

The market is advancing toward high-firing temperature turbine designs that use specialized turbine blade alloys and advanced cooling technology.

This innovation supports a clear decarbonization pathway, as new units are engineered for future fuel blends, including demonstrated capabilities for operating on mixtures with over 30% hydrogen.

This adaptability, combined with their role in providing ancillary grid services, ensures their long-term viability and requires sophisticated lifecycle management for successful project execution.

Get Free Sample

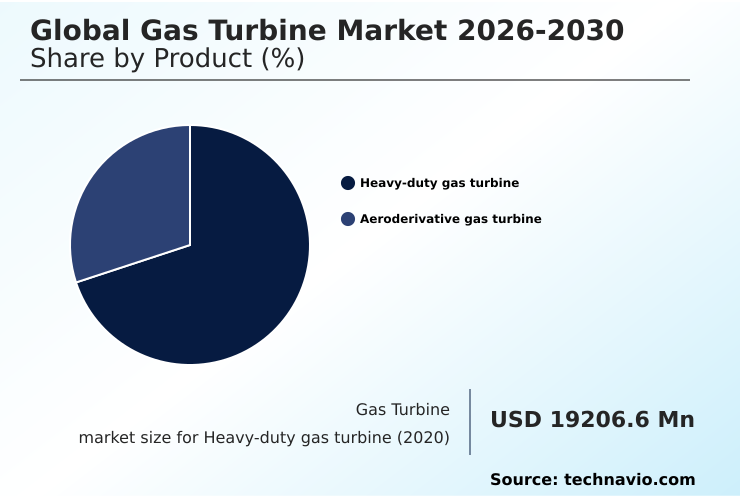
The Heavy-duty gas turbine segment was valued at USD 20.72 billion in 2024 and showed a gradual increase during the forecast period.

Get Free Sample

Regional Analysis

APAC is estimated to contribute 48.5% to the growth of the global market during the forecast period.Technavio’s analysts have elaborately explained the regional trends and drivers that shape the market during the forecast period.

See How Gas Turbine Market Demand is Rising in APAC Get Free Sample

The geographic landscape is varied, with APAC leading growth at a rate nearly double that of North America. This growth is driven by greenfield project investments in new capacity to bolster energy security.

In contrast, mature markets like Europe and North America focus on modernizing existing fleets with the h-class gas turbine and advanced materials like ceramic matrix composites (cmc) and thermal barrier coatings (tbc) to improve the capacity factor of plants.

As a key rotational inertia provider, these turbines ensure grid stability globally. Innovation in high-pressure combustion and the potential for sustainable aviation fuel (saf) derivatives are also key regional differentiators.

The varied demand affects project execution strategies, from deploying a trailer-mounted turbine unit for rapid needs to complex, long-term installations, all while managing operational readiness and a competitive levelized cost of energy (lcoe).

Market Dynamics

Our researchers analyzed the data with 2025 as the base year, along with the key drivers, trends, and challenges. A holistic analysis of drivers will help companies refine their marketing strategies to gain a competitive advantage.

  • Strategic decision-making in the power generation sector involves a detailed analysis of the efficiency of ccgt vs ocgt plants, especially when considering the gas turbine role in grid stability. For emerging applications, the selection of a gas turbine for data center power is becoming critical. Operators are carefully evaluating aeroderivative turbine maintenance costs against the benefits of their flexibility.
  • A major industry focus is on future-proofing assets through hydrogen blending in gas turbines and exploring ammonia co-firing in f-class turbines. The use of a digital twin for turbine optimization enables predictive maintenance for turbine fleets, which has been shown to reduce unplanned downtime by over 20% compared to scheduled servicing.
  • This is vital for both heavy-duty turbine for base-load power applications and gas turbine mechanical drive applications. Technologies such as thermal barrier coatings for blades and dry low emissions combustion benefits are now standard considerations. Industrial users are implementing chp systems for industrial manufacturing, while utility operators focus on upgrading turbines for fuel flexibility to integrate with renewables.
  • For new projects, understanding modular power solutions for remote sites and gas turbine applications in lng plants is essential. Engineers are also managing thermal stress in turbines to extend the lifecycle cost of h-class turbines, with carbon capture for gas power plants becoming a key consideration for regulatory compliance.

What are the key market drivers leading to the rise in the adoption of Gas Turbine Industry?

  • A key market driver is the integration of gas turbines as critical grid stability solutions to support the expansion of renewable energy.

  • Market growth is driven by the need for gas turbines as a primary grid stability solution. As renewable energy sources expand, the fast-ramping generation capability of a dispatchable power asset becomes essential for peak shaving application and grid balancing.
  • A significant driver is the demand for on-site power generation, with systems configured for industrial cogeneration and combined heat and power (chp) to support industrial electrification. This is particularly relevant for the independent power producer (ipp) sector.
  • Furthermore, the technology is a crucial energy transition asset, with the development of the hydrogen-ready combustion system for models like the f-class gas turbine.
  • These systems offer enhanced fuel flexibility, with capabilities to operate on hydrogen blends of 30% or more, bolstering energy security.

What are the market trends shaping the Gas Turbine Industry?

  • A key market trend is the acceleration of ammonia and hydrogen co-firing, reflecting a strategic industry push toward deep decarbonization.

  • Key trends are reshaping the market, led by the adoption of digital twin technology for predictive maintenance analytics, which optimizes the health of critical hot-section components and informs fleet optimization service contracts. The push for carbon-neutral fuel sources is accelerating ammonia co-firing capability in advanced j-class gas turbine models, enhancing grid resilience.
  • Concurrently, there is a rise in decentralized energy systems, particularly for brownfield redevelopment projects where an uninterruptible power supply (ups) is crucial. These systems often use the aeroderivative gas turbine, which can reach full power in under 10 minutes, a significant advantage over other thermal assets.
  • This shift toward high-efficiency solutions, where a combined cycle plant can be up to 50% more efficient, is supported by evolving commercial models like the power purchase agreement (ppa).

What challenges does the Gas Turbine Industry face during its growth?

  • A key challenge affecting industry growth involves severe supply chain bottlenecks and surging procurement costs.

  • The market faces significant hurdles, including supply chain constraints that delay the delivery of critical components like the single-crystal turbine blade, extending project timelines by several years. This impacts everything from large-scale natural gas liquefaction projects to the deployment of a modular power solution.
  • Simultaneously, there is a high stranded asset risk due to evolving regulations that mandate stringent emissions compliance and nitrogen oxide (nox) abatement, pushing operators toward investments in carbon capture and storage (ccs) or advanced gas path (agp) upgrades.
  • While technologies like dry low-emissions (dle) combustion are standard in new open cycle gas turbine (ocgt) and mechanical drive system units, the cost of retrofitting older fleets creates financial pressure, complicating aftermarket service contract renewals and decisions around providing balancing capacity.

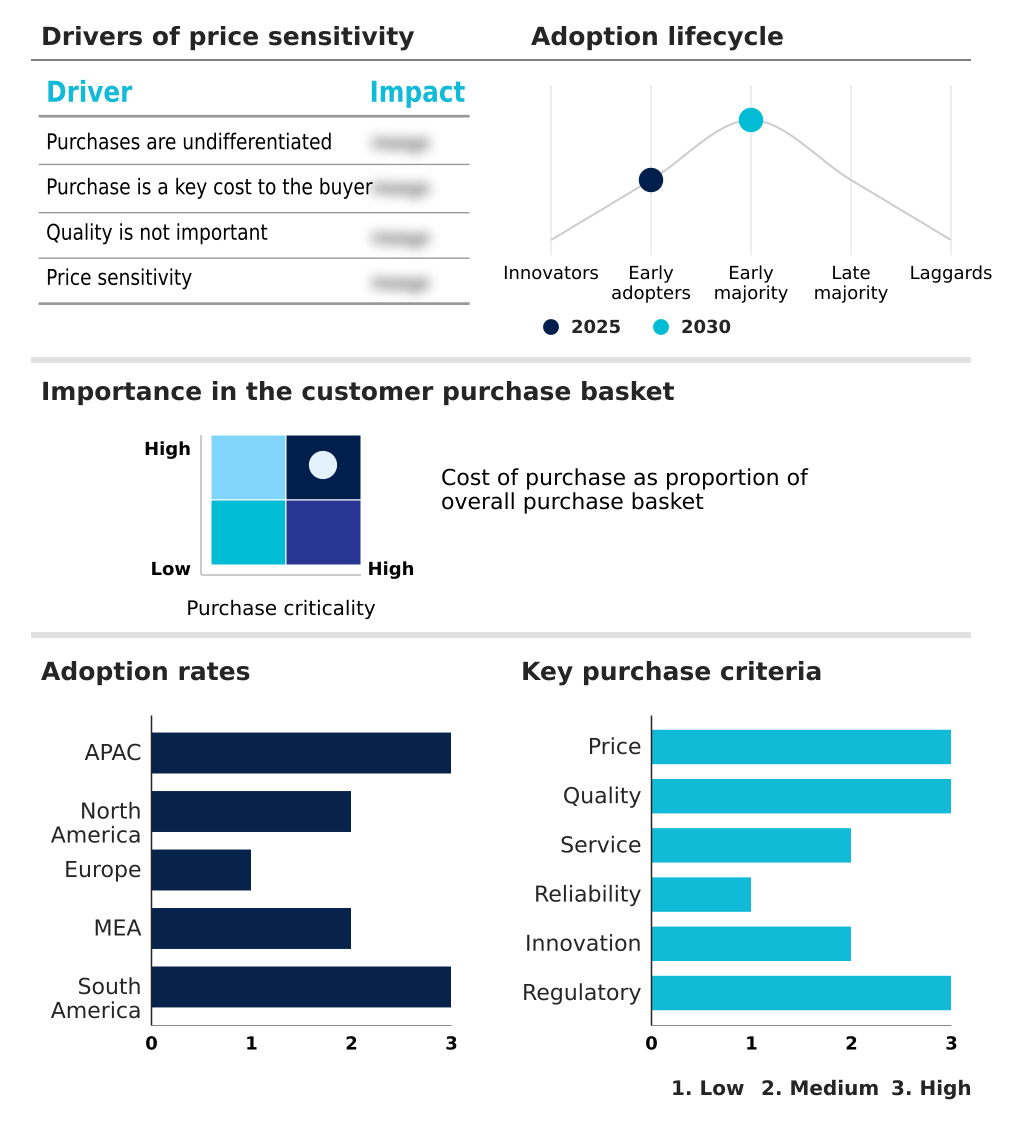
Exclusive Technavio Analysis on Customer Landscape

The gas turbine market forecasting report includes the adoption lifecycle of the market, covering from the innovator’s stage to the laggard’s stage. It focuses on adoption rates in different regions based on penetration. Furthermore, the gas turbine market report also includes key purchase criteria and drivers of price sensitivity to help companies evaluate and develop their market growth analysis strategies.

Customer Landscape of Gas Turbine Industry

Competitive Landscape

Companies are implementing various strategies, such as strategic alliances, gas turbine market forecast, partnerships, mergers and acquisitions, geographical expansion, and product/service launches, to enhance their presence in the industry.

Ansaldo Energia S.p.A. - Offers a comprehensive portfolio including aeroderivative, industrial, and heavy-duty gas turbines, designed for a wide spectrum of power generation and mechanical drive applications.

The industry research and growth report includes detailed analyses of the competitive landscape of the market and information about key companies, including:

  • Ansaldo Energia S.p.A.
  • Baker Hughes Co.
  • Bharat Heavy Electricals Ltd.
  • Capstone Green Energy Corp.
  • Doosan Enerbility Co. Ltd.
  • GE Vernova Inc.
  • HTC Corp.
  • IHI Corp.
  • Kawasaki Heavy Industries Ltd.
  • MAN Energy Solutions SE
  • Mitsubishi Heavy Industries
  • Motor Sich JSC
  • Rolls Royce Holdings Plc
  • RTX Corp.
  • Shanghai Electric Group Co.
  • Siemens Energy AG
  • Solar Turbines Inc.
  • Vericor Power Systems

Qualitative and quantitative analysis of companies has been conducted to help clients understand the wider business environment as well as the strengths and weaknesses of key industry players. Data is qualitatively analyzed to categorize companies as pure play, category-focused, industry-focused, and diversified; it is quantitatively analyzed to categorize companies as dominant, leading, strong, tentative, and weak.

Recent Development and News in Gas turbine market

  • In March, 2025, Siemens Energy AG secured a $1.6 billion project to supply six SGT6-9000HL gas turbines and other equipment for two gas-fired power plants in Saudi Arabia, adding 3.6 gigawatts of capacity.
  • In June, 2025, GE Vernova Inc. received an order for six LM2500XPRESS aeroderivative gas turbine packages to deliver approximately 224 megawatts and improve electricity reliability in Puerto Rico.
  • In July, 2025, GE Vernova and Crusoe announced an agreement for 29 LM2500XPRESS aeroderivative gas turbines to power AI data centers, expected to generate nearly 1 gigawatt of electricity.
  • In October, 2025, Siemens Energy AG agreed to supply ten gas turbines to Xcel Energy for two new power plants in Texas and New Mexico to strengthen grid reliability amid surging electricity demand.

Dive into Technavio’s robust research methodology, blending expert interviews, extensive data synthesis, and validated models for unparalleled Gas Turbine Market insights. See full methodology.

Market Scope
Page number 324
Base year 2025
Historic period 2020-2024
Forecast period 2026-2030
Growth momentum & CAGR Accelerate at a CAGR of 2.2%
Market growth 2026-2030 USD 3427.8 million
Market structure Fragmented
YoY growth 2025-2026(%) 2.1%
Key countries China, India, Japan, South Korea, Australia, Indonesia, US, Canada, Mexico, Germany, UK, France, Russia, Italy, Spain, UAE, Saudi Arabia, South Africa, Egypt, Qatar, Brazil, Argentina and Chile
Competitive landscape Leading Companies, Market Positioning of Companies, Competitive Strategies, and Industry Risks

Request Free Sample

Research Analyst Overview

  • The gas turbine market is navigating a complex transition, balancing immediate power needs with long-term decarbonization goals. A central theme is the strategic shift toward the hydrogen-ready combustion system, a move compelling boardroom-level decisions on capital expenditure.
  • Companies must weigh the upfront investment in an f-class gas turbine or h-class gas turbine with advanced gas path (agp) features against the future risk of asset obsolescence. The performance gap is significant, with modern units featuring advanced cooling technology and high-pressure combustion achieving thermal efficiencies that are multiple percentage points higher than legacy equipment.
  • The industry's evolution is evident across all applications, from the heavy-duty gas turbine used for base-load power generation to the flexible aeroderivative gas turbine in peak shaving application. Innovations in turbine blade alloys and ceramic matrix composites (cmc) are enabling high-firing temperature turbine designs. Concurrently, demand for combined heat and power (chp) and industrial cogeneration is rising.
  • Technologies like digital twin technology and predictive maintenance analytics are becoming standard for managing hot-section component health, while the deployment of a modular power solution, including the trailer-mounted turbine unit, addresses decentralized energy system needs.
  • The viability of sustainable aviation fuel (saf) and advancements in dry low-emissions (dle) combustion, single-crystal turbine blade manufacturing, and thermal barrier coatings (tbc) further define the competitive landscape for both mechanical drive system and power generation, including combined cycle gas turbine (ccgt) and open cycle gas turbine (ocgt) plants, and even natural gas liquefaction facilities where dispatchable power asset reliability with minimal exhaust heat recovery loss is crucial.

What are the Key Data Covered in this Gas Turbine Market Research and Growth Report?

  • What is the expected growth of the Gas Turbine Market between 2026 and 2030?

    • USD 3.43 billion, at a CAGR of 2.2%

  • What segmentation does the market report cover?

    • The report is segmented by Product (Heavy-duty gas turbine, and Aeroderivative gas turbine), Technology (CCGT, and OCGT), End-user (Energy and utilities, Oil and gas, Aerospace and defense, Manufacturing, and Marine), Capacity (Above 300 MW, More than 41-120 MW, More than 121-300 MW, and Less than 40 MW) and Geography (APAC, North America, Europe, Middle East and Africa, South America)

  • Which regions are analyzed in the report?

    • APAC, North America, Europe, Middle East and Africa and South America

  • What are the key growth drivers and market challenges?

    • Integration of gas turbines as grid stability solutions for renewable energy, Severe supply chain bottlenecks and surging procurement costs

  • Who are the major players in the Gas Turbine Market?

    • Ansaldo Energia S.p.A., Baker Hughes Co., Bharat Heavy Electricals Ltd., Capstone Green Energy Corp., Doosan Enerbility Co. Ltd., GE Vernova Inc., HTC Corp., IHI Corp., Kawasaki Heavy Industries Ltd., MAN Energy Solutions SE, Mitsubishi Heavy Industries, Motor Sich JSC, Rolls Royce Holdings Plc, RTX Corp., Shanghai Electric Group Co., Siemens Energy AG, Solar Turbines Inc. and Vericor Power Systems

Market Research Insights

  • Market dynamics are increasingly shaped by the push for greater operational efficiency and asset longevity. Strategic investments are geared toward upgrades that enhance the operational readiness of existing fleets, with some modernization projects delivering thermal efficiency gains of nearly 1% and power output increases exceeding 10%.
  • This focus on performance is critical for managing a competitive levelized cost of energy (lcoe), a key factor in securing long-term power purchase agreement (ppa) structures with utilities. The need for reliable balancing capacity to support renewables is driving demand for flexible assets that can maintain grid frequency regulation.
  • As a result, companies are prioritizing technologies that improve the overall capacity factor of plants, ensuring assets remain profitable and essential components of the energy mix.

We can help! Our analysts can customize this gas turbine market research report to meet your requirements.

Get in touch

1. Executive Summary

1.1 Market overview

Executive Summary - Chart on Market Overview
Executive Summary - Data Table on Market Overview
Executive Summary - Chart on Global Market Characteristics
Executive Summary - Chart on Market by Geography
Executive Summary - Chart on Market Segmentation by Product
Executive Summary - Chart on Market Segmentation by Technology
Executive Summary - Chart on Market Segmentation by End-user
Executive Summary - Chart on Market Segmentation by Capacity
Executive Summary - Chart on Incremental Growth
Executive Summary - Data Table on Incremental Growth
Executive Summary - Chart on Company Market Positioning

2. Technavio Analysis

2.1 Analysis of price sensitivity, lifecycle, customer purchase basket, adoption rates, and purchase criteria

2.2 Criticality of inputs and Factors of differentiation

Chart on Overview on criticality of inputs and factors of differentiation

2.3 Factors of disruption

Chart on Overview on factors of disruption

2.4 Impact of drivers and challenges

Chart on Impact of drivers and challenges in 2025 and 2030

3. Market Landscape

3.1 Market ecosystem

Chart on Parent Market
Data Table on - Parent Market

3.2 Market characteristics

Chart on Market characteristics analysis

3.3 Value chain analysis

Chart on Value chain analysis

4. Market Sizing

4.1 Market definition

Data Table on Offerings of companies included in the market definition

4.2 Market segment analysis

Market segments

4.3 Market size 2025

4.4 Market outlook: Forecast for 2025-2030

Chart on Global - Market size and forecast 2025-2030 ($ million)
Data Table on Global - Market size and forecast 2025-2030 ($ million)
Chart on Global Market: Year-over-year growth 2025-2030 (%)
Data Table on Global Market: Year-over-year growth 2025-2030 (%)

5. Historic Market Size

5.1 Global Gas Turbine Market 2020 - 2024

Historic Market Size - Data Table on Global Gas Turbine Market 2020 - 2024 ($ million)

5.2 Product segment analysis 2020 - 2024

Historic Market Size - Product Segment 2020 - 2024 ($ million)

5.3 Technology segment analysis 2020 - 2024

Historic Market Size - Technology Segment 2020 - 2024 ($ million)

5.4 End-user segment analysis 2020 - 2024

Historic Market Size - End-user Segment 2020 - 2024 ($ million)

5.5 Capacity segment analysis 2020 - 2024

Historic Market Size - Capacity Segment 2020 - 2024 ($ million)

5.6 Geography segment analysis 2020 - 2024

Historic Market Size - Geography Segment 2020 - 2024 ($ million)

5.7 Country segment analysis 2020 - 2024

Historic Market Size - Country Segment 2020 - 2024 ($ million)

6. Qualitative Analysis

6.1 Impact of AI on global gas turbine market

6.2 Impact of geopolitical conflict on global gas turbine market

7. Five Forces Analysis

7.1 Five forces summary

Five forces analysis - Comparison between 2025 and 2030

7.2 Bargaining power of buyers

Bargaining power of buyers - Impact of key factors 2025 and 2030

7.3 Bargaining power of suppliers

Bargaining power of suppliers - Impact of key factors in 2025 and 2030

7.4 Threat of new entrants

Threat of new entrants - Impact of key factors in 2025 and 2030

7.5 Threat of substitutes

Threat of substitutes - Impact of key factors in 2025 and 2030

7.6 Threat of rivalry

Threat of rivalry - Impact of key factors in 2025 and 2030

7.7 Market condition

Chart on Market condition - Five forces 2025 and 2030

8. Market Segmentation by Product

8.1 Market segments

Chart on Product - Market share 2025-2030 (%)
Data Table on Product - Market share 2025-2030 (%)

8.2 Comparison by Product

Chart on Comparison by Product
Data Table on Comparison by Product

8.3 Heavy-duty gas turbine - Market size and forecast 2025-2030

Chart on Heavy-duty gas turbine - Market size and forecast 2025-2030 ($ million)
Data Table on Heavy-duty gas turbine - Market size and forecast 2025-2030 ($ million)
Chart on Heavy-duty gas turbine - Year-over-year growth 2025-2030 (%)
Data Table on Heavy-duty gas turbine - Year-over-year growth 2025-2030 (%)

8.4 Aeroderivative gas turbine - Market size and forecast 2025-2030

Chart on Aeroderivative gas turbine - Market size and forecast 2025-2030 ($ million)
Data Table on Aeroderivative gas turbine - Market size and forecast 2025-2030 ($ million)
Chart on Aeroderivative gas turbine - Year-over-year growth 2025-2030 (%)
Data Table on Aeroderivative gas turbine - Year-over-year growth 2025-2030 (%)

8.5 Market opportunity by Product

Market opportunity by Product ($ million)
Data Table on Market opportunity by Product ($ million)

9. Market Segmentation by Technology

9.1 Market segments

Chart on Technology - Market share 2025-2030 (%)
Data Table on Technology - Market share 2025-2030 (%)

9.2 Comparison by Technology

Chart on Comparison by Technology
Data Table on Comparison by Technology

9.3 CCGT - Market size and forecast 2025-2030

Chart on CCGT - Market size and forecast 2025-2030 ($ million)
Data Table on CCGT - Market size and forecast 2025-2030 ($ million)
Chart on CCGT - Year-over-year growth 2025-2030 (%)
Data Table on CCGT - Year-over-year growth 2025-2030 (%)

9.4 OCGT - Market size and forecast 2025-2030

Chart on OCGT - Market size and forecast 2025-2030 ($ million)
Data Table on OCGT - Market size and forecast 2025-2030 ($ million)
Chart on OCGT - Year-over-year growth 2025-2030 (%)
Data Table on OCGT - Year-over-year growth 2025-2030 (%)

9.5 Market opportunity by Technology

Market opportunity by Technology ($ million)
Data Table on Market opportunity by Technology ($ million)

10. Market Segmentation by End-user

10.1 Market segments

Chart on End-user - Market share 2025-2030 (%)
Data Table on End-user - Market share 2025-2030 (%)

10.2 Comparison by End-user

Chart on Comparison by End-user
Data Table on Comparison by End-user

10.3 Energy and utilities - Market size and forecast 2025-2030

Chart on Energy and utilities - Market size and forecast 2025-2030 ($ million)
Data Table on Energy and utilities - Market size and forecast 2025-2030 ($ million)
Chart on Energy and utilities - Year-over-year growth 2025-2030 (%)
Data Table on Energy and utilities - Year-over-year growth 2025-2030 (%)

10.4 Oil and gas - Market size and forecast 2025-2030

Chart on Oil and gas - Market size and forecast 2025-2030 ($ million)
Data Table on Oil and gas - Market size and forecast 2025-2030 ($ million)
Chart on Oil and gas - Year-over-year growth 2025-2030 (%)
Data Table on Oil and gas - Year-over-year growth 2025-2030 (%)

10.5 Aerospace and defense - Market size and forecast 2025-2030

Chart on Aerospace and defense - Market size and forecast 2025-2030 ($ million)
Data Table on Aerospace and defense - Market size and forecast 2025-2030 ($ million)
Chart on Aerospace and defense - Year-over-year growth 2025-2030 (%)
Data Table on Aerospace and defense - Year-over-year growth 2025-2030 (%)

10.6 Manufacturing - Market size and forecast 2025-2030

Chart on Manufacturing - Market size and forecast 2025-2030 ($ million)
Data Table on Manufacturing - Market size and forecast 2025-2030 ($ million)
Chart on Manufacturing - Year-over-year growth 2025-2030 (%)
Data Table on Manufacturing - Year-over-year growth 2025-2030 (%)

10.7 Marine - Market size and forecast 2025-2030

Chart on Marine - Market size and forecast 2025-2030 ($ million)
Data Table on Marine - Market size and forecast 2025-2030 ($ million)
Chart on Marine - Year-over-year growth 2025-2030 (%)
Data Table on Marine - Year-over-year growth 2025-2030 (%)

10.8 Market opportunity by End-user

Market opportunity by End-user ($ million)
Data Table on Market opportunity by End-user ($ million)

11. Market Segmentation by Capacity

11.1 Market segments

Chart on Capacity - Market share 2025-2030 (%)
Data Table on Capacity - Market share 2025-2030 (%)

11.2 Comparison by Capacity

Chart on Comparison by Capacity
Data Table on Comparison by Capacity

11.3 Above 300 MW - Market size and forecast 2025-2030

Chart on Above 300 MW - Market size and forecast 2025-2030 ($ million)
Data Table on Above 300 MW - Market size and forecast 2025-2030 ($ million)
Chart on Above 300 MW - Year-over-year growth 2025-2030 (%)
Data Table on Above 300 MW - Year-over-year growth 2025-2030 (%)

11.4 More than 41-120 MW - Market size and forecast 2025-2030

Chart on More than 41-120 MW - Market size and forecast 2025-2030 ($ million)
Data Table on More than 41-120 MW - Market size and forecast 2025-2030 ($ million)
Chart on More than 41-120 MW - Year-over-year growth 2025-2030 (%)
Data Table on More than 41-120 MW - Year-over-year growth 2025-2030 (%)

11.5 More than 121-300 MW - Market size and forecast 2025-2030

Chart on More than 121-300 MW - Market size and forecast 2025-2030 ($ million)
Data Table on More than 121-300 MW - Market size and forecast 2025-2030 ($ million)
Chart on More than 121-300 MW - Year-over-year growth 2025-2030 (%)
Data Table on More than 121-300 MW - Year-over-year growth 2025-2030 (%)

11.6 Less than 40 MW - Market size and forecast 2025-2030

Chart on Less than 40 MW - Market size and forecast 2025-2030 ($ million)
Data Table on Less than 40 MW - Market size and forecast 2025-2030 ($ million)
Chart on Less than 40 MW - Year-over-year growth 2025-2030 (%)
Data Table on Less than 40 MW - Year-over-year growth 2025-2030 (%)

11.7 Market opportunity by Capacity

Market opportunity by Capacity ($ million)
Data Table on Market opportunity by Capacity ($ million)

12. Customer Landscape

12.1 Customer landscape overview

Analysis of price sensitivity, lifecycle, customer purchase basket, adoption rates, and purchase criteria

13. Geographic Landscape

13.1 Geographic segmentation

Chart on Market share by geography 2025-2030 (%)
Data Table on Market share by geography 2025-2030 (%)

13.2 Geographic comparison

Chart on Geographic comparison
Data Table on Geographic comparison

13.3 APAC - Market size and forecast 2025-2030

Chart on APAC - Market size and forecast 2025-2030 ($ million)
Data Table on APAC - Market size and forecast 2025-2030 ($ million)
Chart on APAC - Year-over-year growth 2025-2030 (%)
Data Table on APAC - Year-over-year growth 2025-2030 (%)
Chart on Regional Comparison - APAC
Data Table on Regional Comparison - APAC

13.3.1 China - Market size and forecast 2025-2030

Chart on China - Market size and forecast 2025-2030 ($ million)
Data Table on China - Market size and forecast 2025-2030 ($ million)
Chart on China - Year-over-year growth 2025-2030 (%)
Data Table on China - Year-over-year growth 2025-2030 (%)

13.3.2 India - Market size and forecast 2025-2030

Chart on India - Market size and forecast 2025-2030 ($ million)
Data Table on India - Market size and forecast 2025-2030 ($ million)
Chart on India - Year-over-year growth 2025-2030 (%)
Data Table on India - Year-over-year growth 2025-2030 (%)

13.3.3 Japan - Market size and forecast 2025-2030

Chart on Japan - Market size and forecast 2025-2030 ($ million)
Data Table on Japan - Market size and forecast 2025-2030 ($ million)
Chart on Japan - Year-over-year growth 2025-2030 (%)
Data Table on Japan - Year-over-year growth 2025-2030 (%)

13.3.4 South Korea - Market size and forecast 2025-2030

Chart on South Korea - Market size and forecast 2025-2030 ($ million)
Data Table on South Korea - Market size and forecast 2025-2030 ($ million)
Chart on South Korea - Year-over-year growth 2025-2030 (%)
Data Table on South Korea - Year-over-year growth 2025-2030 (%)

13.3.5 Australia - Market size and forecast 2025-2030

Chart on Australia - Market size and forecast 2025-2030 ($ million)
Data Table on Australia - Market size and forecast 2025-2030 ($ million)
Chart on Australia - Year-over-year growth 2025-2030 (%)
Data Table on Australia - Year-over-year growth 2025-2030 (%)

13.3.6 Indonesia - Market size and forecast 2025-2030

Chart on Indonesia - Market size and forecast 2025-2030 ($ million)
Data Table on Indonesia - Market size and forecast 2025-2030 ($ million)
Chart on Indonesia - Year-over-year growth 2025-2030 (%)
Data Table on Indonesia - Year-over-year growth 2025-2030 (%)

13.4 North America - Market size and forecast 2025-2030

Chart on North America - Market size and forecast 2025-2030 ($ million)
Data Table on North America - Market size and forecast 2025-2030 ($ million)
Chart on North America - Year-over-year growth 2025-2030 (%)
Data Table on North America - Year-over-year growth 2025-2030 (%)
Chart on Regional Comparison - North America
Data Table on Regional Comparison - North America

13.4.1 US - Market size and forecast 2025-2030

Chart on US - Market size and forecast 2025-2030 ($ million)
Data Table on US - Market size and forecast 2025-2030 ($ million)
Chart on US - Year-over-year growth 2025-2030 (%)
Data Table on US - Year-over-year growth 2025-2030 (%)

13.4.2 Canada - Market size and forecast 2025-2030

Chart on Canada - Market size and forecast 2025-2030 ($ million)
Data Table on Canada - Market size and forecast 2025-2030 ($ million)
Chart on Canada - Year-over-year growth 2025-2030 (%)
Data Table on Canada - Year-over-year growth 2025-2030 (%)

13.4.3 Mexico - Market size and forecast 2025-2030

Chart on Mexico - Market size and forecast 2025-2030 ($ million)
Data Table on Mexico - Market size and forecast 2025-2030 ($ million)
Chart on Mexico - Year-over-year growth 2025-2030 (%)
Data Table on Mexico - Year-over-year growth 2025-2030 (%)

13.5 Europe - Market size and forecast 2025-2030

Chart on Europe - Market size and forecast 2025-2030 ($ million)
Data Table on Europe - Market size and forecast 2025-2030 ($ million)
Chart on Europe - Year-over-year growth 2025-2030 (%)
Data Table on Europe - Year-over-year growth 2025-2030 (%)
Chart on Regional Comparison - Europe
Data Table on Regional Comparison - Europe

13.5.1 Germany - Market size and forecast 2025-2030

Chart on Germany - Market size and forecast 2025-2030 ($ million)
Data Table on Germany - Market size and forecast 2025-2030 ($ million)
Chart on Germany - Year-over-year growth 2025-2030 (%)
Data Table on Germany - Year-over-year growth 2025-2030 (%)

13.5.2 UK - Market size and forecast 2025-2030

Chart on UK - Market size and forecast 2025-2030 ($ million)
Data Table on UK - Market size and forecast 2025-2030 ($ million)
Chart on UK - Year-over-year growth 2025-2030 (%)
Data Table on UK - Year-over-year growth 2025-2030 (%)

13.5.3 France - Market size and forecast 2025-2030

Chart on France - Market size and forecast 2025-2030 ($ million)
Data Table on France - Market size and forecast 2025-2030 ($ million)
Chart on France - Year-over-year growth 2025-2030 (%)
Data Table on France - Year-over-year growth 2025-2030 (%)

13.5.4 Russia - Market size and forecast 2025-2030

Chart on Russia - Market size and forecast 2025-2030 ($ million)
Data Table on Russia - Market size and forecast 2025-2030 ($ million)
Chart on Russia - Year-over-year growth 2025-2030 (%)
Data Table on Russia - Year-over-year growth 2025-2030 (%)

13.5.5 Italy - Market size and forecast 2025-2030

Chart on Italy - Market size and forecast 2025-2030 ($ million)
Data Table on Italy - Market size and forecast 2025-2030 ($ million)
Chart on Italy - Year-over-year growth 2025-2030 (%)
Data Table on Italy - Year-over-year growth 2025-2030 (%)

13.5.6 Spain - Market size and forecast 2025-2030

Chart on Spain - Market size and forecast 2025-2030 ($ million)
Data Table on Spain - Market size and forecast 2025-2030 ($ million)
Chart on Spain - Year-over-year growth 2025-2030 (%)
Data Table on Spain - Year-over-year growth 2025-2030 (%)

13.6 Middle East and Africa - Market size and forecast 2025-2030

Chart on Middle East and Africa - Market size and forecast 2025-2030 ($ million)
Data Table on Middle East and Africa - Market size and forecast 2025-2030 ($ million)
Chart on Middle East and Africa - Year-over-year growth 2025-2030 (%)
Data Table on Middle East and Africa - Year-over-year growth 2025-2030 (%)
Chart on Regional Comparison - Middle East and Africa
Data Table on Regional Comparison - Middle East and Africa

13.6.1 UAE - Market size and forecast 2025-2030

Chart on UAE - Market size and forecast 2025-2030 ($ million)
Data Table on UAE - Market size and forecast 2025-2030 ($ million)
Chart on UAE - Year-over-year growth 2025-2030 (%)
Data Table on UAE - Year-over-year growth 2025-2030 (%)

13.6.2 Saudi Arabia - Market size and forecast 2025-2030

Chart on Saudi Arabia - Market size and forecast 2025-2030 ($ million)
Data Table on Saudi Arabia - Market size and forecast 2025-2030 ($ million)
Chart on Saudi Arabia - Year-over-year growth 2025-2030 (%)
Data Table on Saudi Arabia - Year-over-year growth 2025-2030 (%)

13.6.3 South Africa - Market size and forecast 2025-2030

Chart on South Africa - Market size and forecast 2025-2030 ($ million)
Data Table on South Africa - Market size and forecast 2025-2030 ($ million)
Chart on South Africa - Year-over-year growth 2025-2030 (%)
Data Table on South Africa - Year-over-year growth 2025-2030 (%)

13.6.4 Egypt - Market size and forecast 2025-2030

Chart on Egypt - Market size and forecast 2025-2030 ($ million)
Data Table on Egypt - Market size and forecast 2025-2030 ($ million)
Chart on Egypt - Year-over-year growth 2025-2030 (%)
Data Table on Egypt - Year-over-year growth 2025-2030 (%)

13.6.5 Qatar - Market size and forecast 2025-2030

Chart on Qatar - Market size and forecast 2025-2030 ($ million)
Data Table on Qatar - Market size and forecast 2025-2030 ($ million)
Chart on Qatar - Year-over-year growth 2025-2030 (%)
Data Table on Qatar - Year-over-year growth 2025-2030 (%)

13.7 South America - Market size and forecast 2025-2030

Chart on South America - Market size and forecast 2025-2030 ($ million)
Data Table on South America - Market size and forecast 2025-2030 ($ million)
Chart on South America - Year-over-year growth 2025-2030 (%)
Data Table on South America - Year-over-year growth 2025-2030 (%)
Chart on Regional Comparison - South America
Data Table on Regional Comparison - South America

13.7.1 Brazil - Market size and forecast 2025-2030

Chart on Brazil - Market size and forecast 2025-2030 ($ million)
Data Table on Brazil - Market size and forecast 2025-2030 ($ million)
Chart on Brazil - Year-over-year growth 2025-2030 (%)
Data Table on Brazil - Year-over-year growth 2025-2030 (%)

13.7.2 Argentina - Market size and forecast 2025-2030

Chart on Argentina - Market size and forecast 2025-2030 ($ million)
Data Table on Argentina - Market size and forecast 2025-2030 ($ million)
Chart on Argentina - Year-over-year growth 2025-2030 (%)
Data Table on Argentina - Year-over-year growth 2025-2030 (%)

13.7.3 Chile - Market size and forecast 2025-2030

Chart on Chile - Market size and forecast 2025-2030 ($ million)
Data Table on Chile - Market size and forecast 2025-2030 ($ million)
Chart on Chile - Year-over-year growth 2025-2030 (%)
Data Table on Chile - Year-over-year growth 2025-2030 (%)

13.8 Market opportunity by geography

Market opportunity by geography ($ million)
Data Tables on Market opportunity by geography ($ million)

14. Drivers, Challenges, and Opportunity

14.1 Market drivers

Integration of gas turbines as grid stability solutions for renewable energy
Decarbonization and shift toward hydrogen-ready infrastructure
Rising demand for on-site power in digital infrastructure and data centers

14.2 Market challenges

Severe supply chain bottlenecks and surging procurement costs
Competitive pressure from rapidly expanding renewable energy and storage solutions
Stringent environmental regulations and risk of stranded assets

14.3 Impact of drivers and challenges

Impact of drivers and challenges in 2025 and 2030

14.4 Market opportunities

Acceleration of ammonia and hydrogen co-firing for deep decarbonization
Integration of AI and digital twin technology for fleet optimization
Expansion of distributed and on-site power solutions for high-intensity industrial demand

15. Competitive Landscape

15.1 Overview

15.2

Overview on criticality of inputs and factors of differentiation

15.3 Landscape disruption

Overview on factors of disruption

15.4 Industry risks

Impact of key risks on business

16. Competitive Analysis

16.1 Companies profiled

Companies covered

16.2 Company ranking index

16.3 Market positioning of companies

Matrix on companies position and classification

16.4 Ansaldo Energia S.p.A.

Ansaldo Energia S.p.A. - Overview
Ansaldo Energia S.p.A. - Product / Service
Ansaldo Energia S.p.A. - Key offerings
SWOT

16.5 Baker Hughes Co.

Baker Hughes Co. - Overview
Baker Hughes Co. - Business segments
Baker Hughes Co. - Key offerings
Baker Hughes Co. - Segment focus
SWOT

16.6 Bharat Heavy Electricals Ltd.

Bharat Heavy Electricals Ltd. - Overview
Bharat Heavy Electricals Ltd. - Business segments
Bharat Heavy Electricals Ltd. - Key offerings
Bharat Heavy Electricals Ltd. - Segment focus
SWOT

16.7 Doosan Enerbility Co. Ltd.

Doosan Enerbility Co. Ltd. - Overview
Doosan Enerbility Co. Ltd. - Business segments
Doosan Enerbility Co. Ltd. - Key offerings
Doosan Enerbility Co. Ltd. - Segment focus
SWOT

16.8 GE Vernova Inc.

GE Vernova Inc. - Overview
GE Vernova Inc. - Business segments
GE Vernova Inc. - Key offerings
GE Vernova Inc. - Segment focus
SWOT

16.9 IHI Corp.

IHI Corp. - Overview
IHI Corp. - Business segments
IHI Corp. - Key offerings
IHI Corp. - Segment focus
SWOT

16.10 Kawasaki Heavy Industries Ltd.

Kawasaki Heavy Industries Ltd. - Overview
Kawasaki Heavy Industries Ltd. - Business segments
Kawasaki Heavy Industries Ltd. - Key news
Kawasaki Heavy Industries Ltd. - Key offerings
Kawasaki Heavy Industries Ltd. - Segment focus
SWOT

16.11 MAN Energy Solutions SE

MAN Energy Solutions SE - Overview
MAN Energy Solutions SE - Product / Service
MAN Energy Solutions SE - Key offerings
SWOT

16.12 Mitsubishi Heavy Industries

Mitsubishi Heavy Industries - Overview
Mitsubishi Heavy Industries - Business segments
Mitsubishi Heavy Industries - Key offerings
Mitsubishi Heavy Industries - Segment focus
SWOT

16.13 Motor Sich JSC

Motor Sich JSC - Overview
Motor Sich JSC - Product / Service
Motor Sich JSC - Key offerings
SWOT

16.14 Rolls Royce Holdings Plc

Rolls Royce Holdings Plc - Overview
Rolls Royce Holdings Plc - Business segments
Rolls Royce Holdings Plc - Key offerings
Rolls Royce Holdings Plc - Segment focus
SWOT

16.15 RTX Corp.

RTX Corp. - Overview
RTX Corp. - Business segments
RTX Corp. - Key news
RTX Corp. - Key offerings
RTX Corp. - Segment focus
SWOT

16.16 Shanghai Electric Group Co.

Shanghai Electric Group Co. - Overview
Shanghai Electric Group Co. - Product / Service
Shanghai Electric Group Co. - Key offerings
SWOT

16.17 Siemens Energy AG

Siemens Energy AG - Overview
Siemens Energy AG - Business segments
Siemens Energy AG - Key news
Siemens Energy AG - Key offerings
Siemens Energy AG - Segment focus
SWOT

16.18 Solar Turbines Inc.

Solar Turbines Inc. - Overview
Solar Turbines Inc. - Product / Service
Solar Turbines Inc. - Key offerings
SWOT

17. Appendix

17.1 Scope of the report

Market definition
Objectives
Notes and caveats

17.2 Inclusions and exclusions checklist

Inclusions checklist
Exclusions checklist

17.3 Currency conversion rates for US$

17.4 Research methodology

17.5 Data procurement

Information sources

17.6 Data validation

17.7 Validation techniques employed for market sizing

17.8 Data synthesis

17.9 360 degree market analysis

17.10 List of abbreviations

Research Methodology

Technavio presents a detailed picture of the market by way of study, synthesis, and summation of data from multiple sources. The analysts have presented the various facets of the market with a particular focus on identifying the key industry influencers. The data thus presented is comprehensive, reliable, and the result of extensive research, both primary and secondary.

INFORMATION SOURCES

Primary sources

  • Manufacturers and suppliers
  • Channel partners
  • Industry experts
  • Strategic decision makers

Secondary sources

  • Industry journals and periodicals
  • Government data
  • Financial reports of key industry players
  • Historical data
  • Press releases

DATA ANALYSIS

Data Synthesis

  • Collation of data
  • Estimation of key figures
  • Analysis of derived insights

Data Validation

  • Triangulation with data models
  • Reference against proprietary databases
  • Corroboration with industry experts

REPORT WRITING

Qualitative

  • Market drivers
  • Market challenges
  • Market trends
  • Five forces analysis

Quantitative

  • Market size and forecast
  • Market segmentation
  • Geographical insights
  • Competitive landscape

Interested in this report?

Get your sample now to see our research methodology and insights!

Download Now

Frequently Asked Questions

Gas Turbine market growth will increase by USD 3427.8 million during 2026-2030.

The Gas Turbine market is expected to grow at a CAGR of 2.2% during 2026-2030.

Gas Turbine market is segmented by Product (Heavy-duty gas turbine, Aeroderivative gas turbine) Technology (CCGT, OCGT) End-user (Energy and utilities, Oil and gas, Aerospace and defense, Manufacturing, Marine) Capacity (Above 300 MW, More than 41-120 MW, More than 121-300 MW, Less than 40 MW)

Ansaldo Energia S.p.A., Baker Hughes Co., Bharat Heavy Electricals Ltd., Capstone Green Energy Corp., Doosan Enerbility Co. Ltd., GE Vernova Inc., HTC Corp., IHI Corp., Kawasaki Heavy Industries Ltd., MAN Energy Solutions SE, Mitsubishi Heavy Industries, Motor Sich JSC, Rolls Royce Holdings Plc, RTX Corp., Shanghai Electric Group Co., Siemens Energy AG, Solar Turbines Inc., Vericor Power Systems are a few of the key vendors in the Gas Turbine market.

APAC will register the highest growth rate of 48.5% among the other regions. Therefore, the Gas Turbine market in APAC is expected to garner significant business opportunities for the vendors during the forecast period.

China, India, Japan, South Korea, Australia, Indonesia, US, Canada, Mexico, Germany, UK, France, Russia, Italy, Spain, UAE, Saudi Arabia, South Africa, Egypt, Qatar, Brazil, Argentina, Chile

  • Integration of gas turbines as grid stability solutions for renewable energy is the driving factor this market.

The Gas Turbine market vendors should focus on grabbing business opportunities from the Product segment as it accounted for the largest market share in the base year.
RIA - Research AI Assistant
Ask RIA