Agricultural Grow Bags Market Size 2025-2029
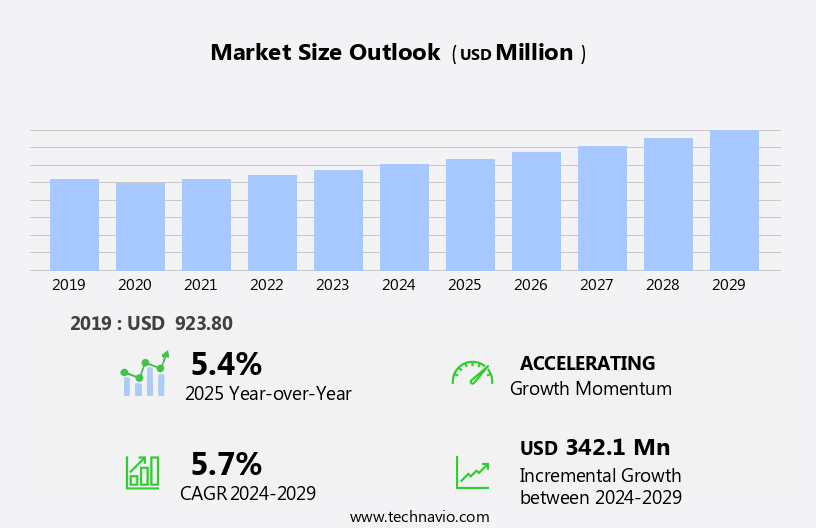
The agricultural grow bags market size is forecast to increase by USD 342.1 million at a CAGR of 5.7% between 2024 and 2029.
- The market is experiencing significant growth, driven by the increasing adoption of fabric grow bags in modern farming practices. This shift is due to the high yield potential of these bags, which enable farmers to produce crops more efficiently in limited spaces and with reduced water usage. Another key trend is the integration of automation in hydroponics technologies, enhancing the productivity and precision of farming operations. However, the market is not without limitations. Challenges such as the high initial investment costs, limited availability of skilled labor, and the need for constant monitoring can hinder market expansion. Another trend is the growing focus on horticulture and specialty seeds, as consumer preferences shift towards healthier and more diverse food options.
- To capitalize on the opportunities presented by this market, companies should focus on developing cost-effective solutions, investing in research and development to improve automation and efficiency, and collaborating with local governments and organizations to address the labor and monitoring challenges. By addressing these challenges and leveraging the benefits of fabric grow bags and automation, companies can effectively navigate the market landscape and drive sustainable growth in the market. dditionally, the smart agriculture industry must adapt to technological advancements, including precision farming and automation, to increase efficiency and productivity.
What will be the Size of the Agricultural Grow Bags Market during the forecast period?
- The market in the United States is experiencing significant growth, driven by the increasing demand for sustainable and efficient farming solutions. This market encompasses a wide range of products, including those infused with plant hormones and growth regulators, designed for use in various farming applications such as rooftop gardening, greenhouse cultivation, and vertical farming. Key growth factors include food security concerns, product innovation, and the adoption of technology in agriculture. Trends in this market include the use of data analytics for optimizing crop yields, fair trade practices, and the circular economy. Urban farming and sustainable packaging are also gaining popularity, as is the integration of automation, sensor technology, and supply chain management to reduce carbon footprint and improve product lifecycle analysis. Increasing government support to boost domestic production and e-commerce is a major driver, which is expected to boost the growth of the market during the forecast period.
How is this Agricultural Grow Bags Industry segmented?
The report provides comprehensive data (region-wise segment analysis), with forecasts and estimates in "USD million" for the period 2025-2029, as well as historical data from 2019-2023 for the following segments.
- Raw Material
- Polythene
- Fabric
- Product
- Vertical grow bags
- Horizontal grow bags
- Application
- Vegetables and fruits
- Commercial crops
- Others
- Geography
- North America
- US
- Canada
- Europe
- France
- Germany
- Italy
- The Netherlands
- UK
- APAC
- China
- India
- Japan
- Middle East and Africa
- South America
- North America
By Raw Material Insights
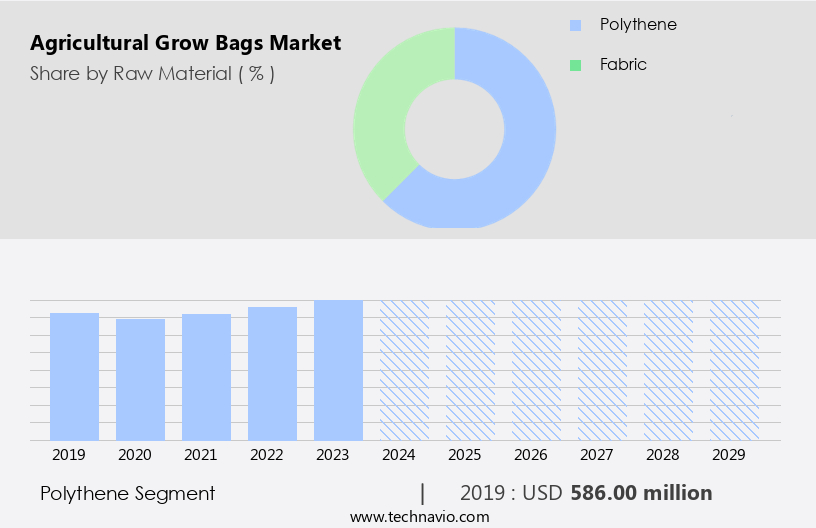
The polythene segment is estimated to witness significant growth during the forecast period. Agricultural grow bags, a key component of smart agriculture, come in various sizes and materials, including polypropylene, non-woven, and geotextile. Polythene, a durable material used in their production, exists in two forms: low-density polyethylene (LDPE) and high-density polyethylene (HDPE). LDPE is commonly used for standard due to its moisture and gas retention properties. In contrast, HDPE, which is stiffer and thicker, is suitable for heavy-duty industrial applications and that require enhanced water retention. Both LDPE and HDPE offer heat-sealing properties, ensuring effective moisture and gas retention. HDPE bags, with their shape retention and puncture resistance, reduce the need for frequent irrigation.
Other benefits of bags include improved root development, soil aeration, nutrient management, and disease control. These bags cater to various applications, such as organic agriculture, commercial agriculture, container gardening, hydroponic cultivation, and urban gardening. Innovations in grow bag materials, such as compostable and biodegradable options, further promote sustainable agriculture.
Get a glance at the market report of share of various segments Request Free Sample
The Polythene segment was valued at USD 586.00 million in 2019 and showed a gradual increase during the forecast period.
Regional Analysis
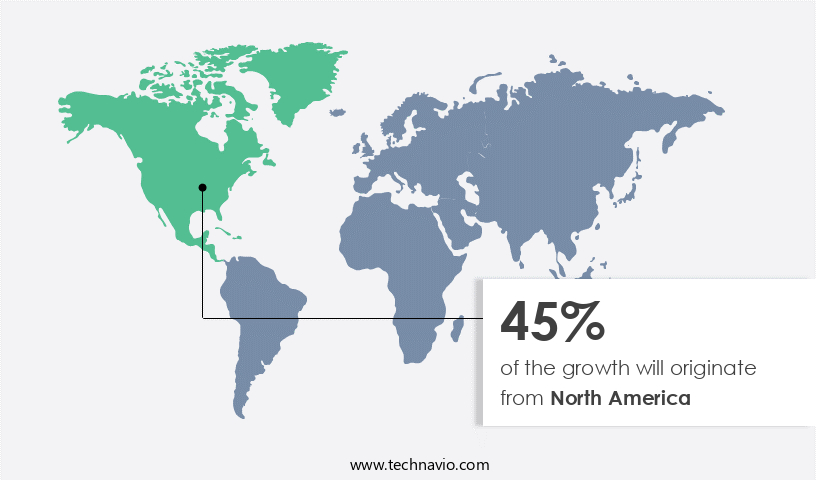
North America is estimated to contribute 45% to the growth of the global market during the forecast period.Technavio's analysts have elaborately explained the regional trends and drivers that shape the market during the forecast period.
For more insights on the market size of various regions, Request Free Sample
They are gaining popularity in North America, particularly in the US and Canada, for horticulture applications. These countries utilize advanced technologies like hydroponics, greenhouses, and drip irrigation systems. In greenhouse cultivation, they offer advantages such as water conservation, root development, and soil aeration. The choice of grow bag materials, including polypropylene and non-woven fabrics, influences moisture retention, pest control, and plant health. They are used in various sizes for seedling growth, indoor and outdoor applications, and for specific crops like fruits and vegetables. Innovations in grow bag production include biodegradable and reusable options, catering to the growing trend of sustainable agriculture. So far, horticulture, supported by advanced fertilizers, has been observed to contribute to the boost of food production in Bahrain, as well as improve its agricultural situation.
Market Dynamics
Our researchers analyzed the data with 2024 as the base year, along with the key drivers, trends, and challenges. A holistic analysis of drivers will help companies refine their marketing strategies to gain a competitive advantage.
What are the key market drivers leading to the rise in the adoption of Agricultural Grow Bags Industry?
- Increased adoption of fabric agricultural for high yield is the key driver of the market. Containers used for growing plants, such as plastic pots, can restrict the natural growth of roots due to their solid walls. This restriction results in the roots growing in a circular pattern, a condition known as girdling. This phenomenon occurs when the roots hit the plastic walls and are unable to grow downwards or laterally, leading to structural damage and stunted growth. The free flow of air and nutrients is also obstructed, affecting the overall health of the plant. Proper root growth is essential for a plant's development, and girdling can significantly impact its ability to thrive. To maintain optimal plant health, it is crucial to provide them with adequate space and the right growing conditions.
- Niche markets, such as regenerative agriculture and companion planting, are also emerging, driven by the need for sustainable farming practices and the reduction of food waste. Ethical sourcing, social responsibility, and environmental impact assessment are also becoming increasingly important considerations for consumers and farmers alike. The market is diverse, with various substrate mixes and irrigation systems catering to different crops and farming methods. Crop diversification and the adoption of eco-friendly materials are also key trends, as is the integration of sustainability reporting and crop rotation practices. Overall, the market is poised for continued growth, driven by the need for sustainable and efficient farming solutions in the face of water scarcity and land degradation.
What are the market trends shaping the Agricultural Grow Bags Industry?
- Increasing use of automation in hydroponics technologies is the upcoming market trend. The market experiences growth due to the integration of automation in hydroponic technologies. Automation enhances efficiency, productivity, and scalability in grow bag cultivation by streamlining nutrient delivery, irrigation, climate control, and monitoring. This reduction in labor costs and human error, coupled with maximized crop yields, leads to improved crop quality and overall profitability for growers. Moreover, automation enables growers to scale their operations, accommodating larger production volumes and meeting the increasing demand for fresh produce. As a result, the adoption of automated hydroponic systems is driving the expansion of the market, offering cost-effective and sustainable solutions for modern farming.
- Organic agriculture also benefits from the use of grow bags, as they provide a controlled environment for maintaining soil quality and nutrient management. Biodegradable and compostable offer additional sustainability, aligning with the growing trend towards eco-friendly farming practices. Urban gardening and container gardening also benefit from grow bags, making them a versatile solution for plant growth. In the context of commercial agriculture, precision agriculture and disease control are key considerations, with geotextile grow bags offering solutions for nutrient management and vertical farming. Overall, grow bags contribute to improved crop yield and plant health, making them an essential tool in modern horticulture.
What challenges does the Agricultural Grow Bags Industry face during its growth?
- Limitations associated with farming is a key challenge affecting the industry growth. The market is driven by the adoption of hydroponics technology, which facilitates efficient plant cultivation without soil, conserves water, maximizes space, and boosts crop yields. This technology is crucial in addressing challenges such as land scarcity and climate change while meeting the rising food demand. However, hydroponics technology's limitations, including high initial setup costs, electricity dependency, precise nutrient management requirements, and susceptibility to system failures, may hinder its widespread adoption, particularly in resource-limited regions. Plants grown in hydroponic farming are vulnerable to power outages, which can impact their growth and yield and potentially dry the crops.
- Despite these challenges, the market is expected to grow due to the numerous benefits of hydroponics technology and the increasing focus on sustainable farming practices. Polypropylene and non-woven materials are common choices due to their durability and moisture retention properties. These materials contribute to water conservation, an essential aspect of sustainable agriculture. Innovations in grow bag technology have led to advancements in soil aeration, moisture retention, and pest control. Smart agriculture integrates these features with precision agriculture techniques, allowing for optimal plant health and increased crop yield.
Exclusive Customer Landscape
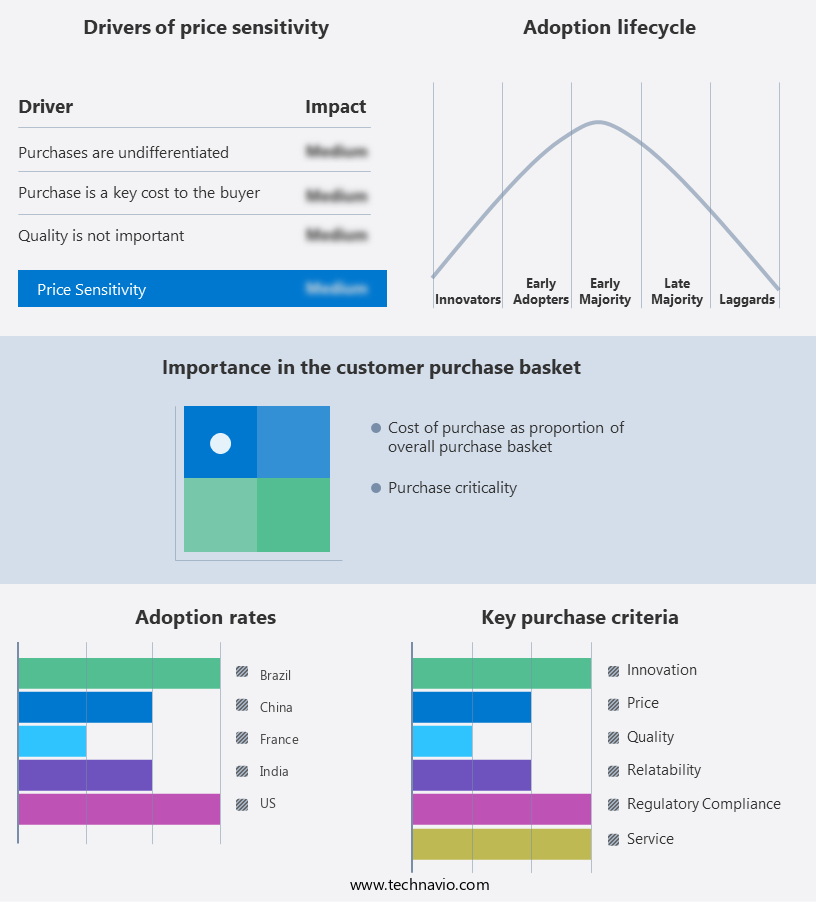
The market forecasting report includes the adoption lifecycle of the market, covering from the innovator's stage to the laggard's stage. It focuses on adoption rates in different regions based on penetration. Furthermore, the agricultural market report also includes key purchase criteria and drivers of price sensitivity to help companies evaluate and develop their market growth analysis strategies.
Customer Landscape
Key Companies & Market Insights
Companies are implementing various strategies, such as strategic alliances, agricultural market forecast, partnerships, mergers and acquisitions, geographical expansion, and product/service launches, to enhance their presence in the industry.
Anandi Enterprises - HDPE grow bags, a durable and UV-stabilized agricultural solution, are widely adopted for growing diverse plant types.
The industry research and growth report includes detailed analyses of the competitive landscape of the market and information about key companies, including:
- Anandi Enterprises
- Anushika Agri Products
- APEX India AGRITECH
- Dolphin Plastics and Packaging
- Dutch Plantin BV
- Escorts Ltd.
- Evergreen Tarpaulin Industries
- FibreDust LLC
- Gale Pacific Ltd.
- Gardzen
- Goyal Agri Products
- Gujarat Raffia Industries
- Jiffy Group
- Rain Science Grow Bags
- Rise Hydroponics
- Shalimar Group
- Van der Knaap Diensten BV
- VIVOSUN
Qualitative and quantitative analysis of companies has been conducted to help clients understand the wider business environment as well as the strengths and weaknesses of key industry players. Data is qualitatively analyzed to categorize companies as pure play, category-focused, industry-focused, and diversified; it is quantitatively analyzed to categorize companies as dominant, leading, strong, tentative, and weak.
Research Analyst Overview
The agricultural grow bag market encompasses a range of products used for cultivating plants in contained environments. These bags offer several advantages over traditional soil-based farming methods, making them increasingly popular among farmers and gardeners alike. Grow bags provide flexibility in terms of size and location, allowing for both indoor and outdoor use. The availability of various sizes caters to different crop requirements, from seedlings in small seedling bags to larger containers for mature plants. The use of grow bags enables farmers to optimize space and resources, making them an attractive option for commercial agriculture and urban gardening. The materials used in the production of grow bags have evolved to meet the demands of modern agriculture. Water constraints, Agritourism related activities, and agricultural land degradation are significant challenges.
Geotextile grow bags are another type of grow bag that has gained popularity due to their ability to improve soil structure and water retention. These bags are particularly useful in areas with poor soil quality or high water demand, such as fruit grow bags in arid regions. Foreign investments, subsidies, grocery market, and advanced technologies are essential to addressing these challenges. Container gardening and hydroponic systems utilize grow bags for soil-less cultivation, providing a controlled environment for plant growth. Vertical grow bags are an innovative solution for space-constrained urban environments, allowing for efficient use of vertical space. The market for grow bags continues to expand as farmers and gardeners seek more efficient and sustainable methods for crop production. The versatility of these containers, coupled with ongoing innovations, ensures their relevance in various agricultural applications.
|
Market Scope |
|
|
Report Coverage |
Details |
|
Page number |
210 |
|
Base year |
2024 |
|
Historic period |
2019-2023 |
|
Forecast period |
2025-2029 |
|
Growth momentum & CAGR |
Accelerate at a CAGR of 5.7% |
|
Market growth 2025-2029 |
USD 342.1 million |
|
Market structure |
Fragmented |
|
YoY growth 2024-2025(%) |
5.4 |
|
Key countries |
US, Canada, China, UK, Germany, Japan, India, France, Italy, and The Netherlands |
|
Competitive landscape |
Leading Companies, Market Positioning of Companies, Competitive Strategies, and Industry Risks |
What are the Key Data Covered in this Agricultural Grow Bags Market Research and Growth Report?
- CAGR of the Agricultural Grow Bags industry during the forecast period
- Detailed information on factors that will drive the growth and forecasting between 2025 and 2029
- Precise estimation of the size of the market and its contribution of the industry in focus to the parent market
- Accurate predictions about upcoming growth and trends and changes in consumer behaviour
- Growth of the market across North America, Europe, APAC, Middle East and Africa, and South America
- Thorough analysis of the market's competitive landscape and detailed information about companies
- Comprehensive analysis of factors that will challenge the agricultural grow bags market growth of industry companies
We can help! Our analysts can customize this agricultural grow bags market research report to meet your requirements.
 RIA -
RIA - 
