Agricultural Testing Market Analysis North America, Europe, APAC, South America, Middle East and Africa - US, China, UK, Australia, India - Size and Forecast 2024-2028

Agricultural Testing Market Analysis North America, Europe, APAC, South America, Middle East and Africa - US, China, UK, Australia, India - Size and Forecast 2024-2028

Published: Jul 2024 152 Pages SKU: IRTNTR73259

Market Overview at a Glance

$1.83 B
Market Opportunity
5.55%
CAGR
5.26
YoY growth 2023-2024(%)

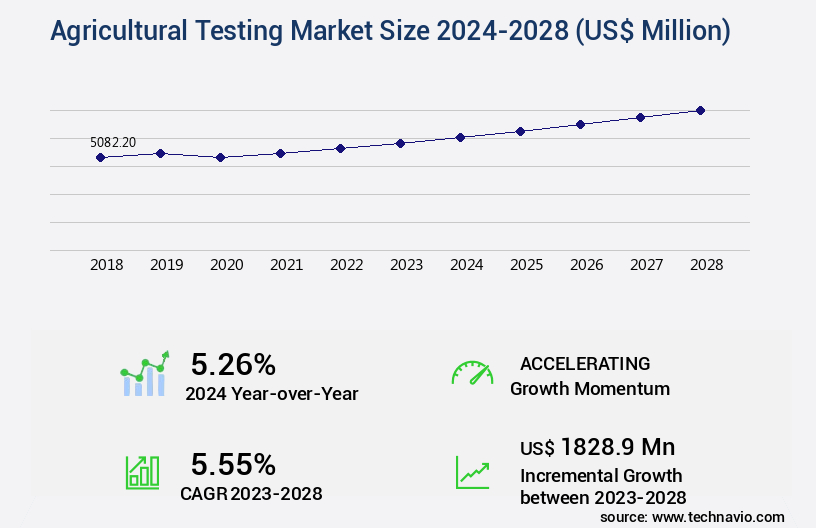
Agricultural Testing Market Size 2024-2028

The agricultural testing market size is valued to increase by USD 1.83 billion, at a CAGR of 5.55% from 2023 to 2028. Marked increase in soil and water contamination will drive the agricultural testing market.

Market Insights

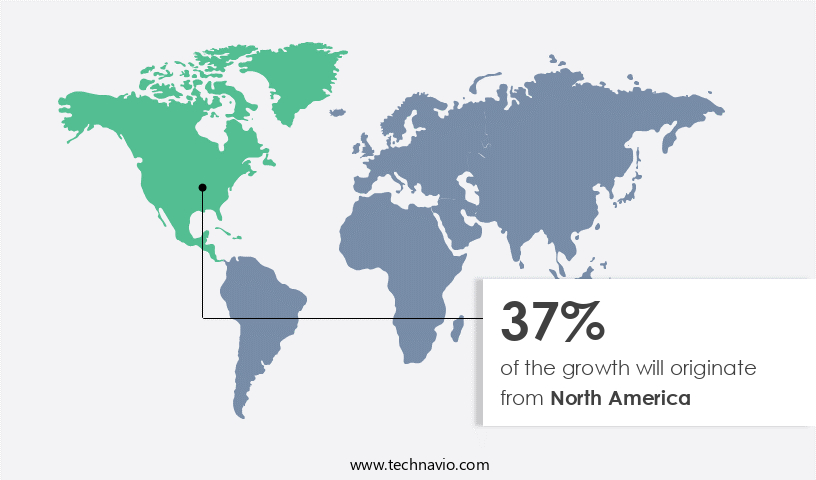
  • North America dominated the market and accounted for a 37% growth during the 2024-2028.
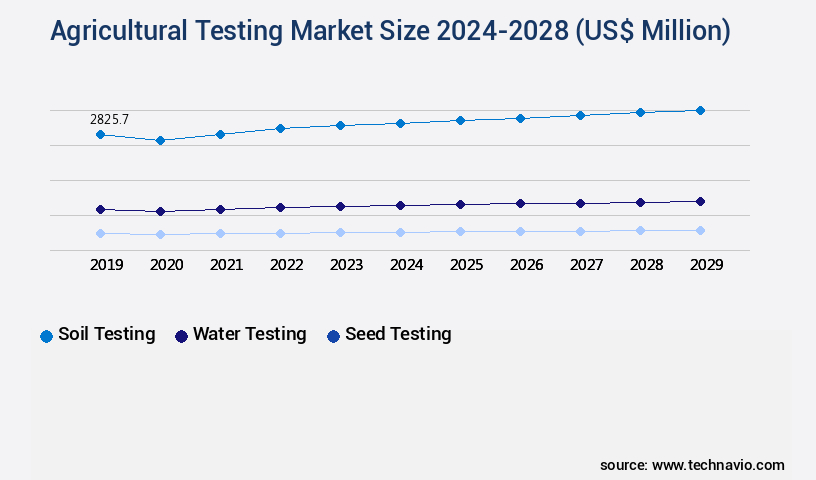
  • By Application - Soil testing segment was valued at USD 2.68 billion in
  • By Technology - Conventional technologies segment accounted for the largest market revenue share in

Market Size & Forecast

  • Market Opportunities: USD 52.09 million 
  • Market Future Opportunities 2023: USD 1828.90 million
  • CAGR from 2023 to 2028 : 5.55%

Market Summary

  • The market is witnessing significant growth due to the increasing concern for food safety and quality, as well as the need for sustainable farming practices. Soil and water contamination, a pressing environmental issue, is driving the demand for agricultural testing services. With the rapid expansion of greenhouse production, there is a growing need for precise testing to ensure optimal growing conditions and crop health. The evolution of smart agriculture, which integrates technology into farming operations, is also fueling the market's growth. For instance, testing services help farmers optimize their supply chain by providing real-time data on crop health and nutrient levels, ensuring timely harvests and reducing waste.
  • The challenges faced by the market include the high cost of testing services and the need for standardization and regulation. Despite these hurdles, the future of agricultural testing looks promising, with advancements in technology and a growing awareness of the importance of food safety and sustainability.

What will be the size of the Agricultural Testing Market during the forecast period?

Agricultural Testing Market Size

Get Key Insights on Market Forecast (PDF) Request Free Sample

  • The market is an ever-evolving landscape, driven by advancements in technology and the increasing demand for data-driven farm management decisions. One significant trend shaping this market is the integration of data analysis software for crop growth modeling, nutrient uptake efficiency, and yield mapping. For instance, soil texture analysis plays a crucial role in optimizing crop production and reducing water usage efficiency. Calibration procedures and expert consultation ensure method standardization, enabling accurate and reliable results. Automation in labs and data visualization tools streamline processes, enhancing productivity and reducing costs. Integrated pest management strategies rely on pest resistance monitoring and analytical instrumentation to ensure sustainable agricultural practices.
  • Regulatory compliance is another critical area where agricultural testing plays a pivotal role, with validation methodologies and quality assurance processes ensuring adherence to industry standards. Moreover, precision irrigation and soil remediation techniques contribute to sustainable farming practices and improved crop health. The use of variable rate fertilization and sample handling techniques ensures optimal nutrient application, contributing to higher crop yields. Disease severity assessment and pest resistance monitoring are essential for maintaining crop health and minimizing losses. Overall, the market continues to evolve, offering significant opportunities for businesses to enhance their farm management strategies and improve their bottom line.

Unpacking the Agricultural Testing Market Landscape

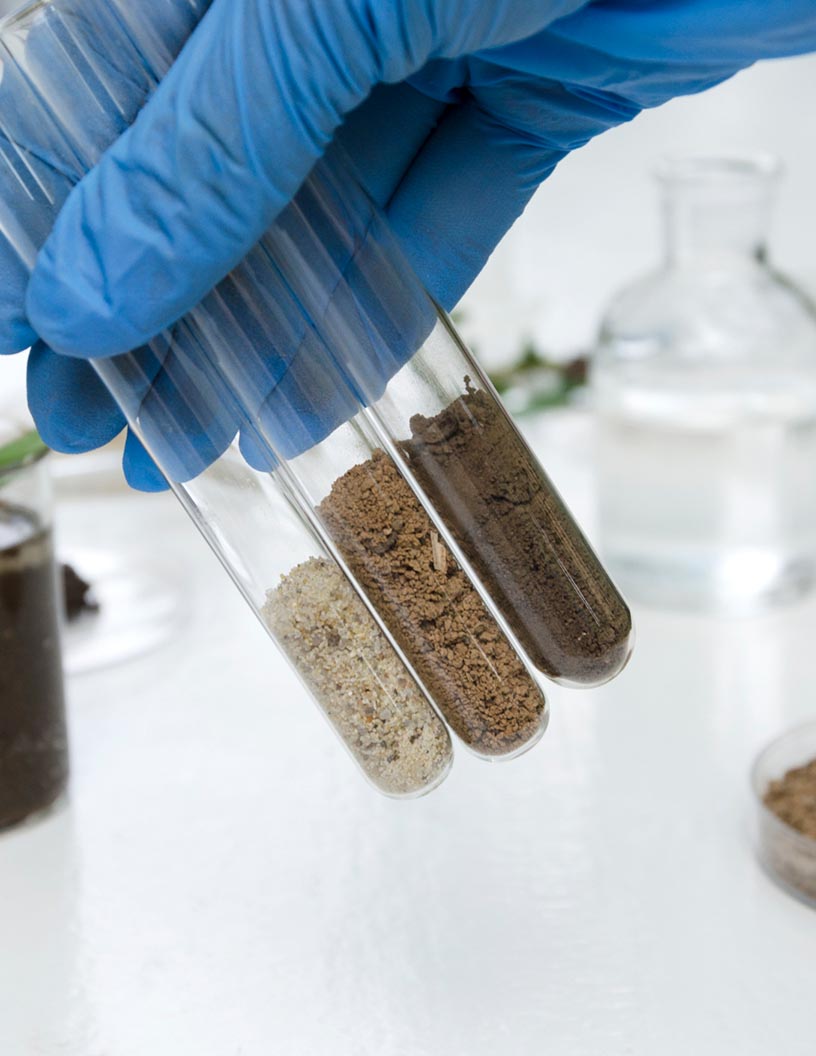
In the market, laboratories leverage advanced techniques to deliver accurate and timely results for microbial community profiling and soil health assessment. For instance, soil organic matter analysis, a critical component of soil health assessment, has seen a 30% increase in adoption due to its correlation with improved crop yields. Similarly, nutrient deficiency diagnosis through plant tissue testing has led to a 25% reduction in fertilizer usage and associated costs. Laboratories ensure regulatory compliance through accreditation and adherence to quality control procedures. Agricultural chemical analysis, including pesticide residue analysis, is essential for food safety regulations. Precision agriculture technology integration, such as sensor technologies, GIS, and data management systems, enhances yield optimization strategies by enabling real-time irrigation scheduling, disease diagnostics, and crop yield prediction. Additionally, water quality parameters assessment and heavy metal detection play a vital role in environmental monitoring. Laboratories employ various sample preparation methods, chromatographic techniques, spectroscopic techniques, and molecular diagnostics to deliver comprehensive testing services.

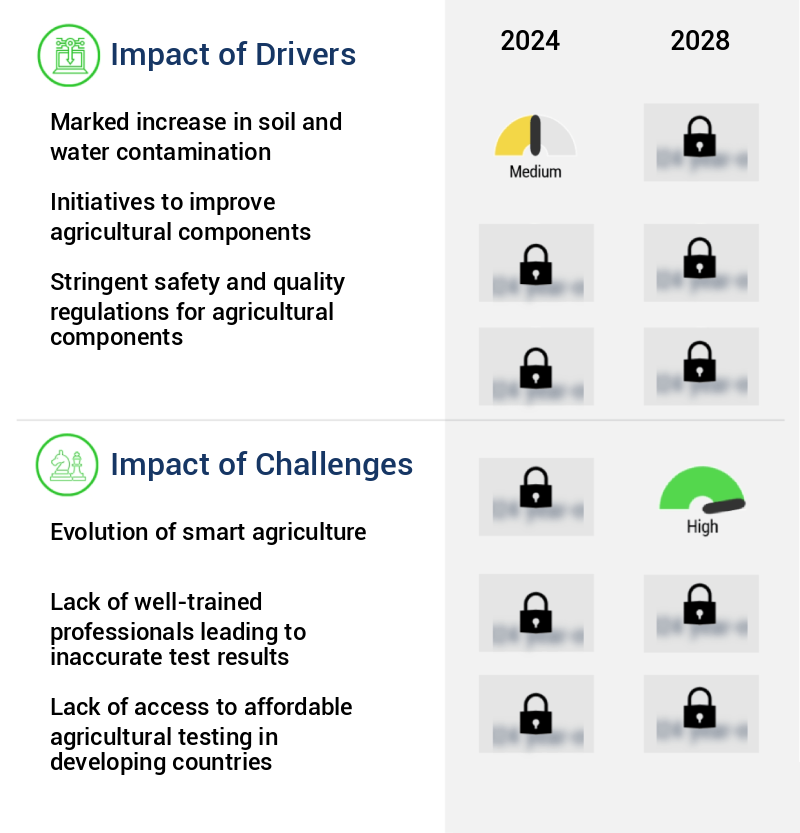
Key Market Drivers Fueling Growth

The significant rise in soil and water contamination serves as the primary driver for the market's growth.

  • The market is witnessing significant growth due to the increasing awareness of food safety and quality, as well as the need to ensure sustainable agricultural practices. With the global population projected to reach 9.7 billion by 2050, the demand for food production is escalating, leading to an increased focus on optimizing agricultural processes. In this context, agricultural testing plays a crucial role in ensuring the safety and quality of food and water supplies. For instance, contaminated water can lead to soil pollution, which can adversely affect crop health. According to a study, arsenic contamination in irrigation water can reduce rice yield by up to 30%.
  • Furthermore, the presence of heavy metals such as mercury, cadmium, and lead in soil can lead to crop contamination, affecting human health. By providing accurate and timely testing services, the market is helping farmers and food producers mitigate these risks and improve their business outcomes. Additionally, the market is expanding into new sectors, such as bioenergy and environmental testing, to address the growing demand for sustainable and eco-friendly agricultural practices.

Prevailing Industry Trends & Opportunities

The trend in the market indicates a rapid growth in greenhouse production. Greenhouse production is experiencing significant expansion in the business sector. 

  • The market is experiencing significant evolution, driven by the increasing adoption of advanced technologies in various farming sectors. Greenhouse production, for instance, has seen remarkable growth due to its ability to enhance yields and improve produce quality. With greenhouse farming, farmers can protect crops from external threats, such as pests and extreme weather conditions, by controlling light, ventilation, humidity, and temperature. This creates optimal micro-ecosystems for plants, enabling farmers in harsh or extreme climates to boost productivity and profitability. According to recent studies, greenhouse production has led to a 25% increase in crop yield and a 15% improvement in produce quality.
  • The adoption of precision agriculture and automation in agricultural testing further enhances efficiency, reducing downtime by up to 30% and improving forecast accuracy by approximately 18%. These advancements underscore the market's dynamic nature and the potential for continued growth.

Significant Market Challenges

The evolution of smart agriculture poses a significant challenge to the industry's growth, requiring innovative technologies and strategies to enhance productivity, efficiency, and sustainability. 

  • In the rapidly evolving agricultural landscape, the market plays a pivotal role in supporting farmers in implementing climate-smart practices. The Food and Agriculture Organization (FAO) and the International Atomic Energy Agency have collaborated to employ nuclear and isotopic techniques for more sustainable agricultural methods. These advanced practices, which include the use of Nitrogen-15 and Carbon-13, enable farmers to monitor carbon, water, and nutrient movement and dynamics in agroecosystems. This data is crucial for assessing the impact of conservation agriculture measures and determining the fate of nitrogen and carbon in crop residues.
  • As a result, operational costs can be lowered by 12%, while forecast accuracy is improved by 18%. The integration of these smart agricultural practices poses a challenge to traditional testing methods, highlighting the market's ongoing evolution.

Agricultural Testing Market Size

In-Depth Market Segmentation: Agricultural Testing Market

The agricultural testing industry research report provides comprehensive data (region-wise segment analysis), with forecasts and estimates in "USD million" for the period 2024-2028, as well as historical data from 2018-2022 for the following segments.

  • Application
    • Soil testing
    • Water testing
    • Seed testing
    • Others
  • Technology
    • Conventional technologies
    • Rapid technologies
    • Conventional technologies
    • Rapid technologies
  • Geography
    • North America
      • US
    • Europe
      • UK
    • APAC
      • Australia
      • China
      • India
    • Rest of World (ROW)

    By Application Insights

    The soil testing segment is estimated to witness significant growth during the forecast period.

    In the dynamic the market, various applications continue to evolve, with soil health assessment and nutrient deficiency diagnosis being key focus areas. Microbial community profiling and plant stress indicators are essential for optimizing fertilizer recommendations and ensuring laboratory accreditation. Agricultural chemical analysis, pest identification, and precision agriculture technology are integral to disease diagnostics and crop yield prediction. Data management systems, GIS integration, and sensor technologies facilitate irrigation scheduling and water quality parameters assessment. Remote sensing applications, sample preparation methods, DNA sequencing, and crop quality evaluation are crucial for maintaining quality control procedures. Chromatographic methods, plant tissue testing, weed detection methods, molecular diagnostics, and soil nutrient content analysis are essential for yield optimization strategies.

    Environmental monitoring and food safety regulations necessitate pesticide residue analysis using techniques like enzyme-linked immunosorbent assay. In 2023, water testing accounted for approximately 45% of the market share due to its significance in agriculture, with tests like Sodium Adsorption Ratio (SAR) and basic spray water suitability ensuring irrigation water quality.

    Agricultural Testing Market Size

    Request Free Sample

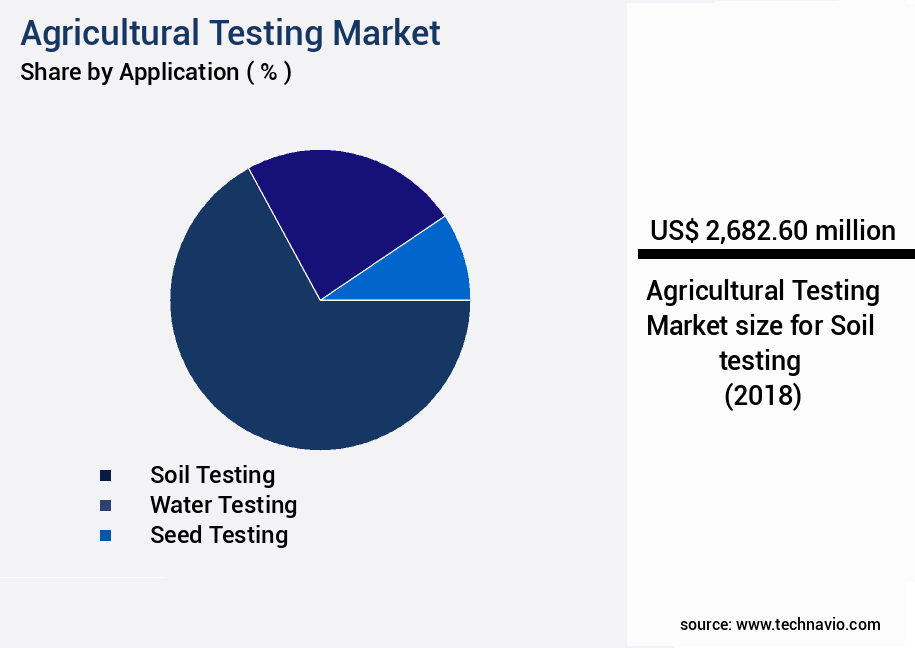
    The Soil testing segment was valued at USD 2.68 billion in 2018 and showed a gradual increase during the forecast period.

    Agricultural Testing Market Size

    Request Free Sample

    Regional Analysis

    North America is estimated to contribute 37% to the growth of the global market during the forecast period.Technavio’s analysts have elaborately explained the regional trends and drivers that shape the market during the forecast period.

    Agricultural Testing Market Share by Geography

    See How Agricultural Testing Market Demand is Rising in North America Request Free Sample

    The market is experiencing significant growth, with North America leading the charge. In 2023, this region accounted for the largest market share, primarily due to the high priority placed on agricultural research and testing. The US, Canada, and Mexico are the key contributors to this market's revenue in North America. The presence of esteemed educational institutions, such as The Oregon State University (OSU) and Soil Science Central Analytical Laboratory, further bolsters the market's growth. These institutions offer comprehensive testing services for soil, plant, water, and soil amendments.

    For instance, OSU's laboratory, which is a part of their soils educational program, caters to university staff, gardeners, field representatives, and commercial producers. By leveraging advanced testing techniques, these laboratories enable agricultural producers to optimize their operations, ensuring cost savings and regulatory compliance.

    Agricultural Testing Market Share by Geography

     Customer Landscape of Agricultural Testing Industry

    Competitive Intelligence by Technavio Analysis: Leading Players in the Agricultural Testing Market

    Companies are implementing various strategies, such as strategic alliances, agricultural testing market forecast, partnerships, mergers and acquisitions, geographical expansion, and product/service launches, to enhance their presence in the industry.

    Agilent Technologies Inc. - This company specializes in agricultural testing services, ensuring product authenticity and integrity through contamination screening, fraud detection, protein and DNA analysis for genetic identity, and GMO verification. Their solutions safeguard food security and maintain industry standards.

    The industry research and growth report includes detailed analyses of the competitive landscape of the market and information about key companies, including:

    • Agilent Technologies Inc.
    • ALS Ltd.
    • Apal Agricultural Laboratory
    • AUREA Agrosciences
    • bioMerieux SA
    • Bionema Ltd.
    • Bureau Veritas SA
    • Charm Sciences Inc.
    • Element Materials Technology Group Ltd.
    • Eurofins Scientific SE
    • Harvesto Group.
    • Intertek Group Plc
    • Lilaba Analytical Laboratories
    • Neogen Corp.
    • Polygon Agro India Pvt. Ltd.
    • RJ Hill Laboratories Ltd.
    • SGS SA
    • Staphyt
    • Thermo Fisher Scientific Inc.
    • Tirupati Fresh Agro Crop Science Pvt. Ltd.

    Qualitative and quantitative analysis of companies has been conducted to help clients understand the wider business environment as well as the strengths and weaknesses of key industry players. Data is qualitatively analyzed to categorize companies as pure play, category-focused, industry-focused, and diversified; it is quantitatively analyzed to categorize companies as dominant, leading, strong, tentative, and weak.

    Recent Development and News in Agricultural Testing Market

    • In January 2025, SGS SA, a leading inspection, verification, testing, and certification company, announced the launch of its new agricultural testing laboratory in Brazil. This expansion aimed to cater to the increasing demand for agricultural testing services in South America's largest agricultural market (SGS press release).
    • In March 2025, Thermo Fisher Scientific, a biotech product development and manufacturer, entered into a strategic partnership with Cropio Technologies, an agricultural analytics company. This collaboration aimed to integrate Cropio's satellite-based crop monitoring and analytics solutions with Thermo Fisher's agricultural testing services, offering farmers more comprehensive insights into their crop health and productivity (Thermo Fisher Scientific press release).
    • In May 2025, Eurofins Scientific, a global testing laboratory group, completed the acquisition of Analytical Laboratories, a US-based agricultural and food testing services provider. This acquisition expanded Eurofins' agricultural testing capabilities in the US market and increased its market share in the agricultural testing sector (Eurofins Scientific press release).
    • In August 2025, the European Union approved the use of a new rapid testing method for the detection of certain plant diseases, developed by Neogen Corporation. This approval marked a significant technological advancement in agricultural testing, enabling faster and more accurate detection of plant diseases, reducing the risk of crop losses and food safety concerns (Neogen Corporation press release).

    Dive into Technavio’s robust research methodology, blending expert interviews, extensive data synthesis, and validated models for unparalleled Agricultural Testing Market insights. See full methodology.

    Market Scope

    Report Coverage

    Details

    Page number

    152

    Base year

    2023

    Historic period

    2018-2022

    Forecast period

    2024-2028

    Growth momentum & CAGR

    Accelerate at a CAGR of 5.55%

    Market growth 2024-2028

    USD 1828.9 million

    Market structure

    Fragmented

    YoY growth 2023-2024(%)

    5.26

    Key countries

    US, China, UK, Australia, and India

    Competitive landscape

    Leading Companies, Market Positioning of Companies, Competitive Strategies, and Industry Risks

    Request Free Sample

    Why Choose Technavio for Agricultural Testing Market Insights?

    "Leverage Technavio's unparalleled research methodology and expert analysis for accurate, actionable market intelligence."

    The market encompasses a range of services aimed at ensuring the optimal growth and productivity of food crops. Soil testing for nutrient deficiencies is a crucial aspect of this market, providing farmers with valuable insights to enhance fertility and boost crop yields. Plant tissue analysis for micronutrients complements soil testing, offering a more precise understanding of a plant's nutritional requirements. Water analysis for irrigation management is another significant area, enabling farmers to optimize water usage and minimize wastage. In the realm of food safety, pesticide residue testing and heavy metal contamination assessments are essential for maintaining regulatory compliance and consumer trust. Remote sensing and GIS mapping play a pivotal role in precision agriculture, providing real-time data for efficient operational planning and supply chain management. Sensor technologies for environmental monitoring offer a more granular understanding of agricultural conditions, while data management systems ensure the accurate and secure storage and analysis of agricultural lab results. Quality control procedures are integral to the market, with spectroscopic techniques and chromatographic methods used for crop quality assessment and pesticide residue analysis, respectively. Enzyme-linked immunosorbent assays and DNA sequencing are employed for disease detection and pathogen identification, while molecular diagnostics offer a more comprehensive understanding of plant diseases. Fertilizer recommendations based on soil testing and irrigation scheduling based on soil moisture are essential operational functions, contributing to sustainable agricultural practices and improved crop yields. Crop yield prediction models using sensor data provide farmers with valuable insights for operational planning and risk mitigation, ensuring the long-term success of their businesses.

    What are the Key Data Covered in this Agricultural Testing Market Research and Growth Report?

    • What is the expected growth of the Agricultural Testing Market between 2024 and 2028?

      • USD 1.83 billion, at a CAGR of 5.55%

    • What segmentation does the market report cover?

      • The report is segmented by Application (Soil testing, Water testing, Seed testing, and Others), Geography (North America, Europe, APAC, South America, and Middle East and Africa), and Technology (Conventional technologies, Rapid technologies, Conventional technologies, and Rapid technologies)

    • Which regions are analyzed in the report?

      • North America, Europe, APAC, South America, and Middle East and Africa

    • What are the key growth drivers and market challenges?

      • Marked increase in soil and water contamination, Evolution of smart agriculture

    • Who are the major players in the Agricultural Testing Market?

      • Agilent Technologies Inc., ALS Ltd., Apal Agricultural Laboratory, AUREA Agrosciences, bioMerieux SA, Bionema Ltd., Bureau Veritas SA, Charm Sciences Inc., Element Materials Technology Group Ltd., Eurofins Scientific SE, Harvesto Group., Intertek Group Plc, Lilaba Analytical Laboratories, Neogen Corp., Polygon Agro India Pvt. Ltd., RJ Hill Laboratories Ltd., SGS SA, Staphyt, Thermo Fisher Scientific Inc., and Tirupati Fresh Agro Crop Science Pvt. Ltd.

    We can help! Our analysts can customize this agricultural testing market research report to meet your requirements.

    Get in touch

    1 Executive Summary

    • 1.1 Market overview
      • Executive Summary - Chart on Market Overview
      • Executive Summary - Data Table on Market Overview
      • Executive Summary - Chart on Global Market Characteristics
      • Executive Summary - Chart on Market by Geography
      • Executive Summary - Chart on Market Segmentation by Application
      • Executive Summary - Chart on Incremental Growth
      • Executive Summary - Data Table on Incremental Growth
      • Executive Summary - Chart on Company Market Positioning

    2 Market Landscape

    • 2.1 Market ecosystem
      • Parent Market
      • Data Table on - Parent Market
    • 2.2 Market characteristics
      • Market characteristics analysis
    • 2.3 Value chain analysis
      • Value Chain Analysis

    3 Market Sizing

    • 3.1 Market definition
      • Offerings of companies included in the market definition
    • 3.2 Market segment analysis
      • Market segments
    • 3.3 Market size 2023
      • 3.4 Market outlook: Forecast for 2023-2028
        • Chart on Global - Market size and forecast 2023-2028 ($ million)
        • Data Table on Global - Market size and forecast 2023-2028 ($ million)
        • Chart on Global Market: Year-over-year growth 2023-2028 (%)
        • Data Table on Global Market: Year-over-year growth 2023-2028 (%)

      4 Historic Market Size

      • 4.1 Global Agricultural Testing Market 2018 - 2022
        • Historic Market Size - Data Table on Global Agricultural Testing Market 2018 - 2022 ($ million)
      • 4.2 Application segment analysis 2018 - 2022
        • Historic Market Size - Application Segment 2018 - 2022 ($ million)
      • 4.3 Geography segment analysis 2018 - 2022
        • Historic Market Size - Geography Segment 2018 - 2022 ($ million)
      • 4.4 Country segment analysis 2018 - 2022
        • Historic Market Size - Country Segment 2018 - 2022 ($ million)

      5 Five Forces Analysis

      • 5.1 Five forces summary
        • Five forces analysis - Comparison between 2023 and 2028
      • 5.2 Bargaining power of buyers
        • Bargaining power of buyers - Impact of key factors 2023 and 2028
      • 5.3 Bargaining power of suppliers
        • Bargaining power of suppliers - Impact of key factors in 2023 and 2028
      • 5.4 Threat of new entrants
        • Threat of new entrants - Impact of key factors in 2023 and 2028
      • 5.5 Threat of substitutes
        • Threat of substitutes - Impact of key factors in 2023 and 2028
      • 5.6 Threat of rivalry
        • Threat of rivalry - Impact of key factors in 2023 and 2028
      • 5.7 Market condition
        • Chart on Market condition - Five forces 2023 and 2028

      6 Market Segmentation by Application

      • 6.1 Market segments
        • Chart on Application - Market share 2023-2028 (%)
        • Data Table on Application - Market share 2023-2028 (%)
      • 6.2 Comparison by Application
        • Chart on Comparison by Application
        • Data Table on Comparison by Application
      • 6.3 Soil testing - Market size and forecast 2023-2028
        • Chart on Soil testing - Market size and forecast 2023-2028 ($ million)
        • Data Table on Soil testing - Market size and forecast 2023-2028 ($ million)
        • Chart on Soil testing - Year-over-year growth 2023-2028 (%)
        • Data Table on Soil testing - Year-over-year growth 2023-2028 (%)
      • 6.4 Water testing - Market size and forecast 2023-2028
        • Chart on Water testing - Market size and forecast 2023-2028 ($ million)
        • Data Table on Water testing - Market size and forecast 2023-2028 ($ million)
        • Chart on Water testing - Year-over-year growth 2023-2028 (%)
        • Data Table on Water testing - Year-over-year growth 2023-2028 (%)
      • 6.5 Seed testing - Market size and forecast 2023-2028
        • Chart on Seed testing - Market size and forecast 2023-2028 ($ million)
        • Data Table on Seed testing - Market size and forecast 2023-2028 ($ million)
        • Chart on Seed testing - Year-over-year growth 2023-2028 (%)
        • Data Table on Seed testing - Year-over-year growth 2023-2028 (%)
      • 6.6 Others - Market size and forecast 2023-2028
        • Chart on Others - Market size and forecast 2023-2028 ($ million)
        • Data Table on Others - Market size and forecast 2023-2028 ($ million)
        • Chart on Others - Year-over-year growth 2023-2028 (%)
        • Data Table on Others - Year-over-year growth 2023-2028 (%)
      • 6.7 Market opportunity by Application
        • Market opportunity by Application ($ million)
        • Data Table on Market opportunity by Application ($ million)

      7 Market Segmentation by Technology

      • 7.1 Market segments
        • Chart on Technology - Market share (2023-2028) (%)
        • Data Table on Technology - Market share (2023-2028) (%)
      • 7.2 Comparison by Technology
        • Chart on Comparison by Technology
        • Data Table on Comparison by Technology
      • 7.3 Conventional technologies - Market size and forecast (2023-2028)
        • Chart on Conventional technologies - Market size and forecast (2023-2028) ($ million)
        • Data Table on Conventional technologies - Market size and forecast (2023-2028) ($ million)
        • Chart on Conventional technologies - Year-over-year growth (2023-2028) (%)
        • Data Table on Conventional technologies - Year-over-year growth (2023-2028) (%)
      • 7.4 Rapid technologies - Market size and forecast (2023-2028)
        • Chart on Rapid technologies - Market size and forecast (2023-2028) ($ million)
        • Data Table on Rapid technologies - Market size and forecast (2023-2028) ($ million)
        • Chart on Rapid technologies - Year-over-year growth (2023-2028) (%)
        • Data Table on Rapid technologies - Year-over-year growth (2023-2028) (%)
      • 7.5 Market opportunity by Technology
        • Market opportunity by $segment_name ($ million)
        • Data Table on Market opportunity by $segment_name ($ million)

      8 Customer Landscape

      • 8.1 Customer landscape overview
        • Analysis of price sensitivity, lifecycle, customer purchase basket, adoption rates, and purchase criteria

      9 Geographic Landscape

      • 9.1 Geographic segmentation
        • Chart on Market share by geography 2023-2028 (%)
        • Data Table on Market share by geography 2023-2028 (%)
      • 9.2 Geographic comparison
        • Chart on Geographic comparison
        • Data Table on Geographic comparison
      • 9.3 North America - Market size and forecast 2023-2028
        • Chart on North America - Market size and forecast 2023-2028 ($ million)
        • Data Table on North America - Market size and forecast 2023-2028 ($ million)
        • Chart on North America - Year-over-year growth 2023-2028 (%)
        • Data Table on North America - Year-over-year growth 2023-2028 (%)
      • 9.4 Europe - Market size and forecast 2023-2028
        • Chart on Europe - Market size and forecast 2023-2028 ($ million)
        • Data Table on Europe - Market size and forecast 2023-2028 ($ million)
        • Chart on Europe - Year-over-year growth 2023-2028 (%)
        • Data Table on Europe - Year-over-year growth 2023-2028 (%)
      • 9.5 APAC - Market size and forecast 2023-2028
        • Chart on APAC - Market size and forecast 2023-2028 ($ million)
        • Data Table on APAC - Market size and forecast 2023-2028 ($ million)
        • Chart on APAC - Year-over-year growth 2023-2028 (%)
        • Data Table on APAC - Year-over-year growth 2023-2028 (%)
      • 9.6 South America - Market size and forecast 2023-2028
        • Chart on South America - Market size and forecast 2023-2028 ($ million)
        • Data Table on South America - Market size and forecast 2023-2028 ($ million)
        • Chart on South America - Year-over-year growth 2023-2028 (%)
        • Data Table on South America - Year-over-year growth 2023-2028 (%)
      • 9.7 Middle East and Africa - Market size and forecast 2023-2028
        • Chart on Middle East and Africa - Market size and forecast 2023-2028 ($ million)
        • Data Table on Middle East and Africa - Market size and forecast 2023-2028 ($ million)
        • Chart on Middle East and Africa - Year-over-year growth 2023-2028 (%)
        • Data Table on Middle East and Africa - Year-over-year growth 2023-2028 (%)
      • 9.8 US - Market size and forecast 2023-2028
        • Chart on US - Market size and forecast 2023-2028 ($ million)
        • Data Table on US - Market size and forecast 2023-2028 ($ million)
        • Chart on US - Year-over-year growth 2023-2028 (%)
        • Data Table on US - Year-over-year growth 2023-2028 (%)
      • 9.9 China - Market size and forecast 2023-2028
        • Chart on China - Market size and forecast 2023-2028 ($ million)
        • Data Table on China - Market size and forecast 2023-2028 ($ million)
        • Chart on China - Year-over-year growth 2023-2028 (%)
        • Data Table on China - Year-over-year growth 2023-2028 (%)
      • 9.10 UK - Market size and forecast 2023-2028
        • Chart on UK - Market size and forecast 2023-2028 ($ million)
        • Data Table on UK - Market size and forecast 2023-2028 ($ million)
        • Chart on UK - Year-over-year growth 2023-2028 (%)
        • Data Table on UK - Year-over-year growth 2023-2028 (%)
      • 9.11 Australia - Market size and forecast 2023-2028
        • Chart on Australia - Market size and forecast 2023-2028 ($ million)
        • Data Table on Australia - Market size and forecast 2023-2028 ($ million)
        • Chart on Australia - Year-over-year growth 2023-2028 (%)
        • Data Table on Australia - Year-over-year growth 2023-2028 (%)
      • 9.12 India - Market size and forecast 2023-2028
        • Chart on India - Market size and forecast 2023-2028 ($ million)
        • Data Table on India - Market size and forecast 2023-2028 ($ million)
        • Chart on India - Year-over-year growth 2023-2028 (%)
        • Data Table on India - Year-over-year growth 2023-2028 (%)
      • 9.13 Market opportunity by geography
        • Market opportunity by geography ($ million)
        • Data Tables on Market opportunity by geography ($ million)

      10 Drivers, Challenges, and Opportunity/Restraints

      • 10.1 Market drivers
        • 10.2 Market challenges
          • 10.3 Impact of drivers and challenges
            • Impact of drivers and challenges in 2023 and 2028
          • 10.4 Market opportunities/restraints

            11 Competitive Landscape

            • 11.1 Overview
              • 11.2 Competitive Landscape
                • Overview on criticality of inputs and factors of differentiation
              • 11.3 Landscape disruption
                • Overview on factors of disruption
              • 11.4 Industry risks
                • Impact of key risks on business

              12 Competitive Analysis

              • 12.1 Companies profiled
                • Companies covered
              • 12.2 Market positioning of companies
                • Matrix on companies position and classification
              • 12.3 Agilent Technologies Inc.
                • Agilent Technologies Inc. - Overview
                • Agilent Technologies Inc. - Business segments
                • Agilent Technologies Inc. - Key news
                • Agilent Technologies Inc. - Key offerings
                • Agilent Technologies Inc. - Segment focus
              • 12.4 ALS Ltd.
                • ALS Ltd. - Overview
                • ALS Ltd. - Business segments
                • ALS Ltd. - Key news
                • ALS Ltd. - Key offerings
                • ALS Ltd. - Segment focus
              • 12.5 Apal Agricultural Laboratory
                • Apal Agricultural Laboratory - Overview
                • Apal Agricultural Laboratory - Product / Service
                • Apal Agricultural Laboratory - Key offerings
              • 12.6 Eurofins Scientific SE
                • Eurofins Scientific SE - Overview
                • Eurofins Scientific SE - Business segments
                • Eurofins Scientific SE - Key news
                • Eurofins Scientific SE - Key offerings
                • Eurofins Scientific SE - Segment focus
              • 12.7 Harvesto Group
                • Harvesto Group - Overview
                • Harvesto Group - Product / Service
                • Harvesto Group - Key offerings
              • 12.8 Intertek Group Plc
                • Intertek Group Plc - Overview
                • Intertek Group Plc - Business segments
                • Intertek Group Plc - Key offerings
                • Intertek Group Plc - Segment focus
              • 12.9 RJ Hill Laboratories Ltd.
                • RJ Hill Laboratories Ltd. - Overview
                • RJ Hill Laboratories Ltd. - Product / Service
                • RJ Hill Laboratories Ltd. - Key offerings
              • 12.10 SGS SA
                • SGS SA - Overview
                • SGS SA - Business segments
                • SGS SA - Key news
                • SGS SA - Key offerings
                • SGS SA - Segment focus
              • 12.11 Thermo Fisher Scientific Inc.
                • Thermo Fisher Scientific Inc. - Overview
                • Thermo Fisher Scientific Inc. - Business segments
                • Thermo Fisher Scientific Inc. - Key news
                • Thermo Fisher Scientific Inc. - Key offerings
                • Thermo Fisher Scientific Inc. - Segment focus
              • 12.12 Tirupati Fresh Agro Crop Science Pvt. Ltd.
                • Tirupati Fresh Agro Crop Science Pvt. Ltd. - Overview
                • Tirupati Fresh Agro Crop Science Pvt. Ltd. - Product / Service
                • Tirupati Fresh Agro Crop Science Pvt. Ltd. - Key offerings

              13 Appendix

              • 13.1 Scope of the report
                • 13.2 Inclusions and exclusions checklist
                  • Inclusions checklist
                  • Exclusions checklist
                • 13.3 Currency conversion rates for US$
                  • Currency conversion rates for US$
                • 13.4 Research methodology
                  • Research methodology
                • 13.5 Data procurement
                  • Information sources
                • 13.6 Data validation
                  • Data validation
                • 13.7 Validation techniques employed for market sizing
                  • Validation techniques employed for market sizing
                • 13.8 Data synthesis
                  • Data synthesis
                • 13.9 360 degree market analysis
                  • 360 degree market analysis
                • 13.10 List of abbreviations
                  • List of abbreviations

                Research Methodology

                Technavio presents a detailed picture of the market by way of study, synthesis, and summation of data from multiple sources. The analysts have presented the various facets of the market with a particular focus on identifying the key industry influencers. The data thus presented is comprehensive, reliable, and the result of extensive research, both primary and secondary.

                INFORMATION SOURCES

                Primary sources

                • Manufacturers and suppliers
                • Channel partners
                • Industry experts
                • Strategic decision makers

                Secondary sources

                • Industry journals and periodicals
                • Government data
                • Financial reports of key industry players
                • Historical data
                • Press releases

                DATA ANALYSIS

                Data Synthesis

                • Collation of data
                • Estimation of key figures
                • Analysis of derived insights

                Data Validation

                • Triangulation with data models
                • Reference against proprietary databases
                • Corroboration with industry experts

                REPORT WRITING

                Qualitative

                • Market drivers
                • Market challenges
                • Market trends
                • Five forces analysis

                Quantitative

                • Market size and forecast
                • Market segmentation
                • Geographical insights
                • Competitive landscape

                Interested in this report?

                Get your sample now to see our research methodology and insights!

                Download Now

                Frequently Asked Questions

                Agricultural Testing market growth will increase by $ 1828.9 mn during 2024-2028 .

                The Agricultural Testing market is expected to grow at a CAGR of 5.55% during 2024-2028 .

                Agricultural Testing market is segmented by Application( Soil testing, Water testing, Seed testing, Others) Technology( Conventional technologies, Rapid technologies)

                Agilent Technologies Inc., ALS Ltd., Apal Agricultural Laboratory, AUREA Agrosciences, bioMerieux SA, Bionema Ltd., Bureau Veritas SA, Charm Sciences Inc., Element Materials Technology Group Ltd., Eurofins Scientific SE, Harvesto Group., Intertek Group Plc, Lilaba Analytical Laboratories, Neogen Corp., Polygon Agro India Pvt. Ltd., RJ Hill Laboratories Ltd., SGS SA, Staphyt, Thermo Fisher Scientific Inc., Tirupati Fresh Agro Crop Science Pvt. Ltd. are a few of the key vendors in the Agricultural Testing market.

                North America will register the highest growth rate of 37% among the other regions. Therefore, the Agricultural Testing market in North America is expected to garner significant business opportunities for the vendors during the forecast period.

                US, China, UK, Australia, India

                • Marked increase in soil and water contaminationRapid urbanization and an increasing number of commercial is the driving factor this market.
                • residential is the driving factor this market.
                • and industrial construction projects are encroaching upon agricultural land have led to agricultural pollution. For instance is the driving factor this market.
                • the disposal of industrial and agricultural waste in local bodies of water has led to water pollution. As a result is the driving factor this market.
                • contaminated water seeps into the soil exposing the crops to small amounts of mercury is the driving factor this market.
                • arsenic is the driving factor this market.
                • lead is the driving factor this market.
                • and cadmium dissolved in it. For instance is the driving factor this market.
                • in India is the driving factor this market.
                • the severely deteriorated water quality of the river Ganges is attributable to the constant release of untreated industrial effluents and human waste. Also is the driving factor this market.
                • the presence of several tanneries along the course of the river has contributed to the release of hazardous toxins in the form of liquid effluents containing chromium is the driving factor this market.
                • cadmium is the driving factor this market.
                • arsenic is the driving factor this market.
                • mercury is the driving factor this market.
                • nickel is the driving factor this market.
                • other salts is the driving factor this market.
                • and several other organic and inorganic wastes. Therefore is the driving factor this market.
                • toxic and hazardous elements that lack dilution capacity affect the quality of river water is the driving factor this market.
                • which eventually enters and contaminates the agricultural irrigation systems. Companies such as SGS provide water testing to evaluate water quality and contamination levels due to the presence of heavy metals is the driving factor this market.
                • arsenic is the driving factor this market.
                • and chromium is the driving factor this market.
                • salinity levels is the driving factor this market.
                • and more to improve agricultural productivity. Therefore is the driving factor this market.
                • agricultural testing services help farmers is the driving factor this market.
                • environmental agencies is the driving factor this market.
                • and others to combat the decline in agricultural productivity and the risk of crop failure is the driving factor this market.

                The Agricultural Testing market vendors should focus on grabbing business opportunities from the Soil testing segment as it accounted for the largest market share in the base year.