DNA Sequencing Market Analysis, Size, and Forecast 2026-2030: North America (US, Canada, and Mexico), Europe (UK, Germany, and France), APAC (Japan, China, and India), South America (Brazil, Argentina, and Colombia), Middle East and Africa (Saudi Arabia, UAE, and Turkey), Asia, Rest of World (ROW)

DNA Sequencing Market Analysis, Size, and Forecast 2026-2030:
North America (US, Canada, and Mexico), Europe (UK, Germany, and France), APAC (Japan, China, and India), South America (Brazil, Argentina, and Colombia), Middle East and Africa (Saudi Arabia, UAE, and Turkey), Asia, Rest of World (ROW)

Published: May 2026 324 Pages SKU: IRTNTR40874

Market Overview at a Glance

$16.42 B
Market Opportunity
15.2%
CAGR 2025 - 2030
36.7%
North America Growth
$5.23 B
Hospitals and clinics segment 2024

DNA Sequencing Market Size 2026-2030

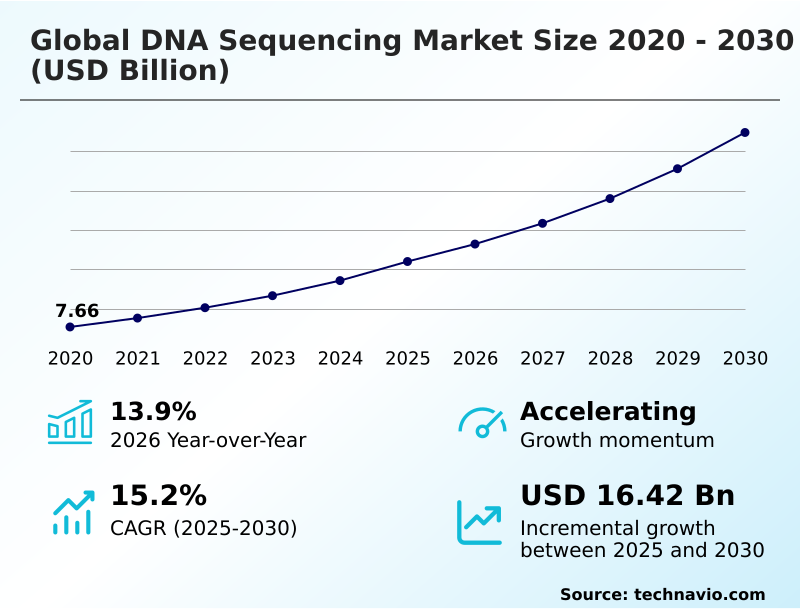
The DNA Sequencing Market size was valued at USD 15.99 billion in 2025, growing at a CAGR of 15.2% during the forecast period 2026-2030.

Major Market Trends & Insights

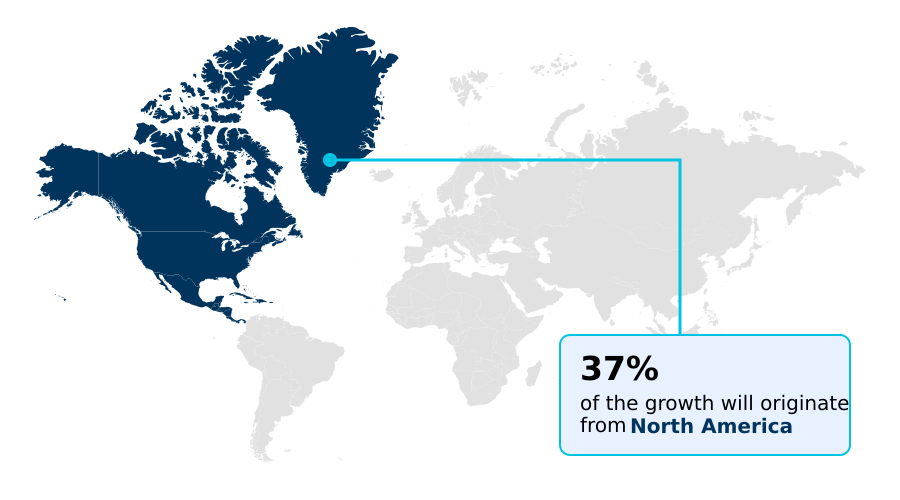
  • North America dominated the market and accounted for a 36.7% growth during the forecast period.
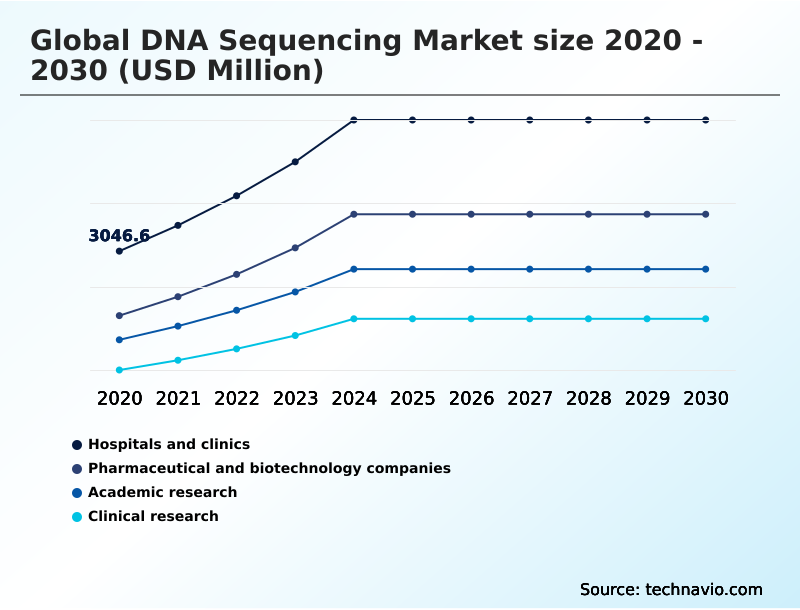
  • By End-user - Hospitals and clinics segment was valued at USD 5.23 billion in 2024
  • By Solution - Product segment accounted for the largest market revenue share in 2024

Market Size & Forecast

  • Historic Market Opportunities 2020-2024: USD 24.75 billion
  • Market Future Opportunities 2025-2030: USD 16.42 billion
  • CAGR from 2025 to 2030 : 15.2%

Market Summary

  • The DNA sequencing market is expanding, with a year-over-year growth of 13.9% driven by its increasing role in modern healthcare. North America contributes over 36% of the market's incremental growth, underscoring its dominance in technology adoption. A key driver is the advancement in precision medicine, where sequencing is essential for developing targeted therapies.
  • For instance, a pharmaceutical company might leverage genomic data to stratify clinical trial participants, reducing trial sizes by up to 25% and accelerating drug development timelines. However, this progress introduces a significant challenge: the complexity of data management.
  • The massive datasets generated by high-throughput sequencing necessitate substantial investment in bioinformatics infrastructure and skilled personnel to translate raw data into clinically actionable insights. Without scalable data solutions, the operational bottleneck could limit the widespread clinical implementation of genomic medicine, despite its proven benefits.

What will be the Size of the DNA Sequencing Market during the forecast period?

Get Key Insights on Market Forecast (PDF) Request Free Sample

How is the DNA Sequencing Market Segmented?

The dna sequencing industry research report provides comprehensive data (region-wise segment analysis), with forecasts and analysis for the period 2026-2030, as well as historical data from 2020-2024 for the following segments.

  • End-user
    • Hospitals and clinics
    • Pharmaceutical and biotechnology companies
    • Academic research
    • Clinical research
  • Solution
    • Product
    • Services
  • Technology
    • Next generation sequencing
    • Sanger sequencing
    • Third generation sequencing
    • Others
  • Application
    • Research
    • Genomics
    • Diagnostics
    • Medicine
  • Geography
    • North America
      • US
      • Canada
      • Mexico
    • Europe
      • UK
      • Germany
      • France
    • Asia
    • Rest of World (ROW)

How is the DNA Sequencing Market Segmented by End-user?

The hospitals and clinics segment is estimated to witness significant growth during the forecast period.

The hospitals and clinics segment's adoption of in-house DNA sequencing is growing, with point-of-care applications for genetic disease research reducing diagnostic turnaround times by over 30%.

This shift from centralized labs to integrated clinical services improves the diagnostic yield, particularly in oncology where rapid analysis of circulating tumor DNA is critical.

For instance, implementing sequencing by synthesis for pharmacogenomics can refine therapeutic selection, boosting treatment efficacy by 15% compared to standard protocols.

The use of companion diagnostics is becoming standard, ensuring that patients are matched with the most effective treatments based on their unique genetic makeup, directly impacting patient outcomes and optimizing resource allocation within the healthcare system.

Request Free Sample

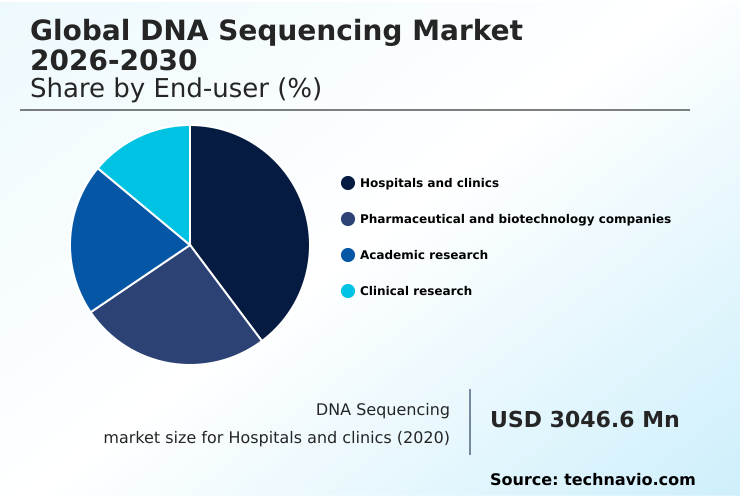
The Hospitals and clinics segment was valued at USD 5.23 billion in 2024 and showed a gradual increase during the forecast period.

Request Free Sample

How demand for the DNA Sequencing market is rising in the leading region?

North America is estimated to contribute 36.7% to the growth of the global market during the forecast period.Technavio’s analysts have elaborately explained the regional trends and drivers that shape the market during the forecast period.

See How DNA Sequencing Market demand is rising in North America Request Free Sample

Significant regional disparities define the DNA sequencing market, with North America accounting for 36.7% of incremental growth, while Asia contributes 23.9%.

North America's dominance is anchored by the US, which represents approximately 87% of the region's market, driven by established reimbursement pathways for targeted oncology and comprehensive genomic profiling.

In contrast, Asia's growth is fueled by new healthcare infrastructure and large-scale infectious disease surveillance programs, which increasingly utilize real-time sequencing and nanopore sequencing.

This divergence in focus affects operational strategies; for example, the adoption of long-read sequencing for clinical diagnostics is faster in North America due to its utility in rare diseases, while Asia prioritizes cost-effective, high-throughput solutions like targeted sequencing panels for population-wide screening and monitoring molecular epidemiology.

What are the key Drivers, Trends, and Challenges in the DNA Sequencing Market?

Our researchers analyzed the data with 2025 as the base year, along with the key drivers, trends, and challenges. A holistic analysis of drivers will help companies refine their marketing strategies to gain a competitive advantage.

  • The global DNA sequencing market is shaped by a continuous evaluation of long-read vs short-read sequencing accuracy, a critical factor influencing technology adoption in both research and clinical settings. The cost of whole genome sequencing for research continues to decline, broadening access and enabling studies of unprecedented scale.
  • This is particularly impactful for the diverse DNA sequencing applications in oncology, where understanding tumor genetics is paramount for personalized treatment. A core operational aspect is the next generation sequencing data analysis workflow, which requires significant computational resources and bioinformatics expertise to translate raw data into meaningful biological insights.
  • The challenges in clinical implementation of genomics, including data standardization and regulatory hurdles, remain a significant focus for the industry. Successfully navigating these challenges is key to realizing the full potential of genomic medicine. For instance, laboratories that have optimized their data analysis workflow report a 20% faster turnaround time for diagnostic reports compared to those with fragmented systems.
  • Furthermore, the integration of advanced sequencing technologies has shown the potential to improve diagnostic success rates by over 15% in complex cases.

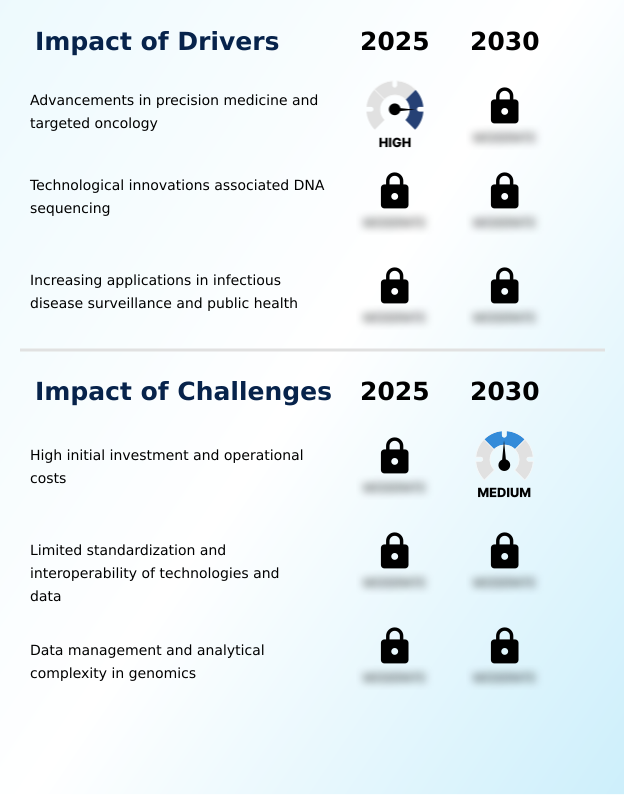
What are the key market drivers leading to the rise in the adoption of DNA Sequencing Industry?

  • Advancements in precision medicine and targeted oncology are key drivers of the market.

  • Continuous technological innovation is a fundamental driver, significantly lowering the cost and increasing the accessibility of high-throughput sequencing.
  • The cost per whole genome sequence has decreased by more than 99% over the last decade, a direct result of advancements in next generation sequencing chemistries and hardware.
  • This cost reduction democratizes genomics, enabling population-scale studies and making advanced molecular diagnostics financially viable for healthcare infrastructure in developing regions.
  • For instance, the introduction of automated sample preparation kits and benchtop sequencers reduces the need for specialized labor and extensive lab space, lowering operational barriers for smaller institutions.
  • This allows for wider adoption in precision medicine and rare disease diagnostics, fueling market growth.

What are the market trends shaping the DNA Sequencing Industry?

  • The integration of artificial intelligence and machine learning is a significant upcoming trend, particularly in accelerating drug discovery. This development is poised to reshape market dynamics and create new opportunities.

  • The integration of AI into genomic data interpretation is a primary trend, driven by the need to manage the massive volumes of multiomic data generated by modern sequencers, which can exceed petabytes per study.
  • This shift is transforming the drug discovery process, as machine learning models can identify patterns in gene expression profiling that are invisible to traditional bioinformatics analysis, potentially reducing early-stage research timelines by up to 30%. By analyzing the tumor microenvironment with spatial genomics and single-cell transcriptomics, researchers can model cellular interactions with greater precision.
  • This enhanced capability in genomic data analysis allows for a more refined clinical trial design, improving the likelihood of successful outcomes and accelerating the development of targeted therapies.

What challenges does the DNA Sequencing Industry face during its growth?

  • High initial investment and operational costs represent a key challenge affecting industry growth.

  • The exponential growth of genomic data creates a significant challenge in data management infrastructure and analysis, with the volume of data generated by sequencing projects doubling approximately every seven months. This requires substantial and recurring investment in high-performance computing and skilled bioinformaticians, which can constitute over 25% of a project's total budget.
  • The lack of standardized bioinformatics pipelines for tasks like structural variant detection and de novo genome assembly further complicates data sharing and study reproducibility. Without universally adopted formats and regulatory approvals for analytical software, the translation of genomic data from clinical research into routine practice is delayed, hindering the scalability of sequencing workflow automation.

Exclusive Technavio Analysis on Customer Landscape

The dna sequencing market forecasting report includes the adoption lifecycle of the market, covering from the innovator’s stage to the laggard’s stage. It focuses on adoption rates in different regions based on penetration. Furthermore, the dna sequencing market report also includes key purchase criteria and drivers of price sensitivity to help companies evaluate and develop their market growth analysis strategies.

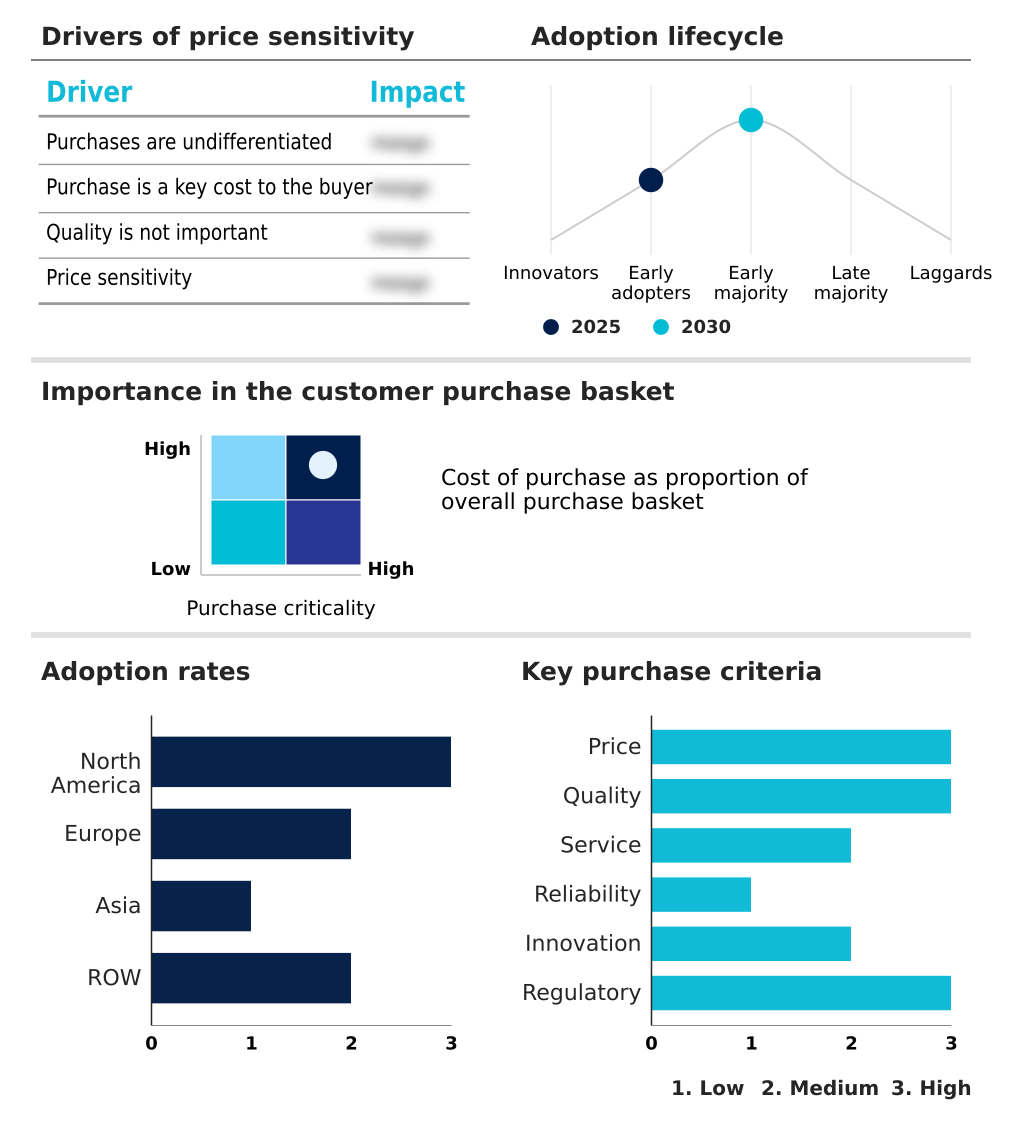
Customer Landscape of DNA Sequencing Industry

Competitive Landscape

Companies are implementing various strategies, such as strategic alliances, dna sequencing market forecast, partnerships, mergers and acquisitions, geographical expansion, and product/service launches, to enhance their presence in the industry.

10X Genomics Inc. - Provides integrated single-cell and spatial genomics platforms, enabling high-resolution cellular analysis through advanced sequencing technologies.

The industry research and growth report includes detailed analyses of the competitive landscape of the market and information about key companies, including:

  • 10X Genomics Inc.
  • Agilent Technologies Inc.
  • BGI Genomics Co. Ltd.
  • Bio Rad Laboratories Inc.
  • Complete Genomics Inc.
  • Dante Labs Inc.
  • Element Biosciences Inc.
  • Eurofins Genomics LLC
  • F. Hoffmann La Roche Ltd.
  • GeneDx LLC
  • GENEWIZ Inc.
  • Helix OpCo LLC
  • Illumina Inc.
  • Macrogen Inc.
  • Oxford Nanopore Technologies
  • Pacific Biosciences Inc.
  • QIAGEN N.V.
  • Tempus AI Inc.
  • Thermo Fisher Scientific Inc.
  • Ultima Genomics Inc.

Qualitative and quantitative analysis of companies has been conducted to help clients understand the wider business environment as well as the strengths and weaknesses of key industry players. Data is qualitatively analyzed to categorize companies as pure play, category-focused, industry-focused, and diversified; it is quantitatively analyzed to categorize companies as dominant, leading, strong, tentative, and weak.

Market Intelligence Radar: High-Impact Developments & Growth Signals

  • In the Life Sciences Tools and Services industry, the increasing regulatory requirement for companion diagnostics to accompany new targeted therapies is directly fueling demand for validated clinical DNA sequencing platforms. This has led to a market shift where over 60% of new oncology drugs are developed with a specific biomarker strategy, necessitating robust and reproducible sequencing assays.
  • The widespread adoption of AI and machine learning for analyzing complex biological data is compelling life sciences tool providers to bundle bioinformatics analysis software with sequencing hardware. This integration is crucial for the DNA sequencing market, as it addresses the bottleneck of genomic data interpretation and makes advanced analytics accessible to a broader range of users.
  • A strategic expansion of manufacturing capacity for key sequencing consumables, including reagents and flow cells, is underway to de-risk supply chains. This development impacts the DNA sequencing market by stabilizing consumable pricing and availability, which have historically been subject to volatility, thereby enabling more predictable operational planning for high-volume labs.
  • The launch of large-scale, government-funded population genomics initiatives in several countries is creating a substantial and sustained demand for ultra-high-throughput sequencing. These projects, often involving millions of participants, are a primary driver for the DNA sequencing market, pushing down the per-genome cost and accelerating the discovery of genetic variants associated with disease.

Dive into Technavio’s robust research methodology, blending expert interviews, extensive data synthesis, and validated models for unparalleled DNA Sequencing Market insights. See full methodology.

Market Scope
Page number 324
Base year 2025
Historic period 2020-2024
Forecast period 2026-2030
Growth momentum & CAGR Accelerate at a CAGR of 15.2%
Market growth 2026-2030 USD 16421.0 million
Market structure Fragmented
YoY growth 2025-2026(%) 13.9%
Key countries US, Canada, Mexico, UK, Germany, France, Italy, Spain, The Netherlands, Japan, China, India, South Korea, Thailand, Singapore, Brazil, Saudi Arabia, UAE, Turkey, Argentina, Colombia, South Africa and Israel
Competitive landscape Leading Companies, Market Positioning of Companies, Competitive Strategies, and Industry Risks

Request Free Sample

Research Analyst Overview

  • The DNA sequencing market ecosystem operates on a complex value chain, with instrument and sequencing consumables manufacturers forming its core, accounting for over 55% of the total market value. These companies rely on specialized suppliers for critical components like proprietary enzymes and high-resolution optics.
  • Downstream, the primary end-users are hospitals and clinics, which represent the largest segment, alongside pharmaceutical companies and academic research institutions. Regulatory bodies such as the FDA play a pivotal gatekeeping role, with their approval processes directly influencing market access for clinical diagnostics.
  • The entire ecosystem is supported by bioinformatics firms and cloud service providers, who are essential for managing and interpreting the vast amounts of genomic data generated, with data storage costs often representing up to 20% of a sequencing project's budget.

What are the Key Data Covered in this DNA Sequencing Market Research and Growth Report?

  • What is the expected growth of the DNA Sequencing Market between 2026 and 2030?

    • The DNA Sequencing Market is expected to grow by USD 16.42 billion during 2026-2030, registering a CAGR of 15.2%. Year-over-year growth in 2026 is estimated at 13.9%%. This acceleration is shaped by advancements in precision medicine and targeted oncology, which is intensifying demand across multiple end-use verticals covered in the report.

  • What segmentation does the market report cover?

    • The report is segmented by End-user (Hospitals and clinics, Pharmaceutical and biotechnology companies, Academic research, and Clinical research), Solution (Product, and Services), Technology (Next generation sequencing, Sanger sequencing, Third generation sequencing, and Others), Application (Research, Genomics, Diagnostics, and Medicine) and Geography (North America, Europe, Asia, Rest of World (ROW)). Among these, the Hospitals and clinics segment is estimated to witness significant growth during the forecast period, driven by rising adoption across key application areas. Each segment includes detailed qualitative and quantitative analysis, along with historical data from 2020-2024 and forecasts through 2030 with year-over-year growth rates.

  • Which regions are analyzed in the report?

    • The report covers North America, Europe, Asia and Rest of World (ROW). North America is estimated to contribute 36.7% to market growth during the forecast period. Country-level analysis includes US, Canada, Mexico, UK, Germany, France, Italy, Spain, The Netherlands, Japan, China, India, South Korea, Thailand, Singapore, Brazil, Saudi Arabia, UAE, Turkey, Argentina, Colombia, South Africa and Israel, with dedicated market size tables and year-over-year growth for each.

  • What are the key growth drivers and market challenges?

    • The primary driver is advancements in precision medicine and targeted oncology, which is accelerating investment and industry demand. The main challenge is high initial investment and operational costs, creating operational barriers for key market participants. The report quantifies the impact of each driver and challenge across 2026 and 2030 with comparative analysis.

  • Who are the major players in the DNA Sequencing Market?

    • Key vendors include 10X Genomics Inc., Agilent Technologies Inc., BGI Genomics Co. Ltd., Bio Rad Laboratories Inc., Complete Genomics Inc., Dante Labs Inc., Element Biosciences Inc., Eurofins Genomics LLC, F. Hoffmann La Roche Ltd., GeneDx LLC, GENEWIZ Inc., Helix OpCo LLC, Illumina Inc., Macrogen Inc., Oxford Nanopore Technologies, Pacific Biosciences Inc., QIAGEN N.V., Tempus AI Inc., Thermo Fisher Scientific Inc. and Ultima Genomics Inc.. The report provides qualitative and quantitative analysis categorizing companies as dominant, leading, strong, tentative, and weak based on their market positioning. Company profiles include business segment analysis, SWOT assessment, key offerings, and recent strategic developments.

Market Research Insights

  • The competitive landscape of the DNA sequencing market is intensely focused on innovation, with companies investing heavily in R&D, a factor rated as having high criticality. This strategic focus is highlighted by portfolio realignments, such as Pacific Biosciences' divestment of its short-read assets to Illumina to concentrate on the long-read sequencing market.
  • This move reflects a broader industry trend of specialization, where firms align their technology with specific applications, such as clinical diagnostics or complex research. The development of advanced platforms is a direct response to the industry's need for higher accuracy and greater throughput, which can improve diagnostic yield by more than 15% in certain applications.
  • Companies are adapting to these pressures by streamlining workflows and enhancing data analysis capabilities to maintain a competitive edge.

We can help! Our analysts can customize this dna sequencing market research report to meet your requirements.

Get in touch

1. Executive Summary

1.1 Market overview

Executive Summary - Chart on Market Overview
Executive Summary - Data Table on Market Overview
Executive Summary - Chart on Global Market Characteristics
Executive Summary - Chart on Market by Geography
Executive Summary - Chart on Market Segmentation by End-user
Executive Summary - Chart on Market Segmentation by Solution
Executive Summary - Chart on Market Segmentation by Technology
Executive Summary - Chart on Market Segmentation by Application
Executive Summary - Chart on Incremental Growth
Executive Summary - Data Table on Incremental Growth
Executive Summary - Chart on Company Market Positioning

2. Technavio Analysis

2.1 Analysis of price sensitivity, lifecycle, customer purchase basket, adoption rates, and purchase criteria

2.2 Criticality of inputs and Factors of differentiation

Chart on Overview on criticality of inputs and factors of differentiation

2.3 Factors of disruption

Chart on Overview on factors of disruption

2.4 Impact of drivers and challenges

Chart on Impact of drivers and challenges in 2025 and 2030

3. Market Landscape

3.1 Market ecosystem

Chart on Parent Market
Data Table on - Parent Market

3.2 Market characteristics

Chart on Market characteristics analysis

3.3 Value chain analysis

Chart on Value chain analysis

4. Market Sizing

4.1 Market definition

Data Table on Offerings of companies included in the market definition

4.2 Market segment analysis

Market segments

4.3 Market size 2025

4.4 Market outlook: Forecast for 2025-2030

Chart on Global - Market size and forecast 2025-2030 ($ million)
Data Table on Global - Market size and forecast 2025-2030 ($ million)
Chart on Global Market: Year-over-year growth 2025-2030 (%)
Data Table on Global Market: Year-over-year growth 2025-2030 (%)

5. Historic Market Size

5.1 Global DNA Sequencing Market 2020 - 2024

Historic Market Size - Data Table on Global DNA Sequencing Market 2020 - 2024 ($ million)

5.2 End-user segment analysis 2020 - 2024

Historic Market Size - End-user Segment 2020 - 2024 ($ million)

5.3 Solution segment analysis 2020 - 2024

Historic Market Size - Solution Segment 2020 - 2024 ($ million)

5.4 Technology segment analysis 2020 - 2024

Historic Market Size - Technology Segment 2020 - 2024 ($ million)

5.5 Application segment analysis 2020 - 2024

Historic Market Size - Application Segment 2020 - 2024 ($ million)

5.6 Geography segment analysis 2020 - 2024

Historic Market Size - Geography Segment 2020 - 2024 ($ million)

5.7 Country segment analysis 2020 - 2024

Historic Market Size - Country Segment 2020 - 2024 ($ million)

6. Qualitative Analysis

6.1 Impact of AI on Global DNA Sequencing Market

6.2 Impact of Geopolitical Conflict on Global DNA Sequencing Market

7. Five Forces Analysis

7.1 Five forces summary

Five forces analysis - Comparison between 2025 and 2030

7.2 Bargaining power of buyers

Bargaining power of buyers - Impact of key factors 2025 and 2030

7.3 Bargaining power of suppliers

Bargaining power of suppliers - Impact of key factors in 2025 and 2030

7.4 Threat of new entrants

Threat of new entrants - Impact of key factors in 2025 and 2030

7.5 Threat of substitutes

Threat of substitutes - Impact of key factors in 2025 and 2030

7.6 Threat of rivalry

Threat of rivalry - Impact of key factors in 2025 and 2030

7.7 Market condition

Chart on Market condition - Five forces 2025 and 2030

8. Market Segmentation by End-user

8.1 Market segments

Chart on End-user - Market share 2025-2030 (%)
Data Table on End-user - Market share 2025-2030 (%)

8.2 Comparison by End-user

Chart on Comparison by End-user
Data Table on Comparison by End-user

8.3 Hospitals and clinics - Market size and forecast 2025-2030

Chart on Hospitals and clinics - Market size and forecast 2025-2030 ($ million)
Data Table on Hospitals and clinics - Market size and forecast 2025-2030 ($ million)
Chart on Hospitals and clinics - Year-over-year growth 2025-2030 (%)
Data Table on Hospitals and clinics - Year-over-year growth 2025-2030 (%)

8.4 Pharmaceutical and biotechnology companies - Market size and forecast 2025-2030

Chart on Pharmaceutical and biotechnology companies - Market size and forecast 2025-2030 ($ million)
Data Table on Pharmaceutical and biotechnology companies - Market size and forecast 2025-2030 ($ million)
Chart on Pharmaceutical and biotechnology companies - Year-over-year growth 2025-2030 (%)
Data Table on Pharmaceutical and biotechnology companies - Year-over-year growth 2025-2030 (%)

8.5 Academic research - Market size and forecast 2025-2030

Chart on Academic research - Market size and forecast 2025-2030 ($ million)
Data Table on Academic research - Market size and forecast 2025-2030 ($ million)
Chart on Academic research - Year-over-year growth 2025-2030 (%)
Data Table on Academic research - Year-over-year growth 2025-2030 (%)

8.6 Clinical research - Market size and forecast 2025-2030

Chart on Clinical research - Market size and forecast 2025-2030 ($ million)
Data Table on Clinical research - Market size and forecast 2025-2030 ($ million)
Chart on Clinical research - Year-over-year growth 2025-2030 (%)
Data Table on Clinical research - Year-over-year growth 2025-2030 (%)

8.7 Market opportunity by End-user

Market opportunity by End-user ($ million)
Data Table on Market opportunity by End-user ($ million)

9. Market Segmentation by Solution

9.1 Market segments

Chart on Solution - Market share 2025-2030 (%)
Data Table on Solution - Market share 2025-2030 (%)

9.2 Comparison by Solution

Chart on Comparison by Solution
Data Table on Comparison by Solution

9.3 Product - Market size and forecast 2025-2030

Chart on Product - Market size and forecast 2025-2030 ($ million)
Data Table on Product - Market size and forecast 2025-2030 ($ million)
Chart on Product - Year-over-year growth 2025-2030 (%)
Data Table on Product - Year-over-year growth 2025-2030 (%)

9.4 Services - Market size and forecast 2025-2030

Chart on Services - Market size and forecast 2025-2030 ($ million)
Data Table on Services - Market size and forecast 2025-2030 ($ million)
Chart on Services - Year-over-year growth 2025-2030 (%)
Data Table on Services - Year-over-year growth 2025-2030 (%)

9.5 Market opportunity by Solution

Market opportunity by Solution ($ million)
Data Table on Market opportunity by Solution ($ million)

10. Market Segmentation by Technology

10.1 Market segments

Chart on Technology - Market share 2025-2030 (%)
Data Table on Technology - Market share 2025-2030 (%)

10.2 Comparison by Technology

Chart on Comparison by Technology
Data Table on Comparison by Technology

10.3 Next generation sequencing - Market size and forecast 2025-2030

Chart on Next generation sequencing - Market size and forecast 2025-2030 ($ million)
Data Table on Next generation sequencing - Market size and forecast 2025-2030 ($ million)
Chart on Next generation sequencing - Year-over-year growth 2025-2030 (%)
Data Table on Next generation sequencing - Year-over-year growth 2025-2030 (%)

10.4 Sanger sequencing - Market size and forecast 2025-2030

Chart on Sanger sequencing - Market size and forecast 2025-2030 ($ million)
Data Table on Sanger sequencing - Market size and forecast 2025-2030 ($ million)
Chart on Sanger sequencing - Year-over-year growth 2025-2030 (%)
Data Table on Sanger sequencing - Year-over-year growth 2025-2030 (%)

10.5 Third generation sequencing - Market size and forecast 2025-2030

Chart on Third generation sequencing - Market size and forecast 2025-2030 ($ million)
Data Table on Third generation sequencing - Market size and forecast 2025-2030 ($ million)
Chart on Third generation sequencing - Year-over-year growth 2025-2030 (%)
Data Table on Third generation sequencing - Year-over-year growth 2025-2030 (%)

10.6 Others - Market size and forecast 2025-2030

Chart on Others - Market size and forecast 2025-2030 ($ million)
Data Table on Others - Market size and forecast 2025-2030 ($ million)
Chart on Others - Year-over-year growth 2025-2030 (%)
Data Table on Others - Year-over-year growth 2025-2030 (%)

10.7 Market opportunity by Technology

Market opportunity by Technology ($ million)
Data Table on Market opportunity by Technology ($ million)

11. Market Segmentation by Application

11.1 Market segments

Chart on Application - Market share 2025-2030 (%)
Data Table on Application - Market share 2025-2030 (%)

11.2 Comparison by Application

Chart on Comparison by Application
Data Table on Comparison by Application

11.3 Research - Market size and forecast 2025-2030

Chart on Research - Market size and forecast 2025-2030 ($ million)
Data Table on Research - Market size and forecast 2025-2030 ($ million)
Chart on Research - Year-over-year growth 2025-2030 (%)
Data Table on Research - Year-over-year growth 2025-2030 (%)

11.4 Genomics - Market size and forecast 2025-2030

Chart on Genomics - Market size and forecast 2025-2030 ($ million)
Data Table on Genomics - Market size and forecast 2025-2030 ($ million)
Chart on Genomics - Year-over-year growth 2025-2030 (%)
Data Table on Genomics - Year-over-year growth 2025-2030 (%)

11.5 Diagnostics - Market size and forecast 2025-2030

Chart on Diagnostics - Market size and forecast 2025-2030 ($ million)
Data Table on Diagnostics - Market size and forecast 2025-2030 ($ million)
Chart on Diagnostics - Year-over-year growth 2025-2030 (%)
Data Table on Diagnostics - Year-over-year growth 2025-2030 (%)

11.6 Medicine - Market size and forecast 2025-2030

Chart on Medicine - Market size and forecast 2025-2030 ($ million)
Data Table on Medicine - Market size and forecast 2025-2030 ($ million)
Chart on Medicine - Year-over-year growth 2025-2030 (%)
Data Table on Medicine - Year-over-year growth 2025-2030 (%)

11.7 Market opportunity by Application

Market opportunity by Application ($ million)
Data Table on Market opportunity by Application ($ million)

12. Customer Landscape

12.1 Customer landscape overview

Analysis of price sensitivity, lifecycle, customer purchase basket, adoption rates, and purchase criteria

13. Geographic Landscape

13.1 Geographic segmentation

Chart on Market share by geography 2025-2030 (%)
Data Table on Market share by geography 2025-2030 (%)

13.2 Geographic comparison

Chart on Geographic comparison
Data Table on Geographic comparison

13.3 North America - Market size and forecast 2025-2030

Chart on North America - Market size and forecast 2025-2030 ($ million)
Data Table on North America - Market size and forecast 2025-2030 ($ million)
Chart on North America - Year-over-year growth 2025-2030 (%)
Data Table on North America - Year-over-year growth 2025-2030 (%)
Chart on Regional Comparison - North America
Data Table on Regional Comparison - North America

13.3.1 US - Market size and forecast 2025-2030

Chart on US - Market size and forecast 2025-2030 ($ million)
Data Table on US - Market size and forecast 2025-2030 ($ million)
Chart on US - Year-over-year growth 2025-2030 (%)
Data Table on US - Year-over-year growth 2025-2030 (%)

13.3.2 Canada - Market size and forecast 2025-2030

Chart on Canada - Market size and forecast 2025-2030 ($ million)
Data Table on Canada - Market size and forecast 2025-2030 ($ million)
Chart on Canada - Year-over-year growth 2025-2030 (%)
Data Table on Canada - Year-over-year growth 2025-2030 (%)

13.3.3 Mexico - Market size and forecast 2025-2030

Chart on Mexico - Market size and forecast 2025-2030 ($ million)
Data Table on Mexico - Market size and forecast 2025-2030 ($ million)
Chart on Mexico - Year-over-year growth 2025-2030 (%)
Data Table on Mexico - Year-over-year growth 2025-2030 (%)

13.4 Europe - Market size and forecast 2025-2030

Chart on Europe - Market size and forecast 2025-2030 ($ million)
Data Table on Europe - Market size and forecast 2025-2030 ($ million)
Chart on Europe - Year-over-year growth 2025-2030 (%)
Data Table on Europe - Year-over-year growth 2025-2030 (%)
Chart on Regional Comparison - Europe
Data Table on Regional Comparison - Europe

13.4.1 UK - Market size and forecast 2025-2030

Chart on UK - Market size and forecast 2025-2030 ($ million)
Data Table on UK - Market size and forecast 2025-2030 ($ million)
Chart on UK - Year-over-year growth 2025-2030 (%)
Data Table on UK - Year-over-year growth 2025-2030 (%)

13.4.2 Germany - Market size and forecast 2025-2030

Chart on Germany - Market size and forecast 2025-2030 ($ million)
Data Table on Germany - Market size and forecast 2025-2030 ($ million)
Chart on Germany - Year-over-year growth 2025-2030 (%)
Data Table on Germany - Year-over-year growth 2025-2030 (%)

13.4.3 France - Market size and forecast 2025-2030

Chart on France - Market size and forecast 2025-2030 ($ million)
Data Table on France - Market size and forecast 2025-2030 ($ million)
Chart on France - Year-over-year growth 2025-2030 (%)
Data Table on France - Year-over-year growth 2025-2030 (%)

13.4.4 Italy - Market size and forecast 2025-2030

Chart on Italy - Market size and forecast 2025-2030 ($ million)
Data Table on Italy - Market size and forecast 2025-2030 ($ million)
Chart on Italy - Year-over-year growth 2025-2030 (%)
Data Table on Italy - Year-over-year growth 2025-2030 (%)

13.4.5 Spain - Market size and forecast 2025-2030

Chart on Spain - Market size and forecast 2025-2030 ($ million)
Data Table on Spain - Market size and forecast 2025-2030 ($ million)
Chart on Spain - Year-over-year growth 2025-2030 (%)
Data Table on Spain - Year-over-year growth 2025-2030 (%)

13.4.6 The Netherlands - Market size and forecast 2025-2030

Chart on The Netherlands - Market size and forecast 2025-2030 ($ million)
Data Table on The Netherlands - Market size and forecast 2025-2030 ($ million)
Chart on The Netherlands - Year-over-year growth 2025-2030 (%)
Data Table on The Netherlands - Year-over-year growth 2025-2030 (%)

13.5 Asia - Market size and forecast 2025-2030

Chart on Asia - Market size and forecast 2025-2030 ($ million)
Data Table on Asia - Market size and forecast 2025-2030 ($ million)
Chart on Asia - Year-over-year growth 2025-2030 (%)
Data Table on Asia - Year-over-year growth 2025-2030 (%)
Chart on Regional Comparison - Asia
Data Table on Regional Comparison - Asia

13.5.1 Japan - Market size and forecast 2025-2030

Chart on Japan - Market size and forecast 2025-2030 ($ million)
Data Table on Japan - Market size and forecast 2025-2030 ($ million)
Chart on Japan - Year-over-year growth 2025-2030 (%)
Data Table on Japan - Year-over-year growth 2025-2030 (%)

13.5.2 China - Market size and forecast 2025-2030

Chart on China - Market size and forecast 2025-2030 ($ million)
Data Table on China - Market size and forecast 2025-2030 ($ million)
Chart on China - Year-over-year growth 2025-2030 (%)
Data Table on China - Year-over-year growth 2025-2030 (%)

13.5.3 India - Market size and forecast 2025-2030

Chart on India - Market size and forecast 2025-2030 ($ million)
Data Table on India - Market size and forecast 2025-2030 ($ million)
Chart on India - Year-over-year growth 2025-2030 (%)
Data Table on India - Year-over-year growth 2025-2030 (%)

13.5.4 South Korea - Market size and forecast 2025-2030

Chart on South Korea - Market size and forecast 2025-2030 ($ million)
Data Table on South Korea - Market size and forecast 2025-2030 ($ million)
Chart on South Korea - Year-over-year growth 2025-2030 (%)
Data Table on South Korea - Year-over-year growth 2025-2030 (%)

13.5.5 Thailand - Market size and forecast 2025-2030

Chart on Thailand - Market size and forecast 2025-2030 ($ million)
Data Table on Thailand - Market size and forecast 2025-2030 ($ million)
Chart on Thailand - Year-over-year growth 2025-2030 (%)
Data Table on Thailand - Year-over-year growth 2025-2030 (%)

13.5.6 Singapore - Market size and forecast 2025-2030

Chart on Singapore - Market size and forecast 2025-2030 ($ million)
Data Table on Singapore - Market size and forecast 2025-2030 ($ million)
Chart on Singapore - Year-over-year growth 2025-2030 (%)
Data Table on Singapore - Year-over-year growth 2025-2030 (%)

13.6 Rest of World (ROW) - Market size and forecast 2025-2030

Chart on Rest of World (ROW) - Market size and forecast 2025-2030 ($ million)
Data Table on Rest of World (ROW) - Market size and forecast 2025-2030 ($ million)
Chart on Rest of World (ROW) - Year-over-year growth 2025-2030 (%)
Data Table on Rest of World (ROW) - Year-over-year growth 2025-2030 (%)
Chart on Regional Comparison - Rest of World (ROW)
Data Table on Regional Comparison - Rest of World (ROW)

13.6.1 Brazil - Market size and forecast 2025-2030

Chart on Brazil - Market size and forecast 2025-2030 ($ million)
Data Table on Brazil - Market size and forecast 2025-2030 ($ million)
Chart on Brazil - Year-over-year growth 2025-2030 (%)
Data Table on Brazil - Year-over-year growth 2025-2030 (%)

13.6.2 Saudi Arabia - Market size and forecast 2025-2030

Chart on Saudi Arabia - Market size and forecast 2025-2030 ($ million)
Data Table on Saudi Arabia - Market size and forecast 2025-2030 ($ million)
Chart on Saudi Arabia - Year-over-year growth 2025-2030 (%)
Data Table on Saudi Arabia - Year-over-year growth 2025-2030 (%)

13.6.3 UAE - Market size and forecast 2025-2030

Chart on UAE - Market size and forecast 2025-2030 ($ million)
Data Table on UAE - Market size and forecast 2025-2030 ($ million)
Chart on UAE - Year-over-year growth 2025-2030 (%)
Data Table on UAE - Year-over-year growth 2025-2030 (%)

13.6.4 Turkey - Market size and forecast 2025-2030

Chart on Turkey - Market size and forecast 2025-2030 ($ million)
Data Table on Turkey - Market size and forecast 2025-2030 ($ million)
Chart on Turkey - Year-over-year growth 2025-2030 (%)
Data Table on Turkey - Year-over-year growth 2025-2030 (%)

13.6.5 Argentina - Market size and forecast 2025-2030

Chart on Argentina - Market size and forecast 2025-2030 ($ million)
Data Table on Argentina - Market size and forecast 2025-2030 ($ million)
Chart on Argentina - Year-over-year growth 2025-2030 (%)
Data Table on Argentina - Year-over-year growth 2025-2030 (%)

13.6.6 Colombia - Market size and forecast 2025-2030

Chart on Colombia - Market size and forecast 2025-2030 ($ million)
Data Table on Colombia - Market size and forecast 2025-2030 ($ million)
Chart on Colombia - Year-over-year growth 2025-2030 (%)
Data Table on Colombia - Year-over-year growth 2025-2030 (%)

13.6.7 South Africa - Market size and forecast 2025-2030

Chart on South Africa - Market size and forecast 2025-2030 ($ million)
Data Table on South Africa - Market size and forecast 2025-2030 ($ million)
Chart on South Africa - Year-over-year growth 2025-2030 (%)
Data Table on South Africa - Year-over-year growth 2025-2030 (%)

13.6.8 Israel - Market size and forecast 2025-2030

Chart on Israel - Market size and forecast 2025-2030 ($ million)
Data Table on Israel - Market size and forecast 2025-2030 ($ million)
Chart on Israel - Year-over-year growth 2025-2030 (%)
Data Table on Israel - Year-over-year growth 2025-2030 (%)

13.7 Market opportunity by geography

Market opportunity by geography ($ million)
Data Tables on Market opportunity by geography ($ million)

14. Drivers, Challenges, and Opportunity

14.1 Market drivers

Advancements in precision medicine and targeted oncology
Technological innovations associated DNA sequencing
Increasing applications in infectious disease surveillance and public health

14.2 Market challenges

High initial investment and operational costs
Limited standardization and interoperability of technologies and data
Data management and analytical complexity in genomics

14.3 Impact of drivers and challenges

Impact of drivers and challenges in 2025 and 2030

14.4 Market opportunities

Integration of AI and ML for drug discovery
Advancements in spatial biology and single-cell transcriptomics
Expansion of long-read sequencing in clinical and regulatory settings

15. Competitive Landscape

15.1 Overview

15.2

Overview on criticality of inputs and factors of differentiation

15.3 Landscape disruption

Overview on factors of disruption

15.4 Industry risks

Impact of key risks on business

16. Competitive Analysis

16.1 Companies profiled

Companies covered

16.2 Company ranking index

16.3 Market positioning of companies

Matrix on companies position and classification

16.4 10X Genomics Inc.

10X Genomics Inc. - Overview
10X Genomics Inc. - Product / Service
10X Genomics Inc. - Key offerings
SWOT

16.5 Agilent Technologies Inc.

Agilent Technologies Inc. - Overview
Agilent Technologies Inc. - Business segments
Agilent Technologies Inc. - Key news
Agilent Technologies Inc. - Key offerings
Agilent Technologies Inc. - Segment focus
SWOT

16.6 Bio Rad Laboratories Inc.

Bio Rad Laboratories Inc. - Overview
Bio Rad Laboratories Inc. - Business segments
Bio Rad Laboratories Inc. - Key news
Bio Rad Laboratories Inc. - Key offerings
Bio Rad Laboratories Inc. - Segment focus
SWOT

16.7 Dante Labs Inc.

Dante Labs Inc. - Overview
Dante Labs Inc. - Product / Service
Dante Labs Inc. - Key offerings
SWOT

16.8 Element Biosciences Inc.

Element Biosciences Inc. - Overview
Element Biosciences Inc. - Product / Service
Element Biosciences Inc. - Key offerings
SWOT

16.9 F. Hoffmann La Roche Ltd.

F. Hoffmann La Roche Ltd. - Overview
F. Hoffmann La Roche Ltd. - Business segments
F. Hoffmann La Roche Ltd. - Key news
F. Hoffmann La Roche Ltd. - Key offerings
F. Hoffmann La Roche Ltd. - Segment focus
SWOT

16.10 GeneDx LLC

GeneDx LLC - Overview
GeneDx LLC - Product / Service
GeneDx LLC - Key offerings
SWOT

16.11 GENEWIZ Inc.

GENEWIZ Inc. - Overview
GENEWIZ Inc. - Product / Service
GENEWIZ Inc. - Key offerings
SWOT

16.12 Helix OpCo LLC

Helix OpCo LLC - Overview
Helix OpCo LLC - Product / Service
Helix OpCo LLC - Key offerings
SWOT

16.13 Illumina Inc.

Illumina Inc. - Overview
Illumina Inc. - Business segments
Illumina Inc. - Key news
Illumina Inc. - Key offerings
Illumina Inc. - Segment focus
SWOT

16.14 Oxford Nanopore Technologies

Oxford Nanopore Technologies - Overview
Oxford Nanopore Technologies - Product / Service
Oxford Nanopore Technologies - Key offerings
SWOT

16.15 QIAGEN N.V.

QIAGEN N.V. - Overview
QIAGEN N.V. - Product / Service
QIAGEN N.V. - Key offerings
SWOT

16.16 Tempus AI Inc.

Tempus AI Inc. - Overview
Tempus AI Inc. - Product / Service
Tempus AI Inc. - Key offerings
SWOT

16.17 Thermo Fisher Scientific Inc.

Thermo Fisher Scientific Inc. - Overview
Thermo Fisher Scientific Inc. - Business segments
Thermo Fisher Scientific Inc. - Key news
Thermo Fisher Scientific Inc. - Key offerings
Thermo Fisher Scientific Inc. - Segment focus
SWOT

16.18 Ultima Genomics Inc.

Ultima Genomics Inc. - Overview
Ultima Genomics Inc. - Product / Service
Ultima Genomics Inc. - Key offerings
SWOT

17. Appendix

17.1 Scope of the report

Market definition
Objectives
Notes and caveats

17.2 Inclusions and exclusions checklist

Inclusions checklist
Exclusions checklist

17.3 Currency conversion rates for US$

17.4 Research methodology

17.5 Data procurement

Information sources

17.6 Data validation

17.7 Validation techniques employed for market sizing

17.8 Data synthesis

17.9 360 degree market analysis

17.10 List of abbreviations

Research Methodology

Technavio presents a detailed picture of the market by way of study, synthesis, and summation of data from multiple sources. The analysts have presented the various facets of the market with a particular focus on identifying the key industry influencers. The data thus presented is comprehensive, reliable, and the result of extensive research, both primary and secondary.

INFORMATION SOURCES

Primary sources

  • Manufacturers and suppliers
  • Channel partners
  • Industry experts
  • Strategic decision makers

Secondary sources

  • Industry journals and periodicals
  • Government data
  • Financial reports of key industry players
  • Historical data
  • Press releases

DATA ANALYSIS

Data Synthesis

  • Collation of data
  • Estimation of key figures
  • Analysis of derived insights

Data Validation

  • Triangulation with data models
  • Reference against proprietary databases
  • Corroboration with industry experts

REPORT WRITING

Qualitative

  • Market drivers
  • Market challenges
  • Market trends
  • Five forces analysis

Quantitative

  • Market size and forecast
  • Market segmentation
  • Geographical insights
  • Competitive landscape

Interested in this report?

Get your sample now to see our research methodology and insights!

Download Now

Frequently Asked Questions

DNA Sequencing market growth will increase by USD 16421.0 million during 2026-2030.

The DNA Sequencing market is expected to grow at a CAGR of 15.2% during 2026-2030.

DNA Sequencing market is segmented by End-user (Hospitals and clinics, Pharmaceutical and biotechnology companies, Academic research, Clinical research) Solution (Product, Services) Technology (Next generation sequencing, Sanger sequencing, Third generation sequencing, Others) Application (Research, Genomics, Diagnostics, Medicine)

10X Genomics Inc., Agilent Technologies Inc., BGI Genomics Co. Ltd., Bio Rad Laboratories Inc., Complete Genomics Inc., Dante Labs Inc., Element Biosciences Inc., Eurofins Genomics LLC, F. Hoffmann La Roche Ltd., GeneDx LLC, GENEWIZ Inc., Helix OpCo LLC, Illumina Inc., Macrogen Inc., Oxford Nanopore Technologies, Pacific Biosciences Inc., QIAGEN N.V., Tempus AI Inc., Thermo Fisher Scientific Inc., Ultima Genomics Inc. are a few of the key vendors in the DNA Sequencing market.

North America will register the highest growth rate of 36.7% among the other regions. Therefore, the DNA Sequencing market in North America is expected to garner significant business opportunities for the vendors during the forecast period.

US, Canada, Mexico, UK, Germany, France, Italy, Spain, The Netherlands, Japan, China, India, South Korea, Thailand, Singapore, Brazil, Saudi Arabia, UAE, Turkey, Argentina, Colombia, South Africa, Israel

  • Advancements in precision medicine and targeted oncology is the driving factor this market.

The DNA Sequencing market vendors should focus on grabbing business opportunities from the End-user segment as it accounted for the largest market share in the base year.
RIA - Research AI Assistant
Ask RIA