Food Safety Testing Market Size 2025-2029
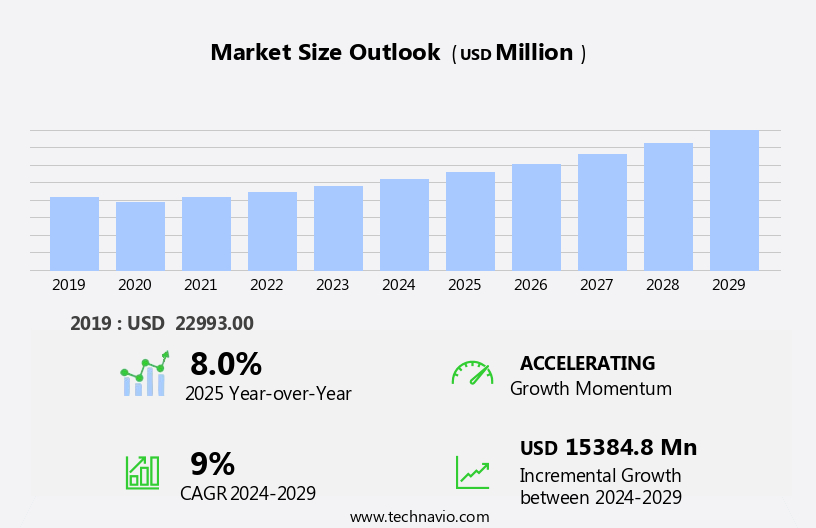
The food safety testing market size is forecast to increase by USD 15.38 billion at a CAGR of 9% between 2024 and 2029.
- The market is experiencing significant growth, driven by the increasing involvement of government agencies in ensuring food safety and the adoption of advanced robotics for the automation of food safety testing. Regulatory bodies worldwide are implementing stringent regulations to mitigate foodborne illnesses, leading to a demand for food safety testing services. Moreover, the integration of robotics and automation in food safety testing is streamlining processes, enhancing accuracy, and reducing turnaround times. However, challenges persist in the market. Infrastructure gaps and underutilization of resources, particularly in developing countries, hinder market expansion. Regulatory hurdles, such as approval processes and compliance requirements, also impact adoption. Manufacturers are investing more in robust food safety management systems and food pathogen testing to reduce the risks associated with contaminated products.
- To capitalize on market opportunities and navigate these challenges effectively, companies must focus on expanding their presence in emerging markets, investing in research and development for advanced technologies, and collaborating with regulatory bodies to streamline approval processes. FSSC 22000 certification demonstrates the effectiveness of a manufacturer's safety management system or PCR system for food diagnostics and is often required by supply chain purchasers. By addressing these challenges and leveraging market trends, players can differentiate themselves and secure a competitive edge in the market.
What will be the Size of the Food Safety Testing Market during the forecast period?
- The market is a critical sector in ensuring the production and distribution of safe and wholesome food products. Food safety certification plays a pivotal role in maintaining consumer trust and adhering to quality assurance standards. A strong food safety culture, reinforced by robust procedures and protocols, is essential for preventing food safety incidents. Food safety experts and consultants provide valuable insights and guidance to businesses seeking to implement effective food safety programs and policies. Advancements in food safety technology have revolutionized testing services, enabling faster and more accurate identification of foodborne diseases through analytical chemistry labs and microbiology tests. Testing solutions include meat identification using ELISA, freshness control using quality index methods and organoleptic checks, and detection of heavy metals, pesticides, biotoxins, and other residues.
- Food safety legislation and regulations mandate regular food safety audits and inspections to ensure compliance with guidelines and prevent outbreaks. Food safety awareness is a continuous process, with ongoing education and training essential for maintaining a comprehensive food safety system. Accreditation and certification from recognized food safety labs and organizations further validate a business's commitment to food safety excellence. By prioritizing food safety procedures and policies, businesses can mitigate risks and protect their brand reputation.
How is this Food Safety Testing Industry segmented?
The food safety testing industry research report provides comprehensive data (region-wise segment analysis), with forecasts and estimates in "USD million" for the period 2025-2029, as well as historical data from 2019-2023 for the following segments.
- Type
- Meat and poultry
- Fruits and vegetables
- Processed foods
- Dairy
- Others
- Technology
- Rapid
- Traditional
- Product Type
- Pathogen
- Genetically modified organism
- Allergen
- Chemical and pesticides
- Others
- Geography
- North America
- US
- Canada
- Europe
- France
- Germany
- UK
- Middle East and Africa
- UAE
- APAC
- China
- India
- Japan
- South America
- Brazil
- Rest of World (ROW)
- North America
By Type Insights
The meat and poultry segment is estimated to witness significant growth during the forecast period. The market encompasses various sectors, with meat and poultry holding a substantial share due to the heightened risk of foodborne illnesses and safety scandals. Food testing solutions for this segment include ELISA for meat identification, quality index method and organoleptic checks for freshness control, and detection of heavy metals, pesticides, biotoxins, and pathogens. Microbiological tests are crucial, assessing indicators like coliforms, enterobacter species, staphylococcus, lactic acid bacteria, yeast, mold, and pathogens such as salmonella, campylobacter, listeria, and E. Coli. New technologies, such as gas chromatography and mass spectrometry, are being used to detect these contaminants more efficiently and accurately. Next-generation sequencing and molecular diagnostics play a significant role in pathogen detection and food safety certification.
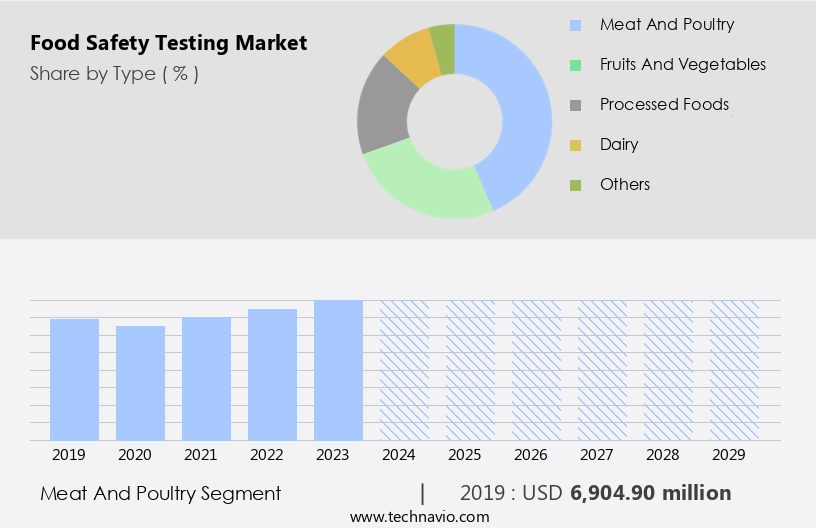
The Meat and poultry segment was valued at USD 6.9 billion in 2019 and showed a gradual increase during the forecast period. New technologies, such as automation and artificial intelligence, are helping to address these challenges by increasing efficiency and reducing costs. Food preservatives, food spoilage, food distribution, food safety training, and regulatory compliance are also critical aspects of the market. Food service, data analytics, and supply chain management are essential for maintaining brand reputation and ensuring product quality. Food additives, chemical analysis, and microbial contamination are other significant areas of focus. Sensory analysis, food traceability, and microbiological testing employ advanced techniques like artificial intelligence and mass spectrometry. Food fraud, heavy metal analysis, pesticide residue analysis, antibiotic residues, and food labeling are additional concerns addressed by the market. The market's evolution is driven by consumer confidence, regulatory compliance, and the need for improved food safety standards.
Regional Analysis
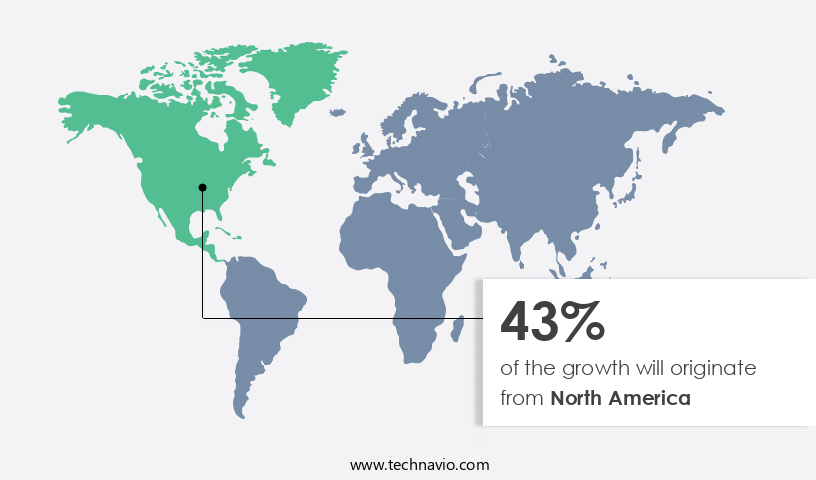
North America is estimated to contribute 43% to the growth of the global market during the forecast period. Technavio's analysts have elaborately explained the regional trends and drivers that shape the market during the forecast period. StartFragment The Food Safety Testing Market is expanding with advanced microbiology labs, food safety labs, and analytical chemistry labs, ensuring stringent quality control. Robust food safety programs and food safety education help prevent food safety incidents and mitigate risks of food safety outbreaks leading to foodborne diseases. Compliance with food safety guidelines, food safety protocols, and food safety policy strengthens industry standards. Companies implement a food safety plan with regular food safety audits and food safety inspections to achieve food safety accreditation. Expert guidance from food safety consultants and food safety experts enhances best practices.
The food manufacturing sector in North America is witnessing significant growth, leading to an increased demand for food safety testing. The US Food and Drug Administration (FDA) plays a pivotal role in ensuring food safety, with the recent issuance of the Final Rule Laboratory Accreditation for food analysis under the Food Safety and Modernization Act (FSMA). This regulation, which was passed in 2011, focuses on preventing food contamination rather than just mitigating foodborne illnesses. The FSMA's implementation calls for rigorous food safety testing to ensure only safe products reach consumers, thereby driving the adoption of food safety testing solutions in the region.
Analytical methods, such as next-generation sequencing and molecular diagnostics, play a crucial role in food safety testing. These advanced techniques enable the detection of pathogens, food adulteration, allergens, and veterinary drug residues, among other contaminants. Food preservatives and additives, as well as chemical analysis, help prevent food spoilage and extend shelf life. Food distribution channels also require stringent quality control measures, including microbial contamination testing and sensory analysis, to maintain consumer confidence. Food safety training and certification programs ensure that food handlers and processors are knowledgeable about safe practices. Foodborne illness outbreaks and food fraud incidents have an impact on food safety standards.
Regulatory compliance and product recalls necessitate robust supply chain management and data analytics to trace the origin of contaminated products and minimize their impact. Heavy metal analysis, pesticide residue analysis, and food labeling regulations further add to the complexity of food safety testing. Artificial intelligence and machine learning technologies are increasingly being employed to streamline processes, improve accuracy, and enhance the overall efficiency of food safety testing. The market in North America is experiencing significant growth due to the increasing focus on food safety and the implementation of regulations like the FSMA. Advanced analytical methods, food safety training, and regulatory compliance are key drivers of market growth.
The integration of technology, such as artificial intelligence and data analytics, is expected to further propel the market forward.
Market Dynamics
Our researchers analyzed the data with 2024 as the base year, along with the key drivers, trends, and challenges. A holistic analysis of drivers will help companies refine their marketing strategies to gain a competitive advantage.
What are the Food Safety Testing market drivers leading to the rise in the adoption of Industry?
- The involvement of government agencies is a significant driving factor in market growth. This increased presence contributes to market expansion and development, ensuring a professional and formal environment. The market is experiencing significant growth due to the increasing emphasis on food safety regulations and consumer awareness. Government agencies, such as the European Commission, establish principles and requirements for food and feed laws to ensure public health. These regulations cover various aspects of food safety, including pathogen detection, food adulteration, allergen testing, nutritional analysis, and veterinary drug residues. Molecular diagnostics and mass spectrometry are emerging technologies used in food safety testing for rapid and accurate detection of contaminants. Pathogens like Salmonella, Listeria, and E. Coli can cause foodborne illnesses, leading to significant health risks and economic losses.
- Allergen testing is crucial to ensure the safety of consumers with food allergies, while nutritional analysis helps maintain the quality and accuracy of food labeling. The detection of contaminants like heavy metals, pesticides, and veterinary drug residues is essential to ensure food safety. For instance, mercury and methylmercury are toxic metals that can lead to diseases and organ damage if ingested. The European Food Safety Authority (EFSA) evaluates the exposure of European populations to mercury through food products and sets maximum levels for certain contaminants to ensure food safety. Effective supply chain management is critical to maintaining food safety throughout the production process.
What are the Food Safety Testing market trends shaping the Industry?
- Advanced robotics are increasingly being adopted for automating food safety testing, representing a significant market trend in the industry. This automation not only enhances the efficiency and accuracy of food safety tests but also ensures consistent results and reduces the risk of human error. Food safety is a critical concern for food service businesses to maintain quality control and regulatory compliance. Robots have become increasingly important in the food production process to ensure food safety and hygiene standards. Initially, they were used primarily for palletizing and packaging. However, their role has expanded to include production and picking. This trend is driven by rising labor costs, employee health issues from repetitive motions, and high costs of food safety and hygiene compliance. Robots offer several advantages in managing food safety. They can operate in severe environments, such as freezing temperatures for frozen foods, without compromising speed or reliability.
- Additionally, robots minimize human contact with food products, reducing the risk of contamination from norovirus outbreaks caused by infected employees. Data analytics plays a significant role in food safety testing. It helps identify antibiotic residues, heavy metal analysis, and food fraud. Regulatory compliance is crucial to avoid product recalls and protect brand reputation. Robots' precision and consistency make them ideal for ensuring regulatory compliance and maintaining high-quality food products. The use of robots in food production is essential for maintaining food safety and hygiene standards. They offer advantages such as operating in severe environments, minimizing human contact with food products, and ensuring regulatory compliance. Data analytics is another critical component of food safety testing, helping identify potential issues and maintain product quality. Food service businesses must prioritize food safety to protect their brand reputation and ensure customer satisfaction.
How does Food Safety Testing market faces challenges face during its growth?
- In developing countries, the absence of sufficient infrastructure and the underutilization of resources represent significant challenges impeding the growth of industries. Food safety testing is a critical aspect of ensuring the quality and safety of the global food supply chain. In developed countries, advanced food safety tests are readily available for various analyses, including food labeling, pesticide residue analysis, food additives, chemical analysis, microbial contamination, sensory analysis, food traceability, and microbiological testing. However, the affordability and accessibility of these tests remain a challenge in developing countries, where the food contamination burden is high. To address some of these challenges, outsourcing and local production of food safety test equipment and systems could be viable strategies. For instance, in India, the Food Regulatory Authority has identified the lack of infrastructure and workforce in Delhi's Food Safety Department as a significant barrier to meeting testing requirements.
- However, implementing these practices comes with its own set of challenges. For example, the high cost of advanced testing equipment and the need for skilled personnel to operate and interpret test results can be significant barriers to entry for small and medium-sized enterprises (SMEs) in developing countries. Moreover, the lack of regulatory frameworks and standardization can further complicate matters. Despite these challenges, the importance of food safety testing cannot be overstated. The health and wellness of people in developing countries depend on the availability of accurate and reliable food safety tests. Therefore, it is crucial to find innovative solutions to make these tests more affordable and accessible to all.
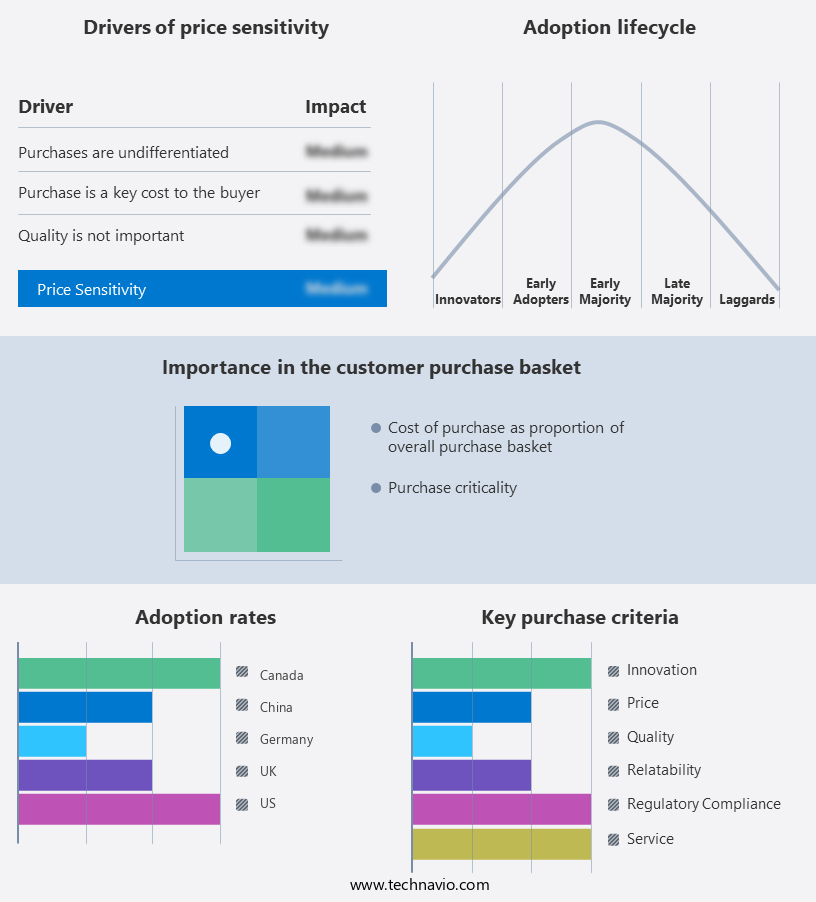
Exclusive Customer Landscape
The food safety testing market forecasting report includes the adoption lifecycle of the market, covering from the innovator's stage to the laggard's stage. It focuses on adoption rates in different regions based on penetration. Furthermore, the food safety testing market report also includes key purchase criteria and drivers of price sensitivity to help companies evaluate and develop their market growth analysis strategies.
Customer Landscape
Key Companies & Market Insights
Companies are implementing various strategies, such as strategic alliances, food safety testing market forecast, partnerships, mergers and acquisitions, geographical expansion, and product/service launches, to enhance their presence in the industry.
ADPEN Laboratories Inc. - The company specializes in comprehensive food safety testing services, encompassing pesticide residue analysis, contaminant detection, and nutritional analysis.
The industry research and growth report includes detailed analyses of the competitive landscape of the market and information about key companies, including:
- ADPEN Laboratories Inc.
- Agilent Technologies Inc.
- ALS Ltd.
- AsureQuality Ltd.
- Bio Rad Laboratories Inc.
- BioMerieux SA
- Bureau Veritas SA
- Campden BRI
- Element Materials Technology
- EMSL Analytical Inc.
- Eurofins Scientific SE
- FoodChain ID Group Inc.
- Intertek Group Plc
- Merieux NutriSciences Corp.
- Microbac Laboratories Inc.
- Neogen Corp.
- RJ Hill Laboratories Ltd.
- Romer Labs Division Holding GmbH
- Thermo Fisher Scientific Inc.
- TUV SUD AG
Qualitative and quantitative analysis of companies has been conducted to help clients understand the wider business environment as well as the strengths and weaknesses of key industry players. Data is qualitatively analyzed to categorize companies as pure play, category-focused, industry-focused, and diversified; it is quantitatively analyzed to categorize companies as dominant, leading, strong, tentative, and weak.
Recent Development and News in Food Safety Testing Market
- In February 2024, Thermo Fisher Scientific, a leading life sciences solutions provider, announced the launch of its new food safety solution, the TSXpress Food POX Amp Kit, which offers rapid detection of Listeria monocytogenes and Salmonella enterica in food samples (Thermo Fisher Scientific Press Release, 2024). This new product addresses the growing demand for rapid and accurate food safety testing, particularly in the context of increasing food recalls and consumer concerns.
- In March 2025, SGS, a global inspection, verification, testing, and certification company, entered into a strategic partnership with IBM to leverage IBM's Watson for Food Safety technology for enhancing food safety testing and analysis services (IBM Press Release, 2025). This collaboration combines SGS's expertise in food safety testing with IBM's advanced AI and data analytics capabilities, aiming to provide more accurate and efficient food safety solutions for clients.
- In May 2024, Eurofins Scientific, a global analytical testing laboratory, completed the acquisition of Bio-Techne Corporation's food testing business, expanding its food testing capabilities and market presence (Eurofins Scientific Press Release, 2024). This acquisition added over 1,500 employees and 15 laboratories to Eurofins' food testing division, significantly increasing its capacity and market share in the market.
- In July 2025, the European Union implemented new regulations (EU Regulation 2025/1234) on food safety testing, which mandated the use of specific analytical methods and increased the frequency of testing for certain food contaminants (European Commission, 2025). This regulatory change is expected to drive demand for advanced food safety testing solutions and services, as companies adapt to the new requirements.
Research Analyst Overview
The market continues to evolve, driven by the dynamic nature of food manufacturing and the ever-evolving consumer demand for safe and high-quality food products. Analytical methods play a crucial role in ensuring food safety, encompassing various applications such as pesticide residue analysis, food additives, chemical analysis, microbial contamination, sensory analysis, food traceability, microbiological testing, and food processing. Consumer confidence is paramount in the food industry, necessitating rigorous food safety audits and sample preparation procedures. Foodborne illness, a persistent concern, is addressed through next-generation sequencing and pathogen detection techniques. Food preservatives and food spoilage are managed through molecular diagnostics and data analytics, ensuring regulatory compliance and brand reputation.
Food distribution channels require robust supply chain management and quality control measures to mitigate risks associated with food safety issues. Food service establishments prioritize microbiological testing and sensory analysis to maintain high standards. Veterinary drug residues and antibiotic residues are monitored through advanced analytical techniques, while food adulteration and food fraud are detected using heavy metal analysis and food labeling verification. Artificial intelligence and machine learning are increasingly integrated into food processing and sample collection processes, enhancing efficiency and accuracy. Regulatory compliance and product recall processes are streamlined through data analytics and food safety certification programs. The ongoing unfolding of market activities underscores the importance of continuous innovation and adaptation in the food safety testing landscape.
Dive into Technavio's strong research methodology, blending expert interviews, extensive data synthesis, and validated models for unparalleled Food Safety Testing Market insights. See full methodology.
|
Market Scope |
|
|
Report Coverage |
Details |
|
Page number |
229 |
|
Base year |
2024 |
|
Historic period |
2019-2023 |
|
Forecast period |
2025-2029 |
|
Growth momentum & CAGR |
Accelerate at a CAGR of 9% |
|
Market growth 2025-2029 |
USD 15.38 billion |
|
Market structure |
Fragmented |
|
YoY growth 2024-2025(%) |
8.0 |
|
Key countries |
US, China, Germany, Canada, UK, France, Brazil, Japan, India, and UAE |
|
Competitive landscape |
Leading Companies, Market Positioning of Companies, Competitive Strategies, and Industry Risks |
What are the Key Data Covered in this Food Safety Testing Market Research and Growth Report?
- CAGR of the Food Safety Testing industry during the forecast period
- Detailed information on factors that will drive the growth and forecasting between 2025 and 2029
- Precise estimation of the size of the market and its contribution of the industry in focus to the parent market
- Accurate predictions about upcoming growth and trends and changes in consumer behaviour
- Growth of the market across North America, Europe, Asia, and Rest of World (ROW)
- Thorough analysis of the market's competitive landscape and detailed information about companies
- Comprehensive analysis of factors that will challenge the food safety testing market growth of industry companies
We can help! Our analysts can customize this food safety testing market research report to meet your requirements.
 RIA -
RIA - 
