Environmental Testing Market Analysis, Size, and Forecast 2025-2029: North America (US, Canada, and Mexico), Europe (Germany, UK, and France), APAC (China, Japan, and India), South America (Brazil and Argentina), Middle East and Africa (Saudi Arabia, UAE, and South Africa), and Rest of World (ROW)

Environmental Testing Market Analysis, Size, and Forecast 2025-2029:
North America (US, Canada, and Mexico), Europe (Germany, UK, and France), APAC (China, Japan, and India), South America (Brazil and Argentina), Middle East and Africa (Saudi Arabia, UAE, and South Africa), and Rest of World (ROW)

Published: Dec 2025 310 Pages SKU: IRTNTR73331

Market Overview at a Glance

$4.26 B
Market Opportunity
7.9%
CAGR 2024 - 2029
34.3%
North America Growth
$3.30 B
Air testing segment 2023

Environmental Testing Market Size 2025-2029

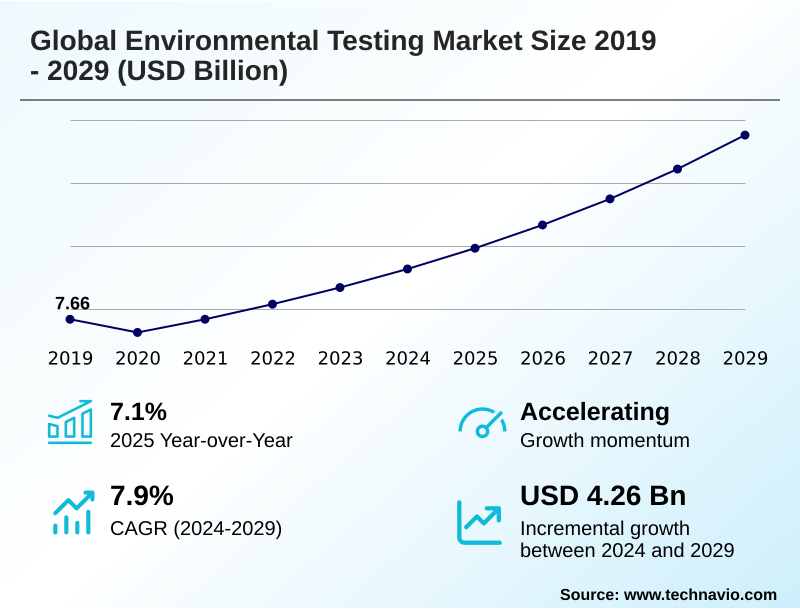
The environmental testing market size is valued to increase by USD 4.26 billion, at a CAGR of 7.9% from 2024 to 2029. Marked increase in soil contamination will drive the environmental testing market.

Major Market Trends & Insights

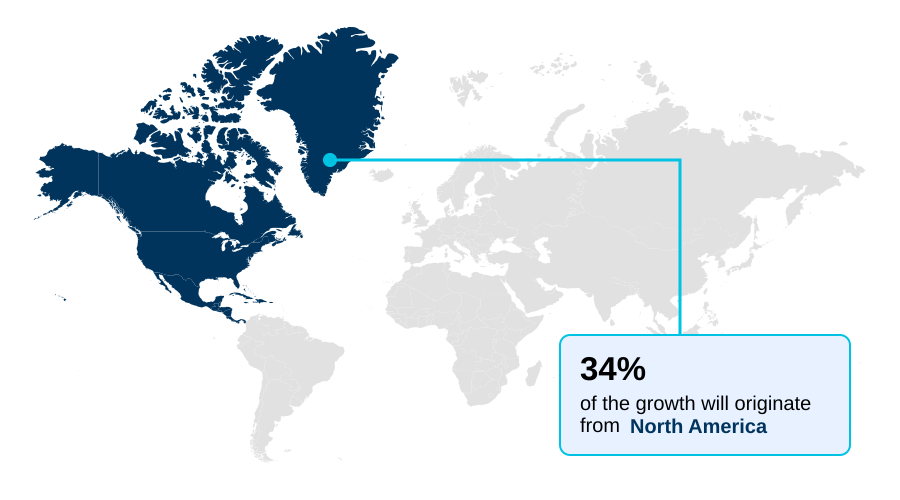
  • North America dominated the market and accounted for a 34.3% growth during the forecast period.
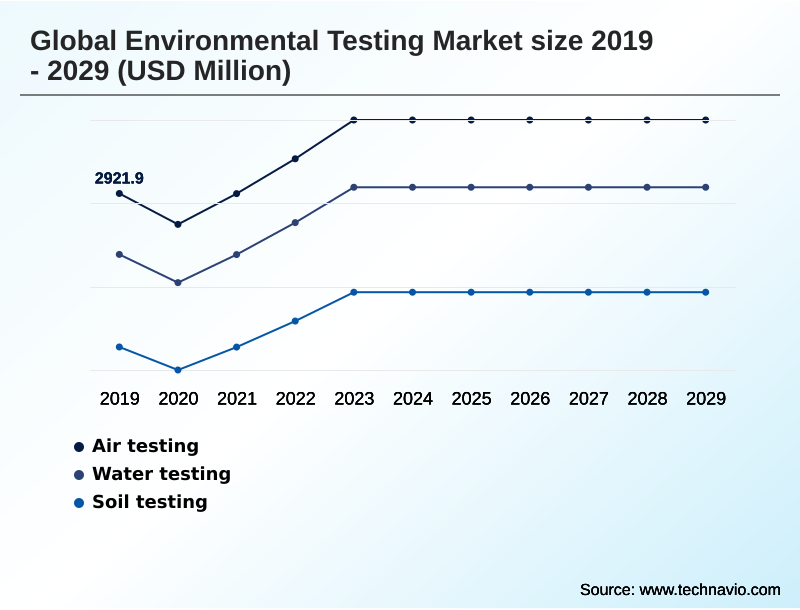
  • By Application - Air testing segment was valued at USD 3.30 billion in 2023
  • By Product - Mass spectrometers segment accounted for the largest market revenue share in 2023

Market Size & Forecast

  • Market Opportunities: USD 5.86 billion
  • Market Future Opportunities: USD 4.26 billion
  • CAGR from 2024 to 2029 : 7.9%

Market Summary

  • The environmental testing market is foundational to safeguarding public health and ensuring ecological balance amid growing industrial and urban pressures. Its scope extends beyond simple measurements, encompassing complex chemical analysis, microbiological testing, and radiological assessments to identify and quantify pollutants in air, water, and soil.
  • A key driver is the enforcement of stringent regulatory compliance testing standards globally, compelling industries to invest in continuous environmental monitoring. For instance, a manufacturing facility might deploy real-time monitoring systems for its discharge, using data from advanced analytical instruments to optimize its wastewater analysis and treatment processes.
  • This proactive approach not only prevents costly penalties but also reinforces corporate environmental stewardship. Trends such as the focus on emerging contaminants like PFAS and the integration of digital infrastructure are pushing laboratories to adopt more sophisticated technologies, including chromatography and mass spectrometers, to achieve greater accuracy and efficiency in contaminant characterization and support large-scale environmental remediation efforts.

What will be the Size of the Environmental Testing Market during the forecast period?

Get Key Insights on Market Forecast (PDF) Request Free Sample

How is the Environmental Testing Market Segmented?

The environmental testing industry research report provides comprehensive data (region-wise segment analysis), with forecasts and estimates in "USD million" for the period 2025-2029, as well as historical data from 2019-2023 for the following segments.

  • Application
    • Air testing
    • Water testing
    • Soil testing
  • Product
    • Mass spectrometers
    • Chromatography
    • pH meters
    • Molecular spectroscopy products
    • TOC analyzers
  • Type
    • Temperature testing
    • Humidity testing
    • Climatic testing
    • Shock and vibration testing
    • Others
  • Geography
    • North America
      • US
      • Canada
      • Mexico
    • Europe
      • Germany
      • UK
      • France
    • APAC
      • China
      • Japan
      • India
    • South America
      • Brazil
      • Argentina
    • Middle East and Africa
      • Saudi Arabia
      • UAE
      • South Africa
    • Rest of World (ROW)

By Application Insights

The air testing segment is estimated to witness significant growth during the forecast period.

The air testing segment is expanding significantly, driven by stringent regulatory frameworks and heightened focus on public health.

Industrial compliance is a primary catalyst, with sectors such as manufacturing and energy mandated to monitor emissions of pollutants like volatile organic compounds and particulate matter.

This demand is amplified by urbanization, necessitating robust ambient air quality monitoring networks and noise testing.

A pivotal regulatory action recently lowered the primary annual PM2.5 standard by 25%, compelling states to implement new reduction plans and driving demand for precise air testing and radiological assessments.

The subsegment of indoor air quality is also growing, fueled by awareness of health risks from heavy metals and mold, prompting increased use of environmental sensors and molecular diagnostics in commercial and institutional buildings.

Request Free Sample

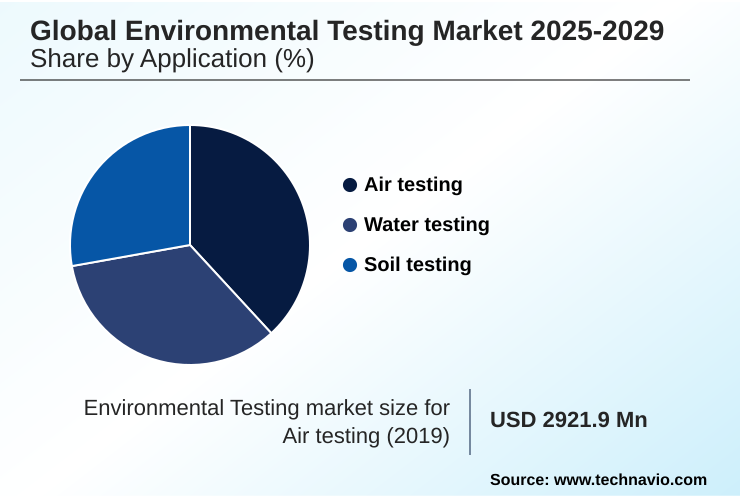
The Air testing segment was valued at USD 3.30 billion in 2023 and showed a gradual increase during the forecast period.

Request Free Sample

Regional Analysis

North America is estimated to contribute 34.3% to the growth of the global market during the forecast period.Technavio’s analysts have elaborately explained the regional trends and drivers that shape the market during the forecast period.

See How Environmental Testing Market Demand is Rising in North America Request Free Sample

North America is set to contribute approximately 34.3% of the market's incremental growth, driven by stringent enforcement and public awareness, with a pronounced focus on brownfield redevelopment testing and PFAS detection services.

Europe, accounting for around 28.8% of the growth, emphasizes compliance with comprehensive frameworks, which drives demand for industrial effluent monitoring and wastewater analysis.

The APAC region is a dynamic landscape where rapid industrialization fuels the need for ambient air quality monitoring and site investigation services.

The use of hydrocarbon forensics in these regions is increasing, while techniques like thermal cycling and humidity testing are crucial for ensuring instrument reliability across all geographies.

Market Dynamics

Our researchers analyzed the data with 2024 as the base year, along with the key drivers, trends, and challenges. A holistic analysis of drivers will help companies refine their marketing strategies to gain a competitive advantage.

  • The demand for specialized testing services is escalating as industries navigate complex regulatory landscapes. The necessity for environmental testing for industrial compliance has become a cornerstone of operational strategy, forcing companies to adopt robust monitoring programs. This includes implementing real time air quality monitoring systems in urban and industrial zones to manage emissions proactively.
  • In the water sector, advanced PFAS testing methodologies for water are becoming critical as awareness of these persistent chemicals grows, leading to more stringent drinking water standards. Consequently, facilities are investing in comprehensive wastewater analysis for regulatory reporting to avoid significant non-compliance penalties. In agriculture and land development, the focus is twofold.
  • First, heavy metal detection in agricultural soil is essential for ensuring food safety and sustainable farming practices. Second, the need for effective soil contamination assessment and remediation services is paramount for redeveloping brownfield sites safely. To manage the increasing sample volume and complexity, laboratory automation for high throughput environmental testing is being widely adopted.
  • Facilities that have automated their workflows report data turnaround times up to 40% faster than their manual counterparts, providing a distinct competitive advantage in a time-sensitive market.

What are the key market drivers leading to the rise in the adoption of Environmental Testing Industry?

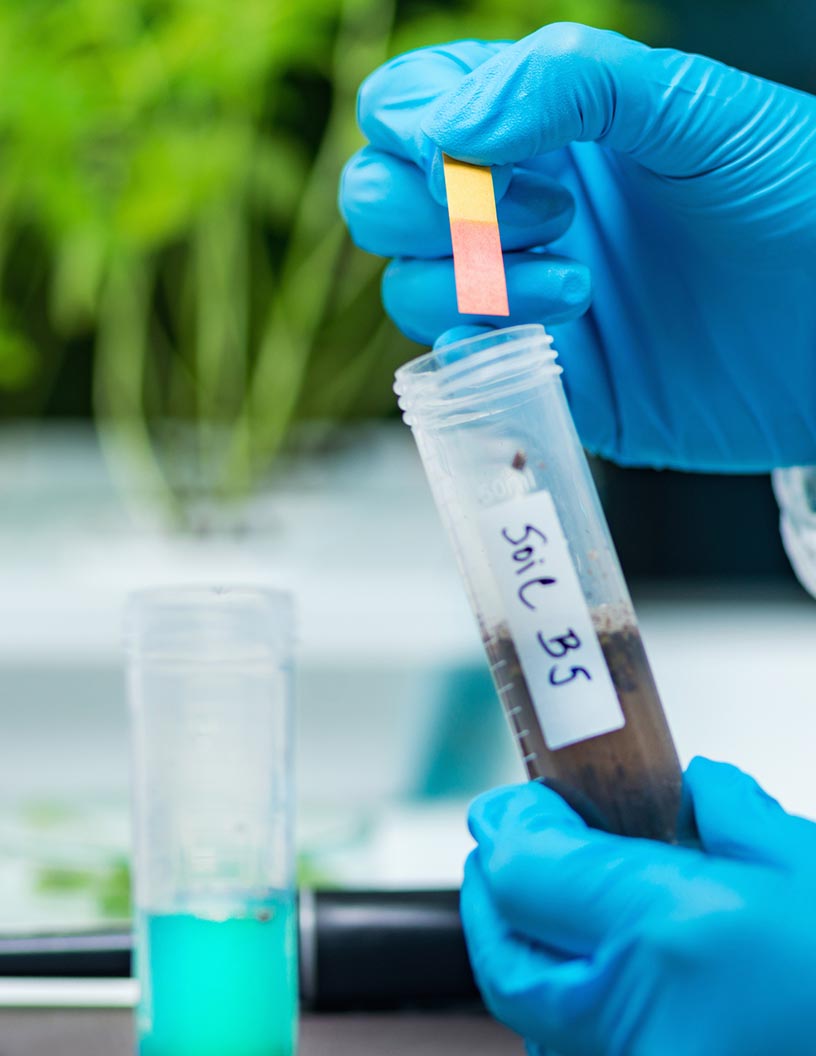
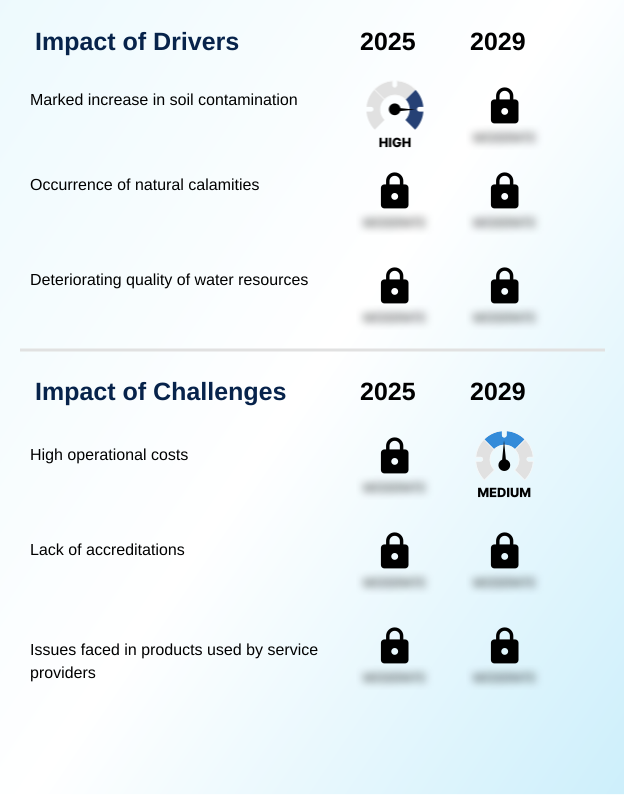
  • A marked increase in soil contamination, largely resulting from escalating industrial and agricultural activities, serves as a primary driver for the environmental testing market.

  • Deteriorating environmental quality is a primary market driver, with a significant rise in water-related diseases necessitating more robust testing protocols.
  • A marked increase in contamination is fueling demand for comprehensive soil testing, water testing, and air testing, which prompts stricter pollution control programs and regulatory compliance testing.
  • Consequently, there is a greater need for advanced techniques like spectroscopy, gas chromatography, and liquid chromatography for accurate contaminant characterization.
  • The need for effective remediation strategies and land restoration projects has driven a 25% year-over-year increase in demand for specialized analytical services in affected regions, particularly for industrial effluent monitoring.

What are the market trends shaping the Environmental Testing Industry?

  • A notable trend shaping the market is the increasing prevalence of strategic partnerships and collaborations, which are instrumental for leveraging technological capabilities and expanding market presence.

  • Strategic alliances are reshaping the environmental testing landscape, with firms reporting a 15% increase in R&D efficiency through collaborative ventures. The adoption of advanced environmental sensors and miniaturized sensors based on MEMS technology is a key trend, enabling more effective environmental monitoring and the deployment of real-time monitoring systems.
  • These partnerships facilitate the development of cutting-edge molecular spectroscopy products and enhance capabilities in PFAS analysis. This collaborative approach supports circular economy initiatives and improves environmental stewardship, particularly as companies leverage shared expertise in geospatial data and remote sensing tools to address complex challenges related to emerging contaminants.
  • This integration has been shown to improve project success rates by over 20%.

What challenges does the Environmental Testing Industry face during its growth?

  • High operational costs, driven by the need for advanced analytical instruments and specialized personnel, present a significant challenge to profitability and market expansion.

  • High operational costs remain a significant barrier, as labs must invest heavily in sophisticated analytical instruments like mass spectrometers and TOC analyzers, which can account for up to 50% of a new facility’s budget. The complexity of performing chemical analysis, microbiological testing, and radiological assessments to detect persistent organic pollutants and heavy metals demands skilled personnel, adding to expenses.
  • Furthermore, supply chain disruptions for reagents can delay project timelines by an average of 15%. Integrating modern digital infrastructure for managing data from pH meters and other devices also requires substantial upfront investment, challenging smaller firms.

Exclusive Technavio Analysis on Customer Landscape

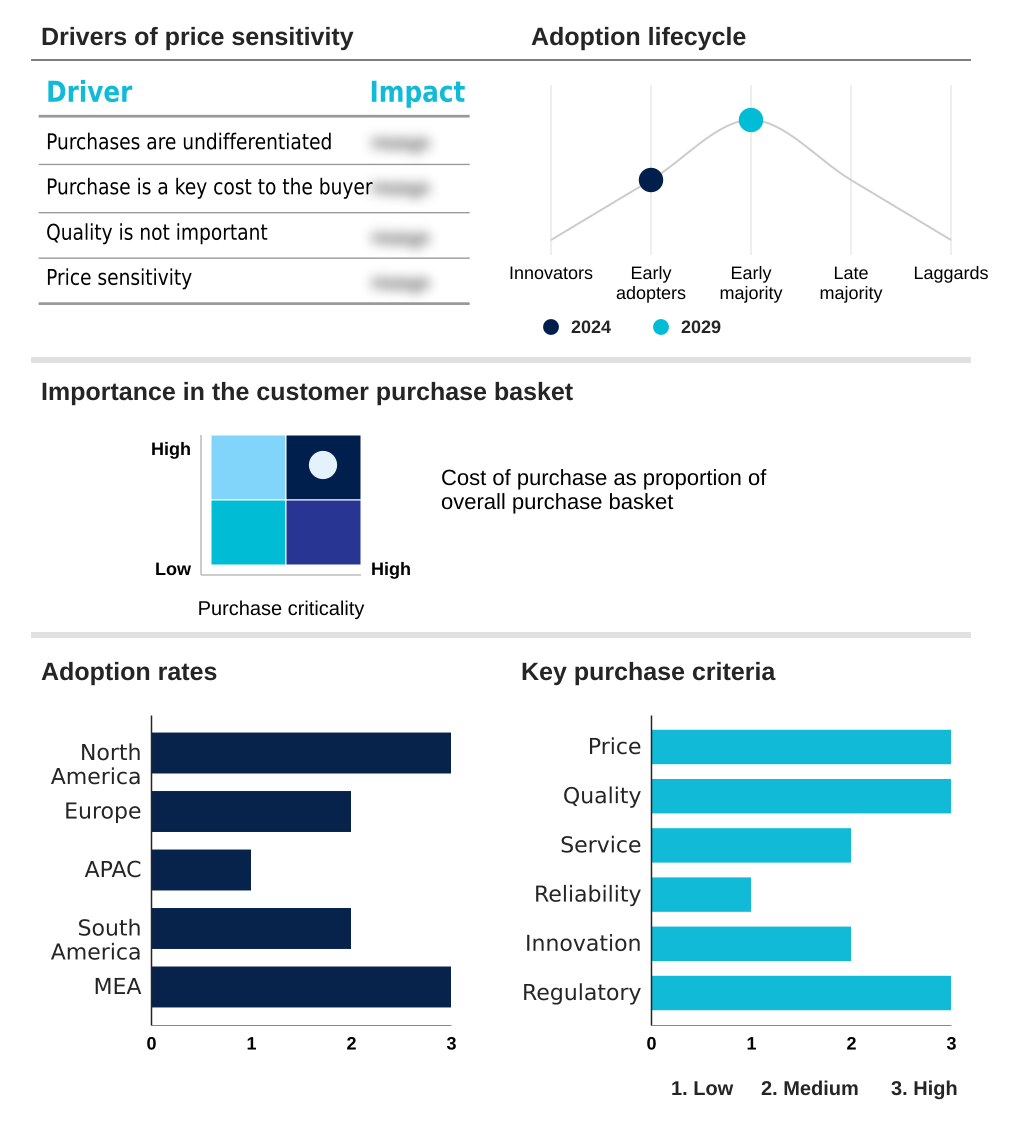
The environmental testing market forecasting report includes the adoption lifecycle of the market, covering from the innovator’s stage to the laggard’s stage. It focuses on adoption rates in different regions based on penetration. Furthermore, the environmental testing market report also includes key purchase criteria and drivers of price sensitivity to help companies evaluate and develop their market growth analysis strategies.

Customer Landscape of Environmental Testing Industry

Competitive Landscape

Companies are implementing various strategies, such as strategic alliances, environmental testing market forecast, partnerships, mergers and acquisitions, geographical expansion, and product/service launches, to enhance their presence in the industry.

Advanced Environmental Testing and Research Lab - Offers comprehensive analytical testing and sampling services, featuring remote monitoring solutions for environmental, food, and pharmaceutical markets to ensure quality and compliance.

The industry research and growth report includes detailed analyses of the competitive landscape of the market and information about key companies, including:

  • Advanced Environmental Testing and Research Lab
  • Alpha Analytical Inc.
  • ALS Ltd.
  • American Environmental Testing Laboratory LLC
  • AnaLabs Inc.
  • Apal Agricultural Laboratory
  • AS International Corporation Ltd.
  • AsureQuality Ltd.
  • Bureau Veritas SA
  • EMSL Analytical Inc.
  • Eurofins Scientific SE
  • Hydrologic Associates
  • Intertek Group Plc
  • Merieux NutriSciences Corp.
  • Microbac Laboratories Inc.
  • Pace Analytical Services LLC
  • RJ Hill Laboratories Ltd.
  • SGS SA
  • Symbio Laboratories
  • TUV SUD AG

Qualitative and quantitative analysis of companies has been conducted to help clients understand the wider business environment as well as the strengths and weaknesses of key industry players. Data is qualitatively analyzed to categorize companies as pure play, category-focused, industry-focused, and diversified; it is quantitatively analyzed to categorize companies as dominant, leading, strong, tentative, and weak.

Recent Development and News in Environmental testing market

  • In August 2025, Agilent Technologies established a Center of Excellence in partnership with Georgia Tech, dedicated to advancing research in environmental health and water quality.
  • In January 2025, SGS enhanced its market position through the acquisition of RTI Laboratories, thereby expanding its specialized PFAS analysis capabilities and its North American footprint.
  • In January 2025, Agilent Technologies announced a strategic partnership with ABB Robotics to pioneer advanced laboratory automation solutions tailored for environmental testing workflows.
  • In October 2024, the United States Environmental Protection Agency commenced enforcement of new national drinking water standards for PFAS, mandating widespread compliance monitoring by public water systems.

Dive into Technavio’s robust research methodology, blending expert interviews, extensive data synthesis, and validated models for unparalleled Environmental Testing Market insights. See full methodology.

Market Scope
Page number 310
Base year 2024
Historic period 2019-2023
Forecast period 2025-2029
Growth momentum & CAGR Accelerate at a CAGR of 7.9%
Market growth 2025-2029 USD 4258.4 million
Market structure Fragmented
YoY growth 2024-2025(%) 7.1%
Key countries US, Canada, Mexico, Germany, UK, France, Italy, The Netherlands, Spain, China, Japan, India, South Korea, Australia, Indonesia, Brazil, Argentina, Chile, Saudi Arabia, UAE, South Africa, Egypt and Nigeria
Competitive landscape Leading Companies, Market Positioning of Companies, Competitive Strategies, and Industry Risks

Request Free Sample

Research Analyst Overview

  • The environmental testing market is defined by its critical role in regulatory enforcement and risk management, necessitating constant technological evolution. The use of advanced analytical instruments, including mass spectrometers and systems for gas chromatography and liquid chromatography, is now standard for precise chemical analysis.
  • A core boardroom consideration is the rising liability associated with pollutants, which has made investments in comprehensive water testing, soil testing, and air testing a strategic imperative. Firms are leveraging technologies like spectroscopy and molecular diagnostics for unparalleled accuracy.
  • The deployment of miniaturized environmental sensors and MEMS technology has proven to reduce field sampling costs by up to 25% compared to traditional methods. This shift toward in-situ analysis, supported by modern digital infrastructure, enhances capabilities in everything from PFAS analysis to microbiological testing, ensuring data integrity for critical decisions.

What are the Key Data Covered in this Environmental Testing Market Research and Growth Report?

  • What is the expected growth of the Environmental Testing Market between 2025 and 2029?

    • USD 4.26 billion, at a CAGR of 7.9%

  • What segmentation does the market report cover?

    • The report is segmented by Application (Air testing, Water testing, Soil testing), Product (Mass spectrometers, Chromatography, pH meters, Molecular spectroscopy products, TOC analyzers), Type (Temperature testing, humidity testing, climatic testing, shock and vibration testing, Others) and Geography (North America, Europe, APAC, South America, Middle East and Africa)

  • Which regions are analyzed in the report?

    • North America, Europe, APAC, South America and Middle East and Africa

  • What are the key growth drivers and market challenges?

    • Marked increase in soil contamination, High operational costs

  • Who are the major players in the Environmental Testing Market?

    • Advanced Environmental Testing and Research Lab, Alpha Analytical Inc., ALS Ltd., American Environmental Testing Laboratory LLC, AnaLabs Inc., Apal Agricultural Laboratory, AS International Corporation Ltd., AsureQuality Ltd., Bureau Veritas SA, EMSL Analytical Inc., Eurofins Scientific SE, Hydrologic Associates, Intertek Group Plc, Merieux NutriSciences Corp., Microbac Laboratories Inc., Pace Analytical Services LLC, RJ Hill Laboratories Ltd., SGS SA, Symbio Laboratories and TUV SUD AG

Market Research Insights

  • Market dynamics are increasingly shaped by the need for verifiable data to support environmental stewardship and meet stringent regulations. Adoption of automated real-time monitoring systems has led to a 30% improvement in response times for contamination events. The focus on emerging contaminants and water-related diseases is driving demand for advanced PFAS detection services and comprehensive water quality assessments.
  • This shift has seen labs that invest in specialized equipment for contaminant characterization achieve over 95% accuracy in detecting pollutants at trace levels. Furthermore, the push for sustainable land use and land restoration is supported by precise soil nutrient analysis, with firms using these services reporting a 15% increase in agricultural efficiency while ensuring compliance.

We can help! Our analysts can customize this environmental testing market research report to meet your requirements.

Get in touch

1. Executive Summary

1.1 Market overview

Executive Summary - Chart on Market Overview
Executive Summary - Data Table on Market Overview
Executive Summary - Chart on Global Market Characteristics
Executive Summary - Chart on Market by Geography
Executive Summary - Chart on Market Segmentation by Application
Executive Summary - Chart on Market Segmentation by Product
Executive Summary - Chart on Market Segmentation by Type
Executive Summary - Chart on Incremental Growth
Executive Summary - Data Table on Incremental Growth
Executive Summary - Chart on Company Market Positioning

2. Technavio Analysis

2.1 Analysis of price sensitivity, lifecycle, customer purchase basket, adoption rates, and purchase criteria

2.2 Criticality of inputs and Factors of differentiation

Chart on Overview on criticality of inputs and factors of differentiation

2.3 Factors of disruption

Chart on Overview on factors of disruption

2.4 Impact of drivers and challenges

Chart on Impact of drivers and challenges in 2024 and 2029

3. Market Landscape

3.1 Market ecosystem

Chart on Parent Market
Data Table on - Parent Market

3.2 Market characteristics

Chart on Market characteristics analysis

3.3 Value chain analysis

Chart on Value chain analysis

4. Market Sizing

4.1 Market definition

Data Table on Offerings of companies included in the market definition

4.2 Market segment analysis

Market segments

4.3 Market size 2024

4.4 Market outlook: Forecast for 2024-2029

Chart on Global - Market size and forecast 2024-2029 ($ million)
Data Table on Global - Market size and forecast 2024-2029 ($ million)
Chart on Global Market: Year-over-year growth 2024-2029 (%)
Data Table on Global Market: Year-over-year growth 2024-2029 (%)

5. Historic Market Size

5.1 Global Environmental Testing Market 2019 - 2023

Historic Market Size - Data Table on Global Environmental Testing Market 2019 - 2023 ($ million)

5.2 Application segment analysis 2019 - 2023

Historic Market Size - Application Segment 2019 - 2023 ($ million)

5.3 Product segment analysis 2019 - 2023

Historic Market Size - Product Segment 2019 - 2023 ($ million)

5.4 Type segment analysis 2019 - 2023

Historic Market Size - Type Segment 2019 - 2023 ($ million)

5.5 Geography segment analysis 2019 - 2023

Historic Market Size - Geography Segment 2019 - 2023 ($ million)

5.6 Country segment analysis 2019 - 2023

Historic Market Size - Country Segment 2019 - 2023 ($ million)

6. Qualitative Analysis

6.1 The AI impact on Global Environmental Testing Market

7. Five Forces Analysis

7.1 Five forces summary

Five forces analysis - Comparison between 2024 and 2029

7.2 Bargaining power of buyers

Bargaining power of buyers - Impact of key factors 2024 and 2029

7.3 Bargaining power of suppliers

Bargaining power of suppliers - Impact of key factors in 2024 and 2029

7.4 Threat of new entrants

Threat of new entrants - Impact of key factors in 2024 and 2029

7.5 Threat of substitutes

Threat of substitutes - Impact of key factors in 2024 and 2029

7.6 Threat of rivalry

Threat of rivalry - Impact of key factors in 2024 and 2029

7.7 Market condition

Chart on Market condition - Five forces 2024 and 2029

8. Market Segmentation by Application

8.1 Market segments

Chart on Application - Market share 2024-2029 (%)
Data Table on Application - Market share 2024-2029 (%)

8.2 Comparison by Application

Chart on Comparison by Application
Data Table on Comparison by Application

8.3 Air testing - Market size and forecast 2024-2029

Chart on Air testing - Market size and forecast 2024-2029 ($ million)
Data Table on Air testing - Market size and forecast 2024-2029 ($ million)
Chart on Air testing - Year-over-year growth 2024-2029 (%)
Data Table on Air testing - Year-over-year growth 2024-2029 (%)

8.4 Water testing - Market size and forecast 2024-2029

Chart on Water testing - Market size and forecast 2024-2029 ($ million)
Data Table on Water testing - Market size and forecast 2024-2029 ($ million)
Chart on Water testing - Year-over-year growth 2024-2029 (%)
Data Table on Water testing - Year-over-year growth 2024-2029 (%)

8.5 Soil testing - Market size and forecast 2024-2029

Chart on Soil testing - Market size and forecast 2024-2029 ($ million)
Data Table on Soil testing - Market size and forecast 2024-2029 ($ million)
Chart on Soil testing - Year-over-year growth 2024-2029 (%)
Data Table on Soil testing - Year-over-year growth 2024-2029 (%)

8.6 Market opportunity by Application

Market opportunity by Application ($ million)
Data Table on Market opportunity by Application ($ million)

9. Market Segmentation by Product

9.1 Market segments

Chart on Product - Market share 2024-2029 (%)
Data Table on Product - Market share 2024-2029 (%)

9.2 Comparison by Product

Chart on Comparison by Product
Data Table on Comparison by Product

9.3 Mass spectrometers - Market size and forecast 2024-2029

Chart on Mass spectrometers - Market size and forecast 2024-2029 ($ million)
Data Table on Mass spectrometers - Market size and forecast 2024-2029 ($ million)
Chart on Mass spectrometers - Year-over-year growth 2024-2029 (%)
Data Table on Mass spectrometers - Year-over-year growth 2024-2029 (%)

9.4 Chromatography - Market size and forecast 2024-2029

Chart on Chromatography - Market size and forecast 2024-2029 ($ million)
Data Table on Chromatography - Market size and forecast 2024-2029 ($ million)
Chart on Chromatography - Year-over-year growth 2024-2029 (%)
Data Table on Chromatography - Year-over-year growth 2024-2029 (%)

9.5 pH meters - Market size and forecast 2024-2029

Chart on pH meters - Market size and forecast 2024-2029 ($ million)
Data Table on pH meters - Market size and forecast 2024-2029 ($ million)
Chart on pH meters - Year-over-year growth 2024-2029 (%)
Data Table on pH meters - Year-over-year growth 2024-2029 (%)

9.6 Molecular spectroscopy products - Market size and forecast 2024-2029

Chart on Molecular spectroscopy products - Market size and forecast 2024-2029 ($ million)
Data Table on Molecular spectroscopy products - Market size and forecast 2024-2029 ($ million)
Chart on Molecular spectroscopy products - Year-over-year growth 2024-2029 (%)
Data Table on Molecular spectroscopy products - Year-over-year growth 2024-2029 (%)

9.7 TOC analyzers - Market size and forecast 2024-2029

Chart on TOC analyzers - Market size and forecast 2024-2029 ($ million)
Data Table on TOC analyzers - Market size and forecast 2024-2029 ($ million)
Chart on TOC analyzers - Year-over-year growth 2024-2029 (%)
Data Table on TOC analyzers - Year-over-year growth 2024-2029 (%)

9.8 Market opportunity by Product

Market opportunity by Product ($ million)
Data Table on Market opportunity by Product ($ million)

10. Market Segmentation by Type

10.1 Market segments

Chart on Type - Market share 2024-2029 (%)
Data Table on Type - Market share 2024-2029 (%)

10.2 Comparison by Type

Chart on Comparison by Type
Data Table on Comparison by Type

10.3 Temperature testing - Market size and forecast 2024-2029

Chart on Temperature testing - Market size and forecast 2024-2029 ($ million)
Data Table on Temperature testing - Market size and forecast 2024-2029 ($ million)
Chart on Temperature testing - Year-over-year growth 2024-2029 (%)
Data Table on Temperature testing - Year-over-year growth 2024-2029 (%)

10.4 Humidity testing - Market size and forecast 2024-2029

Chart on Humidity testing - Market size and forecast 2024-2029 ($ million)
Data Table on Humidity testing - Market size and forecast 2024-2029 ($ million)
Chart on Humidity testing - Year-over-year growth 2024-2029 (%)
Data Table on Humidity testing - Year-over-year growth 2024-2029 (%)

10.5 Climatic testing - Market size and forecast 2024-2029

Chart on Climatic testing - Market size and forecast 2024-2029 ($ million)
Data Table on Climatic testing - Market size and forecast 2024-2029 ($ million)
Chart on Climatic testing - Year-over-year growth 2024-2029 (%)
Data Table on Climatic testing - Year-over-year growth 2024-2029 (%)

10.6 Shock and vibration testing - Market size and forecast 2024-2029

Chart on Shock and vibration testing - Market size and forecast 2024-2029 ($ million)
Data Table on Shock and vibration testing - Market size and forecast 2024-2029 ($ million)
Chart on Shock and vibration testing - Year-over-year growth 2024-2029 (%)
Data Table on Shock and vibration testing - Year-over-year growth 2024-2029 (%)

10.7 Others - Market size and forecast 2024-2029

Chart on Others - Market size and forecast 2024-2029 ($ million)
Data Table on Others - Market size and forecast 2024-2029 ($ million)
Chart on Others - Year-over-year growth 2024-2029 (%)
Data Table on Others - Year-over-year growth 2024-2029 (%)

10.8 Market opportunity by Type

Market opportunity by Type ($ million)
Data Table on Market opportunity by Type ($ million)

11. Customer Landscape

11.1 Customer landscape overview

Analysis of price sensitivity, lifecycle, customer purchase basket, adoption rates, and purchase criteria

12. Geographic Landscape

12.1 Geographic segmentation

Chart on Market share by geography 2024-2029 (%)
Data Table on Market share by geography 2024-2029 (%)

12.2 Geographic comparison

Chart on Geographic comparison
Data Table on Geographic comparison

12.3 North America - Market size and forecast 2024-2029

Chart on North America - Market size and forecast 2024-2029 ($ million)
Data Table on North America - Market size and forecast 2024-2029 ($ million)
Chart on North America - Year-over-year growth 2024-2029 (%)
Data Table on North America - Year-over-year growth 2024-2029 (%)
Chart on Regional Comparison - North America
Data Table on Regional Comparison - North America

12.3.1 US - Market size and forecast 2024-2029

Chart on US - Market size and forecast 2024-2029 ($ million)
Data Table on US - Market size and forecast 2024-2029 ($ million)
Chart on US - Year-over-year growth 2024-2029 (%)
Data Table on US - Year-over-year growth 2024-2029 (%)

12.3.2 Canada - Market size and forecast 2024-2029

Chart on Canada - Market size and forecast 2024-2029 ($ million)
Data Table on Canada - Market size and forecast 2024-2029 ($ million)
Chart on Canada - Year-over-year growth 2024-2029 (%)
Data Table on Canada - Year-over-year growth 2024-2029 (%)

12.3.3 Mexico - Market size and forecast 2024-2029

Chart on Mexico - Market size and forecast 2024-2029 ($ million)
Data Table on Mexico - Market size and forecast 2024-2029 ($ million)
Chart on Mexico - Year-over-year growth 2024-2029 (%)
Data Table on Mexico - Year-over-year growth 2024-2029 (%)

12.4 Europe - Market size and forecast 2024-2029

Chart on Europe - Market size and forecast 2024-2029 ($ million)
Data Table on Europe - Market size and forecast 2024-2029 ($ million)
Chart on Europe - Year-over-year growth 2024-2029 (%)
Data Table on Europe - Year-over-year growth 2024-2029 (%)
Chart on Regional Comparison - Europe
Data Table on Regional Comparison - Europe

12.4.1 Germany - Market size and forecast 2024-2029

Chart on Germany - Market size and forecast 2024-2029 ($ million)
Data Table on Germany - Market size and forecast 2024-2029 ($ million)
Chart on Germany - Year-over-year growth 2024-2029 (%)
Data Table on Germany - Year-over-year growth 2024-2029 (%)

12.4.2 UK - Market size and forecast 2024-2029

Chart on UK - Market size and forecast 2024-2029 ($ million)
Data Table on UK - Market size and forecast 2024-2029 ($ million)
Chart on UK - Year-over-year growth 2024-2029 (%)
Data Table on UK - Year-over-year growth 2024-2029 (%)

12.4.3 France - Market size and forecast 2024-2029

Chart on France - Market size and forecast 2024-2029 ($ million)
Data Table on France - Market size and forecast 2024-2029 ($ million)
Chart on France - Year-over-year growth 2024-2029 (%)
Data Table on France - Year-over-year growth 2024-2029 (%)

12.4.4 Italy - Market size and forecast 2024-2029

Chart on Italy - Market size and forecast 2024-2029 ($ million)
Data Table on Italy - Market size and forecast 2024-2029 ($ million)
Chart on Italy - Year-over-year growth 2024-2029 (%)
Data Table on Italy - Year-over-year growth 2024-2029 (%)

12.4.5 The Netherlands - Market size and forecast 2024-2029

Chart on The Netherlands - Market size and forecast 2024-2029 ($ million)
Data Table on The Netherlands - Market size and forecast 2024-2029 ($ million)
Chart on The Netherlands - Year-over-year growth 2024-2029 (%)
Data Table on The Netherlands - Year-over-year growth 2024-2029 (%)

12.4.6 Spain - Market size and forecast 2024-2029

Chart on Spain - Market size and forecast 2024-2029 ($ million)
Data Table on Spain - Market size and forecast 2024-2029 ($ million)
Chart on Spain - Year-over-year growth 2024-2029 (%)
Data Table on Spain - Year-over-year growth 2024-2029 (%)

12.5 APAC - Market size and forecast 2024-2029

Chart on APAC - Market size and forecast 2024-2029 ($ million)
Data Table on APAC - Market size and forecast 2024-2029 ($ million)
Chart on APAC - Year-over-year growth 2024-2029 (%)
Data Table on APAC - Year-over-year growth 2024-2029 (%)
Chart on Regional Comparison - APAC
Data Table on Regional Comparison - APAC

12.5.1 China - Market size and forecast 2024-2029

Chart on China - Market size and forecast 2024-2029 ($ million)
Data Table on China - Market size and forecast 2024-2029 ($ million)
Chart on China - Year-over-year growth 2024-2029 (%)
Data Table on China - Year-over-year growth 2024-2029 (%)

12.5.2 Japan - Market size and forecast 2024-2029

Chart on Japan - Market size and forecast 2024-2029 ($ million)
Data Table on Japan - Market size and forecast 2024-2029 ($ million)
Chart on Japan - Year-over-year growth 2024-2029 (%)
Data Table on Japan - Year-over-year growth 2024-2029 (%)

12.5.3 India - Market size and forecast 2024-2029

Chart on India - Market size and forecast 2024-2029 ($ million)
Data Table on India - Market size and forecast 2024-2029 ($ million)
Chart on India - Year-over-year growth 2024-2029 (%)
Data Table on India - Year-over-year growth 2024-2029 (%)

12.5.4 South Korea - Market size and forecast 2024-2029

Chart on South Korea - Market size and forecast 2024-2029 ($ million)
Data Table on South Korea - Market size and forecast 2024-2029 ($ million)
Chart on South Korea - Year-over-year growth 2024-2029 (%)
Data Table on South Korea - Year-over-year growth 2024-2029 (%)

12.5.5 Australia - Market size and forecast 2024-2029

Chart on Australia - Market size and forecast 2024-2029 ($ million)
Data Table on Australia - Market size and forecast 2024-2029 ($ million)
Chart on Australia - Year-over-year growth 2024-2029 (%)
Data Table on Australia - Year-over-year growth 2024-2029 (%)

12.5.6 Indonesia - Market size and forecast 2024-2029

Chart on Indonesia - Market size and forecast 2024-2029 ($ million)
Data Table on Indonesia - Market size and forecast 2024-2029 ($ million)
Chart on Indonesia - Year-over-year growth 2024-2029 (%)
Data Table on Indonesia - Year-over-year growth 2024-2029 (%)

12.6 South America - Market size and forecast 2024-2029

Chart on South America - Market size and forecast 2024-2029 ($ million)
Data Table on South America - Market size and forecast 2024-2029 ($ million)
Chart on South America - Year-over-year growth 2024-2029 (%)
Data Table on South America - Year-over-year growth 2024-2029 (%)
Chart on Regional Comparison - South America
Data Table on Regional Comparison - South America

12.6.1 Brazil - Market size and forecast 2024-2029

Chart on Brazil - Market size and forecast 2024-2029 ($ million)
Data Table on Brazil - Market size and forecast 2024-2029 ($ million)
Chart on Brazil - Year-over-year growth 2024-2029 (%)
Data Table on Brazil - Year-over-year growth 2024-2029 (%)

12.6.2 Argentina - Market size and forecast 2024-2029

Chart on Argentina - Market size and forecast 2024-2029 ($ million)
Data Table on Argentina - Market size and forecast 2024-2029 ($ million)
Chart on Argentina - Year-over-year growth 2024-2029 (%)
Data Table on Argentina - Year-over-year growth 2024-2029 (%)

12.6.3 Chile - Market size and forecast 2024-2029

Chart on Chile - Market size and forecast 2024-2029 ($ million)
Data Table on Chile - Market size and forecast 2024-2029 ($ million)
Chart on Chile - Year-over-year growth 2024-2029 (%)
Data Table on Chile - Year-over-year growth 2024-2029 (%)

12.7 Middle East and Africa - Market size and forecast 2024-2029

Chart on Middle East and Africa - Market size and forecast 2024-2029 ($ million)
Data Table on Middle East and Africa - Market size and forecast 2024-2029 ($ million)
Chart on Middle East and Africa - Year-over-year growth 2024-2029 (%)
Data Table on Middle East and Africa - Year-over-year growth 2024-2029 (%)
Chart on Regional Comparison - Middle East and Africa
Data Table on Regional Comparison - Middle East and Africa

12.7.1 Saudi Arabia - Market size and forecast 2024-2029

Chart on Saudi Arabia - Market size and forecast 2024-2029 ($ million)
Data Table on Saudi Arabia - Market size and forecast 2024-2029 ($ million)
Chart on Saudi Arabia - Year-over-year growth 2024-2029 (%)
Data Table on Saudi Arabia - Year-over-year growth 2024-2029 (%)

12.7.2 UAE - Market size and forecast 2024-2029

Chart on UAE - Market size and forecast 2024-2029 ($ million)
Data Table on UAE - Market size and forecast 2024-2029 ($ million)
Chart on UAE - Year-over-year growth 2024-2029 (%)
Data Table on UAE - Year-over-year growth 2024-2029 (%)

12.7.3 South Africa - Market size and forecast 2024-2029

Chart on South Africa - Market size and forecast 2024-2029 ($ million)
Data Table on South Africa - Market size and forecast 2024-2029 ($ million)
Chart on South Africa - Year-over-year growth 2024-2029 (%)
Data Table on South Africa - Year-over-year growth 2024-2029 (%)

12.7.4 Egypt - Market size and forecast 2024-2029

Chart on Egypt - Market size and forecast 2024-2029 ($ million)
Data Table on Egypt - Market size and forecast 2024-2029 ($ million)
Chart on Egypt - Year-over-year growth 2024-2029 (%)
Data Table on Egypt - Year-over-year growth 2024-2029 (%)

12.7.5 Nigeria - Market size and forecast 2024-2029

Chart on Nigeria - Market size and forecast 2024-2029 ($ million)
Data Table on Nigeria - Market size and forecast 2024-2029 ($ million)
Chart on Nigeria - Year-over-year growth 2024-2029 (%)
Data Table on Nigeria - Year-over-year growth 2024-2029 (%)

12.8 Market opportunity by geography

Market opportunity by geography ($ million)
Data Tables on Market opportunity by geography ($ million)

13. Drivers, Challenges, and Opportunity

13.1 Market drivers

Marked increase in soil contamination
Occurrence of natural calamities
Deteriorating quality of water resources

13.2 Market challenges

High operational costs
Lack of accreditations
Issues faced in products used by service providers

13.3 Impact of drivers and challenges

Impact of drivers and challenges in 2024 and 2029

13.4 Market opportunities

Rise in partnerships and collaborations
Increased adoption of environmental sensors
Environmental benefits of water recycling

14. Competitive Landscape

14.1 Overview

14.2

Overview on criticality of inputs and factors of differentiation

14.3 Landscape disruption

Overview on factors of disruption

14.4 Industry risks

Impact of key risks on business

15. Competitive Analysis

15.1 Companies profiled

Companies covered

15.2 Company ranking index

15.3 Market positioning of companies

Matrix on companies position and classification

15.4 Advanced Environmental Testing and Research Lab

Advanced Environmental Testing and Research Lab - Overview
Advanced Environmental Testing and Research Lab - Product / Service
Advanced Environmental Testing and Research Lab - Key offerings
SWOT

15.5 Alpha Analytical Inc.

Alpha Analytical Inc. - Overview
Alpha Analytical Inc. - Product / Service
Alpha Analytical Inc. - Key offerings
SWOT

15.6 ALS Ltd.

ALS Ltd. - Overview
ALS Ltd. - Business segments
ALS Ltd. - Key news
ALS Ltd. - Key offerings
ALS Ltd. - Segment focus
SWOT

15.7 American Environmental Testing Laboratory LLC

American Environmental Testing Laboratory LLC - Overview
American Environmental Testing Laboratory LLC - Product / Service
American Environmental Testing Laboratory LLC - Key offerings
SWOT

15.8 AnaLabs Inc.

AnaLabs Inc. - Overview
AnaLabs Inc. - Product / Service
AnaLabs Inc. - Key offerings
SWOT

15.9 Apal Agricultural Laboratory

Apal Agricultural Laboratory - Overview
Apal Agricultural Laboratory - Product / Service
Apal Agricultural Laboratory - Key offerings
SWOT

15.10 AS International Corporation Ltd.

AS International Corporation Ltd. - Overview
AS International Corporation Ltd. - Product / Service
AS International Corporation Ltd. - Key offerings
SWOT

15.11 AsureQuality Ltd.

AsureQuality Ltd. - Overview
AsureQuality Ltd. - Product / Service
AsureQuality Ltd. - Key offerings
SWOT

15.12 Bureau Veritas SA

Bureau Veritas SA - Overview
Bureau Veritas SA - Business segments
Bureau Veritas SA - Key offerings
Bureau Veritas SA - Segment focus
SWOT

15.13 Eurofins Scientific SE

Eurofins Scientific SE - Overview
Eurofins Scientific SE - Business segments
Eurofins Scientific SE - Key offerings
Eurofins Scientific SE - Segment focus
SWOT

15.14 Intertek Group Plc

Intertek Group Plc - Overview
Intertek Group Plc - Business segments
Intertek Group Plc - Key offerings
Intertek Group Plc - Segment focus
SWOT

15.15 Merieux NutriSciences Corp.

Merieux NutriSciences Corp. - Overview
Merieux NutriSciences Corp. - Product / Service
Merieux NutriSciences Corp. - Key offerings
SWOT

15.16 Microbac Laboratories Inc.

Microbac Laboratories Inc. - Overview
Microbac Laboratories Inc. - Product / Service
Microbac Laboratories Inc. - Key offerings
SWOT

15.17 RJ Hill Laboratories Ltd.

RJ Hill Laboratories Ltd. - Overview
RJ Hill Laboratories Ltd. - Product / Service
RJ Hill Laboratories Ltd. - Key offerings
SWOT

15.18 SGS SA

SGS SA - Overview
SGS SA - Business segments
SGS SA - Key offerings
SGS SA - Segment focus
SWOT

16. Appendix

16.1 Scope of the report

Market definition
Objectives
Notes and caveats

16.2 Inclusions and exclusions checklist

Inclusions checklist
Exclusions checklist

16.3 Currency conversion rates for US$

16.4 Research methodology

16.5 Data procurement

Information sources

16.6 Data validation

16.7 Validation techniques employed for market sizing

16.8 Data synthesis

16.9 360 degree market analysis

16.10 List of abbreviations

Research Methodology

Technavio presents a detailed picture of the market by way of study, synthesis, and summation of data from multiple sources. The analysts have presented the various facets of the market with a particular focus on identifying the key industry influencers. The data thus presented is comprehensive, reliable, and the result of extensive research, both primary and secondary.

INFORMATION SOURCES

Primary sources

  • Manufacturers and suppliers
  • Channel partners
  • Industry experts
  • Strategic decision makers

Secondary sources

  • Industry journals and periodicals
  • Government data
  • Financial reports of key industry players
  • Historical data
  • Press releases

DATA ANALYSIS

Data Synthesis

  • Collation of data
  • Estimation of key figures
  • Analysis of derived insights

Data Validation

  • Triangulation with data models
  • Reference against proprietary databases
  • Corroboration with industry experts

REPORT WRITING

Qualitative

  • Market drivers
  • Market challenges
  • Market trends
  • Five forces analysis

Quantitative

  • Market size and forecast
  • Market segmentation
  • Geographical insights
  • Competitive landscape

Interested in this report?

Get your sample now to see our research methodology and insights!

Download Now

Frequently Asked Questions

Environmental Testing market growth will increase by USD 4258.4 million during 2025-2029.

The Environmental Testing market is expected to grow at a CAGR of 7.9% during 2025-2029.

Environmental Testing market is segmented by Application (Air testing, Water testing, Soil testing) Product (Mass spectrometers, Chromatography, pH meters, Molecular spectroscopy products, TOC analyzers) Type (Temperature testing, Humidity testing, Climatic testing, Shock and vibration testing, Others)

Advanced Environmental Testing and Research Lab, Alpha Analytical Inc., ALS Ltd., American Environmental Testing Laboratory LLC, AnaLabs Inc., Apal Agricultural Laboratory, AS International Corporation Ltd., AsureQuality Ltd., Bureau Veritas SA, EMSL Analytical Inc., Eurofins Scientific SE, Hydrologic Associates, Intertek Group Plc, Merieux NutriSciences Corp., Microbac Laboratories Inc., Pace Analytical Services LLC, RJ Hill Laboratories Ltd., SGS SA, Symbio Laboratories, TUV SUD AG are a few of the key vendors in the Environmental Testing market.

North America will register the highest growth rate of 34.3% among the other regions. Therefore, the Environmental Testing market in North America is expected to garner significant business opportunities for the vendors during the forecast period.

US, Canada, Mexico, Germany, UK, France, Italy, The Netherlands, Spain, China, Japan, India, South Korea, Australia, Indonesia, Brazil, Argentina, Chile, Saudi Arabia, UAE, South Africa, Egypt, Nigeria

  • Marked increase in soil contamination is the driving factor this market.

The Environmental Testing market vendors should focus on grabbing business opportunities from the Application segment as it accounted for the largest market share in the base year.