AI Agents In Enterprise Workflows Market Analysis, Size, and Forecast 2026-2030: North America (US, Canada, and Mexico), Europe (UK, Germany, and France), APAC (China, Japan, and India), South America (Brazil and Argentina), Middle East and Africa (UAE, Saudi Arabia, and South Africa), and Rest of World (ROW)

AI Agents In Enterprise Workflows Market Analysis, Size, and Forecast 2026-2030:
North America (US, Canada, and Mexico), Europe (UK, Germany, and France), APAC (China, Japan, and India), South America (Brazil and Argentina), Middle East and Africa (UAE, Saudi Arabia, and South Africa), and Rest of World (ROW)

Published: Mar 2026 293 Pages SKU: IRTNTR81355

Market Overview at a Glance

$5.76 B
Market Opportunity
47.4%
CAGR 2025 - 2030
38.5%
North America Growth
$455.5 Mn
Software segment 2024

AI Agents In Enterprise Workflows Market Size 2026-2030

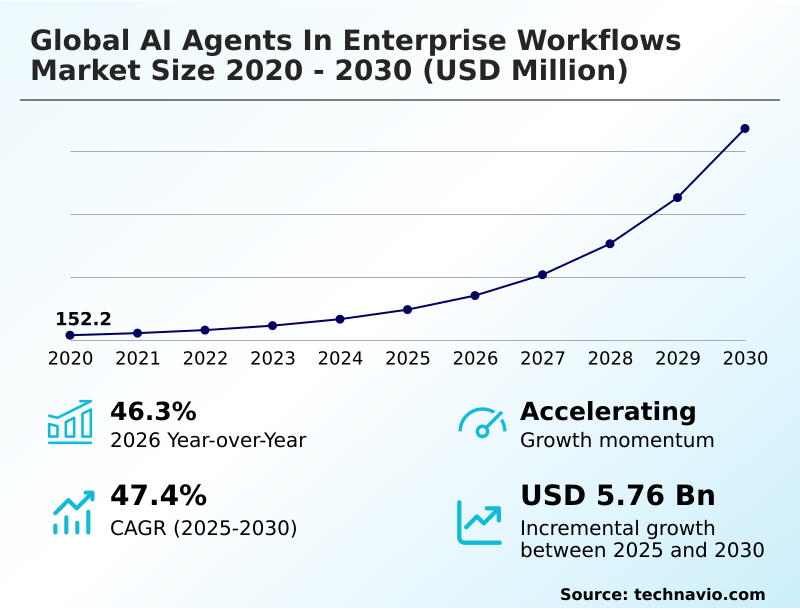
The ai agents in enterprise workflows market size is valued to increase by USD 5.76 billion, at a CAGR of 47.4% from 2025 to 2030. Transition toward autonomous agentic orchestration will drive the ai agents in enterprise workflows market.

Major Market Trends & Insights

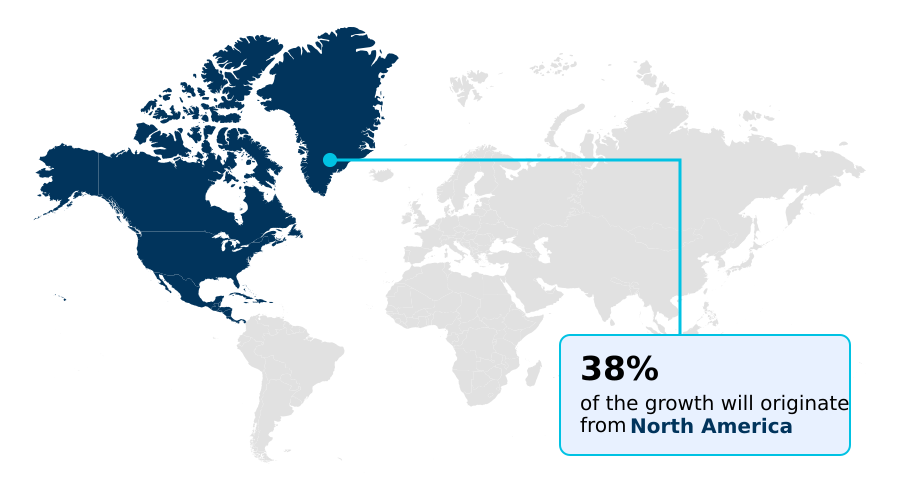
  • North America dominated the market and accounted for a 38.5% growth during the forecast period.
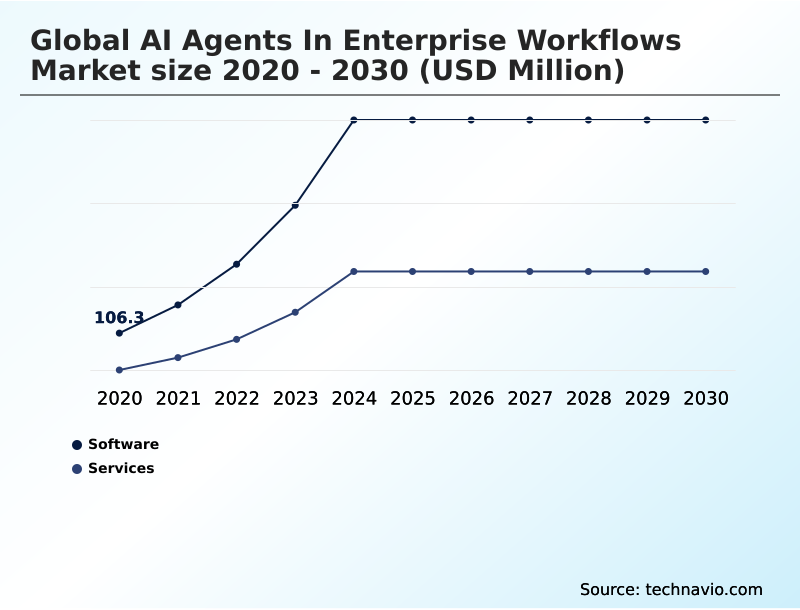
  • By Component - Software segment was valued at USD 455.5 million in 2024
  • By Deployment - Cloud based segment accounted for the largest market revenue share in 2024

Market Size & Forecast

  • Market Opportunities: USD 6.58 billion
  • Market Future Opportunities: USD 5.76 billion
  • CAGR from 2025 to 2030 : 47.4%

Market Summary

  • The AI agents in enterprise workflows market represents a significant evolution from traditional automation, leveraging advanced large language models to create autonomous systems capable of reasoning and executing complex, goal-oriented tasks. These agents are not just tools but digital colleagues, designed to manage multi-step processes across various software environments with minimal human intervention.
  • Key applications are emerging in sectors requiring high efficiency and data accuracy, such as supply chain management, where an agent can autonomously identify a logistics bottleneck, evaluate alternative shipping routes, and execute the change within the ERP system. This shift toward autonomous orchestration helps alleviate cognitive overload on employees and addresses persistent skilled labor shortages.
  • However, successful integration is contingent upon overcoming challenges related to data security, the reliability of autonomous decisions, and interoperability with fragmented legacy systems. As organizations prioritize operational resilience, the demand for intelligent agents that can provide consistent, high-quality performance in dynamic business environments continues to accelerate, defining the next frontier of enterprise productivity and strategic agility.

What will be the Size of the AI Agents In Enterprise Workflows Market during the forecast period?

Get Key Insights on Market Forecast (PDF) Request Free Sample

How is the AI Agents In Enterprise Workflows Market Segmented?

The ai agents in enterprise workflows industry research report provides comprehensive data (region-wise segment analysis), with forecasts and estimates in "USD million" for the period 2026-2030, as well as historical data from 2020-2024 for the following segments.

  • Component
    • Software
    • Services
  • Deployment
    • Cloud based
    • On premises
  • Business segment
    • Large enterprises
    • Small and medium enterprises
  • Geography
    • North America
      • US
      • Canada
      • Mexico
    • Europe
      • UK
      • Germany
      • France
    • APAC
      • China
      • Japan
      • India
    • South America
      • Brazil
      • Argentina
    • Middle East and Africa
      • UAE
      • Saudi Arabia
      • South Africa
    • Rest of World (ROW)

By Component Insights

The software segment is estimated to witness significant growth during the forecast period.

The software segment is the core of the AI agents in enterprise workflows market, providing the foundational platforms for autonomous execution. These solutions, enabled by agentic orchestration frameworks, facilitate complex enterprise workflow automation and are moving toward collaborative multi-agent systems.

Key offerings include the agent development kit for creating bespoke agents that understand enterprise context. A critical focus is on agentic governance frameworks and explainability layers to address the non-deterministic nature of AI and ensure data sovereignty.

These platforms improve process accuracy by reducing manual errors by over 30%, incorporating human-in-the-loop-at-scale for oversight and robust data leakage mitigation strategies to secure corporate assets. This evolution in agentic process automation underpins the market's strategic value.

Request Free Sample

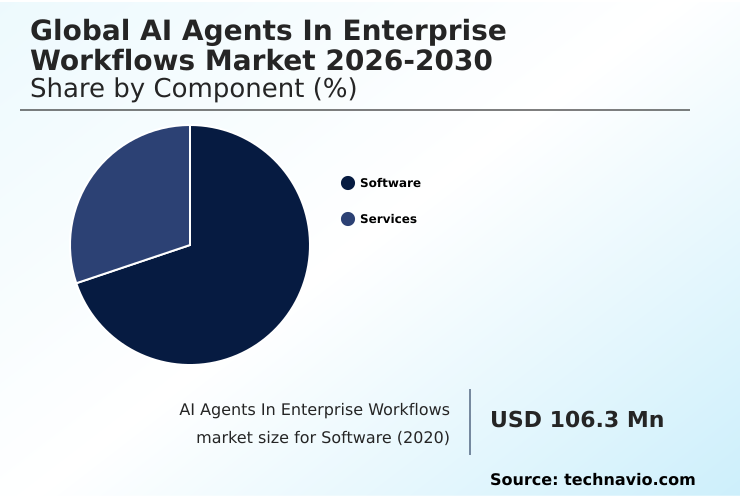
The Software segment was valued at USD 455.5 million in 2024 and showed a gradual increase during the forecast period.

Request Free Sample

Regional Analysis

North America is estimated to contribute 38.5% to the growth of the global market during the forecast period.Technavio’s analysts have elaborately explained the regional trends and drivers that shape the market during the forecast period.

See How AI Agents In Enterprise Workflows Market Demand is Rising in North America Request Free Sample

The geographic landscape is led by North America, which accounts for 38.5% of incremental growth, driven by its high concentration of technology leaders pioneering agentic frameworks and enterprise-grade AI solutions.

This region excels in developing autonomous code generation and automated quality assurance tools. APAC is the fastest-growing region, with a projected CAGR of 48.2%, as nations there rapidly adopt autonomous reasoning to enhance manufacturing and logistics.

In Europe, the focus is on data privacy and sovereign autonomous reasoning features.

Across all regions, enterprises are deploying an agentic process fabric to connect disparate systems, leveraging agents with specialized agent skills and deep enterprise context awareness to solve localized business challenges.

Market Dynamics

Our researchers analyzed the data with 2025 as the base year, along with the key drivers, trends, and challenges. A holistic analysis of drivers will help companies refine their marketing strategies to gain a competitive advantage.

  • The strategic implementation of AI agents is reshaping core business operations, moving beyond isolated tasks to full workflow orchestration. The use of AI agents for supply chain logistics is a prime example, where systems autonomously manage inventory, predict disruptions, and coordinate with suppliers, demonstrating efficiency gains of over 70% compared to manual processes.
  • In parallel, autonomous agents in financial auditing are transforming compliance by continuously monitoring transactions and identifying anomalies in real time. Building trust in autonomous agents is crucial, which is why advancements in agentic governance for data privacy and human-in-the-loop for agentic AI are paramount.
  • The ability to manage hallucinations in enterprise agents through rigorous validation is a key focus for ensuring reliability. Organizations are also leveraging AI agent interoperability standards to create cohesive ecosystems. For instance, autonomous agents for sales lead qualification can seamlessly pass information to systems managing AI agents for IT operations, ensuring a smooth customer journey.
  • This interconnectedness is critical for scaling agentic teams in enterprises. The application of computer vision for agentic automation allows interaction with legacy systems, while autonomous agents for resource management optimize workforce and asset allocation.
  • Ultimately, the successful deployment of agentic AI for operational efficiency hinges on mitigating the security risks of autonomous agents and fostering a culture that supports business process orchestration.

What are the key market drivers leading to the rise in the adoption of AI Agents In Enterprise Workflows Industry?

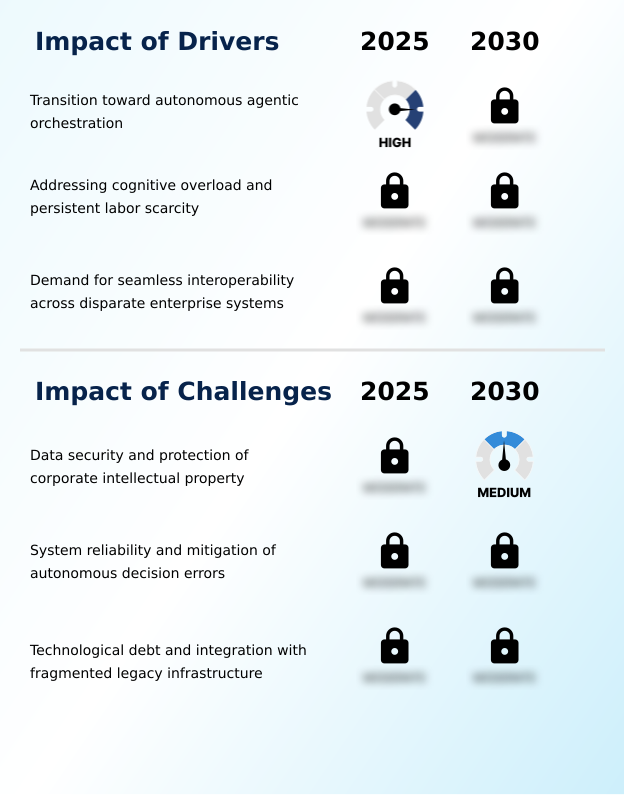
  • A key market driver is the fundamental transition from generative assistance to autonomous agentic orchestration, enabling systems to independently execute complex workflows.

  • The market is driven by the move toward autonomous agentic orchestration to manage end-to-end business functions. AI agents act as a digital colleague, alleviating employee cognitive overload from repetitive tasks, which boosts productivity by over 25%.
  • A major factor is the need for seamless interoperability across fragmented technology stacks. Agents serve as an intelligent connective tissue to create unified workflows between enterprise resource planning systems and other applications, enabling cross-platform action.
  • This automation of the cognitive middle layer enhances operational resilience. The shift towards a flexible API-driven infrastructure, supported by agent-as-a-service models, further accelerates adoption, as it allows organizations to bridge disparate systems without costly custom coding.

What are the market trends shaping the AI Agents In Enterprise Workflows Industry?

  • The market is witnessing a significant trend toward the emergence of multi-agent orchestration and collaborative ecosystems. This shift moves beyond solitary digital assistants to interconnected, specialized agents working in tandem.

  • A primary trend is the shift toward multi-agent orchestration, where specialized agents collaborate on goal-oriented task execution. This form of digital labor relies on multi-step reasoning and advanced process reasoning engine technology. The emergence of agents with computer-use capabilities allows for visual interface navigation across legacy systems, expanding automation possibilities significantly.
  • For instance, systems with these capabilities automate tasks 40% faster than API-only integrations. Concurrently, strengthening agentic governance is critical, with transparent reasoning traces and auditability features becoming standard. These reasoning traces ensure autonomous decision-making is verifiable, building trust in complex agentic process automation and multi-step task automation scenarios.

What challenges does the AI Agents In Enterprise Workflows Industry face during its growth?

  • A primary challenge affecting industry growth is ensuring robust data security and the protection of corporate intellectual property when deploying autonomous agents.

  • Significant challenges temper market adoption, primarily concerning security and reliability. The prompt injection risk poses a serious threat, as malicious inputs can lead to autonomous decision errors with severe financial consequences. Furthermore, model hallucinations remain a barrier, impacting system trustworthiness in up to 10% of complex queries without guardrails.
  • This necessitates strong human-agent collaboration and oversight, which can be managed through an agentic workforce platform. Another major obstacle is technological debt, where integrating agents with aging legacy systems is complex.
  • While solutions like a legacy agent bridge exist, they cannot fully overcome the limitations of outdated infrastructure, which affects over 50% of large enterprises, hampering the seamless deployment of an advanced agentic workforce platform.

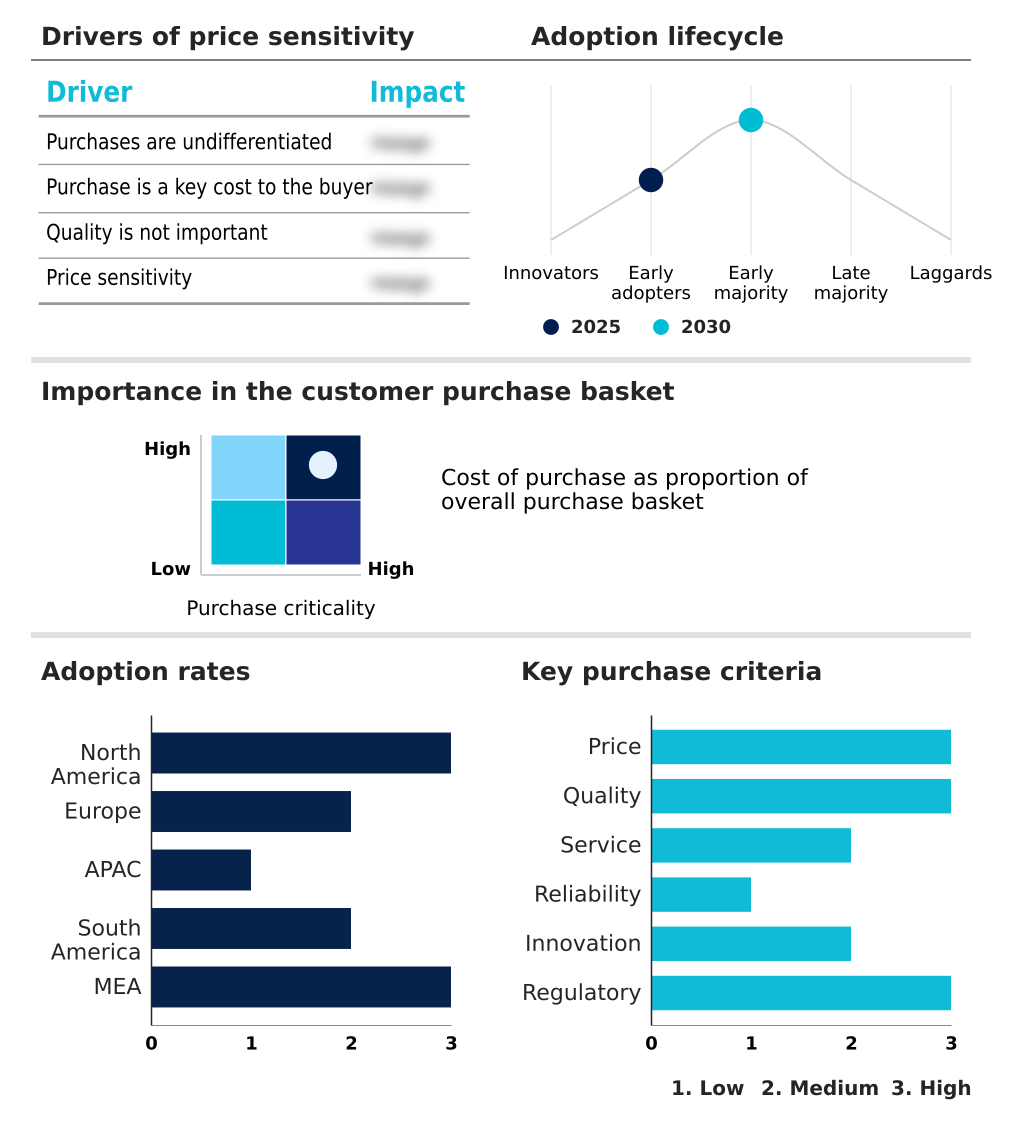
Exclusive Technavio Analysis on Customer Landscape

The ai agents in enterprise workflows market forecasting report includes the adoption lifecycle of the market, covering from the innovator’s stage to the laggard’s stage. It focuses on adoption rates in different regions based on penetration. Furthermore, the ai agents in enterprise workflows market report also includes key purchase criteria and drivers of price sensitivity to help companies evaluate and develop their market growth analysis strategies.

Customer Landscape of AI Agents In Enterprise Workflows Industry

Competitive Landscape

Companies are implementing various strategies, such as strategic alliances, ai agents in enterprise workflows market forecast, partnerships, mergers and acquisitions, geographical expansion, and product/service launches, to enhance their presence in the industry.

Amazon Web Services Inc. - Offerings center on advanced agentic frameworks and orchestration platforms, enabling autonomous execution of complex, multi-step business functions across diverse enterprise software environments.

The industry research and growth report includes detailed analyses of the competitive landscape of the market and information about key companies, including:

  • Amazon Web Services Inc.
  • Anthropic
  • Appian Corp.
  • Automation Anywhere Inc.
  • Cognigy GmbH
  • Cohere
  • Glean Technologies Inc.
  • Google LLC
  • IBM Corp.
  • Microsoft Corp.
  • NICE Ltd.
  • OpenAI OpCo LLC
  • Pegasystems Inc.
  • Salesforce Inc.
  • SAP SE
  • ServiceNow Inc.
  • UiPath Inc.
  • Workday Inc.
  • Writer
  • Zendesk Inc.

Qualitative and quantitative analysis of companies has been conducted to help clients understand the wider business environment as well as the strengths and weaknesses of key industry players. Data is qualitatively analyzed to categorize companies as pure play, category-focused, industry-focused, and diversified; it is quantitatively analyzed to categorize companies as dominant, leading, strong, tentative, and weak.

Recent Development and News in Ai agents in enterprise workflows market

  • In January 2025, OpenAI OpCo LLC announced the research preview of Operator, an autonomous tool designed to navigate and interact with desktop and web applications on a user's behalf to execute complex tasks.
  • In February 2025, Salesforce Inc. initiated a major expansion of its Agentforce platform, introducing specialized autonomous agents for sales lead qualification and independent management of complex customer service inquiries.
  • In April 2025, SAP SE launched the Legacy Agent Bridge toolkit, a suite of integration services specifically designed to connect modern autonomous agents with on-premise ERP systems that lack native cloud connectivity.
  • In May 2025, Microsoft Corp. introduced enhanced auditability features within its Copilot Studio, providing a comprehensive reasoning log for every action taken by an enterprise agent to improve transparency and governance.

Dive into Technavio’s robust research methodology, blending expert interviews, extensive data synthesis, and validated models for unparalleled AI Agents In Enterprise Workflows Market insights. See full methodology.

Market Scope
Page number 293
Base year 2025
Historic period 2020-2024
Forecast period 2026-2030
Growth momentum & CAGR Accelerate at a CAGR of 47.4%
Market growth 2026-2030 USD 5763.5 million
Market structure Fragmented
YoY growth 2025-2026(%) 46.3%
Key countries US, Canada, Mexico, UK, Germany, France, The Netherlands, Italy, Spain, China, Japan, India, South Korea, Australia, Singapore, Brazil, Argentina, Chile, UAE, Saudi Arabia, South Africa, Israel and Turkey
Competitive landscape Leading Companies, Market Positioning of Companies, Competitive Strategies, and Industry Risks

Request Free Sample

Research Analyst Overview

  • The AI agents in enterprise workflows market is defined by a strategic shift from assistive AI to autonomous execution, where agentic frameworks orchestrate complex, end-to-end business functions. This evolution is driven by the need to manage cognitive overload and achieve seamless interoperability across siloed enterprise resource planning systems.
  • The core technology enables multi-step reasoning, allowing agents to perform digital labor with minimal human intervention. A critical focus for boardroom-level strategy involves balancing the adoption of autonomous agentic orchestration with robust agentic governance to manage risks like data sovereignty and the non-deterministic nature of AI.
  • Early adopters leveraging a cohesive agentic process fabric have demonstrated a reduction in process errors by up to 40%. Success in this market depends on integrating explainability layers and ensuring the API-driven infrastructure can support multi-agent systems.
  • The development of a comprehensive agent development kit is essential for creating agents with deep enterprise context and specialized skills, ultimately enabling a more resilient and efficient agentic workforce.

What are the Key Data Covered in this AI Agents In Enterprise Workflows Market Research and Growth Report?

  • What is the expected growth of the AI Agents In Enterprise Workflows Market between 2026 and 2030?

    • USD 5.76 billion, at a CAGR of 47.4%

  • What segmentation does the market report cover?

    • The report is segmented by Component (Software, and Services), Deployment (Cloud based, and On premises), Business Segment (Large enterprises, and Small and medium enterprises) and Geography (North America, Europe, APAC, South America, Middle East and Africa)

  • Which regions are analyzed in the report?

    • North America, Europe, APAC, South America and Middle East and Africa

  • What are the key growth drivers and market challenges?

    • Transition toward autonomous agentic orchestration, Data security and protection of corporate intellectual property

  • Who are the major players in the AI Agents In Enterprise Workflows Market?

    • Amazon Web Services Inc., Anthropic, Appian Corp., Automation Anywhere Inc., Cognigy GmbH, Cohere, Glean Technologies Inc., Google LLC, IBM Corp., Microsoft Corp., NICE Ltd., OpenAI OpCo LLC, Pegasystems Inc., Salesforce Inc., SAP SE, ServiceNow Inc., UiPath Inc., Workday Inc., Writer and Zendesk Inc.

Market Research Insights

  • Market dynamics are shaped by a fundamental transition from simple assistance to autonomous execution, compelling organizations to adopt sophisticated agentic orchestration frameworks. Enterprises leveraging these frameworks report a 30% reduction in manual hand-offs between siloed departments, creating unified workflows that enhance operational resilience.
  • The use of a digital colleague to manage routine cognitive tasks has demonstrated a 15% improvement in knowledge worker productivity. This shift is driven by the urgent need for seamless interoperability across fragmented technology stacks, where agents act as an intelligent connective tissue.
  • By enabling real-time data synthesis and cross-platform action, these systems provide leadership with a holistic operational view, ensuring strategic alignment and fostering a more agile response to market changes.

We can help! Our analysts can customize this ai agents in enterprise workflows market research report to meet your requirements.

Get in touch

1. Executive Summary

1.1 Market overview

Executive Summary - Chart on Market Overview
Executive Summary - Data Table on Market Overview
Executive Summary - Chart on Global Market Characteristics
Executive Summary - Chart on Market by Geography
Executive Summary - Chart on Market Segmentation by Component
Executive Summary - Chart on Market Segmentation by Deployment
Executive Summary - Chart on Market Segmentation by Business Segment
Executive Summary - Chart on Incremental Growth
Executive Summary - Data Table on Incremental Growth
Executive Summary - Chart on Company Market Positioning

2. Technavio Analysis

2.1 Analysis of price sensitivity, lifecycle, customer purchase basket, adoption rates, and purchase criteria

2.2 Criticality of inputs and Factors of differentiation

Chart on Overview on criticality of inputs and factors of differentiation

2.3 Factors of disruption

Chart on Overview on factors of disruption

2.4 Impact of drivers and challenges

Chart on Impact of drivers and challenges in 2025 and 2030

3. Market Landscape

3.1 Market ecosystem

Chart on Parent Market
Data Table on - Parent Market

3.2 Market characteristics

Chart on Market characteristics analysis

3.3 Value chain analysis

Chart on Value chain analysis

4. Market Sizing

4.1 Market definition

Data Table on Offerings of companies included in the market definition

4.2 Market segment analysis

Market segments

4.3 Market size 2025

4.4 Market outlook: Forecast for 2025-2030

Chart on Global - Market size and forecast 2025-2030 ($ million)
Data Table on Global - Market size and forecast 2025-2030 ($ million)
Chart on Global Market: Year-over-year growth 2025-2030 (%)
Data Table on Global Market: Year-over-year growth 2025-2030 (%)

5. Historic Market Size

5.1 Global AI Agents In Enterprise Workflows Market 2020 - 2024

Historic Market Size - Data Table on Global AI Agents In Enterprise Workflows Market 2020 - 2024 ($ million)

5.2 Component segment analysis 2020 - 2024

Historic Market Size - Component Segment 2020 - 2024 ($ million)

5.3 Deployment segment analysis 2020 - 2024

Historic Market Size - Deployment Segment 2020 - 2024 ($ million)

5.4 Business segment analysis 2020 - 2024

Historic Market Size - Business Segment 2020 - 2024 ($ million)

5.5 Geography segment analysis 2020 - 2024

Historic Market Size - Geography Segment 2020 - 2024 ($ million)

5.6 Country segment analysis 2020 - 2024

Historic Market Size - Country Segment 2020 - 2024 ($ million)

6. Qualitative Analysis

6.1 The AI impact on Global AI Agents in Enterprise Workflows Market

6.2 Impact of geopolitical conflicts on Global AI Agents in Enterprise Workflows Market

7. Five Forces Analysis

7.1 Five forces summary

Five forces analysis - Comparison between 2025 and 2030

7.2 Bargaining power of buyers

Bargaining power of buyers - Impact of key factors 2025 and 2030

7.3 Bargaining power of suppliers

Bargaining power of suppliers - Impact of key factors in 2025 and 2030

7.4 Threat of new entrants

Threat of new entrants - Impact of key factors in 2025 and 2030

7.5 Threat of substitutes

Threat of substitutes - Impact of key factors in 2025 and 2030

7.6 Threat of rivalry

Threat of rivalry - Impact of key factors in 2025 and 2030

7.7 Market condition

Chart on Market condition - Five forces 2025 and 2030

8. Market Segmentation by Component

8.1 Market segments

Chart on Component - Market share 2025-2030 (%)
Data Table on Component - Market share 2025-2030 (%)

8.2 Comparison by Component

Chart on Comparison by Component
Data Table on Comparison by Component

8.3 Software - Market size and forecast 2025-2030

Chart on Software - Market size and forecast 2025-2030 ($ million)
Data Table on Software - Market size and forecast 2025-2030 ($ million)
Chart on Software - Year-over-year growth 2025-2030 (%)
Data Table on Software - Year-over-year growth 2025-2030 (%)

8.4 Services - Market size and forecast 2025-2030

Chart on Services - Market size and forecast 2025-2030 ($ million)
Data Table on Services - Market size and forecast 2025-2030 ($ million)
Chart on Services - Year-over-year growth 2025-2030 (%)
Data Table on Services - Year-over-year growth 2025-2030 (%)

8.5 Market opportunity by Component

Market opportunity by Component ($ million)
Data Table on Market opportunity by Component ($ million)

9. Market Segmentation by Deployment

9.1 Market segments

Chart on Deployment - Market share 2025-2030 (%)
Data Table on Deployment - Market share 2025-2030 (%)

9.2 Comparison by Deployment

Chart on Comparison by Deployment
Data Table on Comparison by Deployment

9.3 Cloud based - Market size and forecast 2025-2030

Chart on Cloud based - Market size and forecast 2025-2030 ($ million)
Data Table on Cloud based - Market size and forecast 2025-2030 ($ million)
Chart on Cloud based - Year-over-year growth 2025-2030 (%)
Data Table on Cloud based - Year-over-year growth 2025-2030 (%)

9.4 On premises - Market size and forecast 2025-2030

Chart on On premises - Market size and forecast 2025-2030 ($ million)
Data Table on On premises - Market size and forecast 2025-2030 ($ million)
Chart on On premises - Year-over-year growth 2025-2030 (%)
Data Table on On premises - Year-over-year growth 2025-2030 (%)

9.5 Market opportunity by Deployment

Market opportunity by Deployment ($ million)
Data Table on Market opportunity by Deployment ($ million)

10. Market Segmentation by Business Segment

10.1 Market segments

Chart on Market Segmentation by Business Segment - Market share 2025-2030 (%)
Data Table on Market Segmentation by Business Segment - Market share 2025-2030 (%)

10.2 Comparison by Market Segmentation by Business Segment

Chart on Comparison by Market Segmentation by Business Segment
Data Table on Comparison by Market Segmentation by Business Segment

10.3 Large enterprises - Market size and forecast 2025-2030

Chart on Large enterprises - Market size and forecast 2025-2030 ($ million)
Data Table on Large enterprises - Market size and forecast 2025-2030 ($ million)
Chart on Large enterprises - Year-over-year growth 2025-2030 (%)
Data Table on Large enterprises - Year-over-year growth 2025-2030 (%)

10.4 Small and medium enterprises - Market size and forecast 2025-2030

Chart on Small and medium enterprises - Market size and forecast 2025-2030 ($ million)
Data Table on Small and medium enterprises - Market size and forecast 2025-2030 ($ million)
Chart on Small and medium enterprises - Year-over-year growth 2025-2030 (%)
Data Table on Small and medium enterprises - Year-over-year growth 2025-2030 (%)

10.5 Market opportunity by Market Segmentation by Business Segment

Market opportunity by Market Segmentation by Business Segment ($ million)
Data Table on Market opportunity by Market Segmentation by Business Segment ($ million)

11. Customer Landscape

11.1 Customer landscape overview

Analysis of price sensitivity, lifecycle, customer purchase basket, adoption rates, and purchase criteria

12. Geographic Landscape

12.1 Geographic segmentation

Chart on Market share by geography 2025-2030 (%)
Data Table on Market share by geography 2025-2030 (%)

12.2 Geographic comparison

Chart on Geographic comparison
Data Table on Geographic comparison

12.3 North America - Market size and forecast 2025-2030

Chart on North America - Market size and forecast 2025-2030 ($ million)
Data Table on North America - Market size and forecast 2025-2030 ($ million)
Chart on North America - Year-over-year growth 2025-2030 (%)
Data Table on North America - Year-over-year growth 2025-2030 (%)
Chart on Regional Comparison - North America
Data Table on Regional Comparison - North America

12.3.1 US - Market size and forecast 2025-2030

Chart on US - Market size and forecast 2025-2030 ($ million)
Data Table on US - Market size and forecast 2025-2030 ($ million)
Chart on US - Year-over-year growth 2025-2030 (%)
Data Table on US - Year-over-year growth 2025-2030 (%)

12.3.2 Canada - Market size and forecast 2025-2030

Chart on Canada - Market size and forecast 2025-2030 ($ million)
Data Table on Canada - Market size and forecast 2025-2030 ($ million)
Chart on Canada - Year-over-year growth 2025-2030 (%)
Data Table on Canada - Year-over-year growth 2025-2030 (%)

12.3.3 Mexico - Market size and forecast 2025-2030

Chart on Mexico - Market size and forecast 2025-2030 ($ million)
Data Table on Mexico - Market size and forecast 2025-2030 ($ million)
Chart on Mexico - Year-over-year growth 2025-2030 (%)
Data Table on Mexico - Year-over-year growth 2025-2030 (%)

12.4 Europe - Market size and forecast 2025-2030

Chart on Europe - Market size and forecast 2025-2030 ($ million)
Data Table on Europe - Market size and forecast 2025-2030 ($ million)
Chart on Europe - Year-over-year growth 2025-2030 (%)
Data Table on Europe - Year-over-year growth 2025-2030 (%)
Chart on Regional Comparison - Europe
Data Table on Regional Comparison - Europe

12.4.1 UK - Market size and forecast 2025-2030

Chart on UK - Market size and forecast 2025-2030 ($ million)
Data Table on UK - Market size and forecast 2025-2030 ($ million)
Chart on UK - Year-over-year growth 2025-2030 (%)
Data Table on UK - Year-over-year growth 2025-2030 (%)

12.4.2 Germany - Market size and forecast 2025-2030

Chart on Germany - Market size and forecast 2025-2030 ($ million)
Data Table on Germany - Market size and forecast 2025-2030 ($ million)
Chart on Germany - Year-over-year growth 2025-2030 (%)
Data Table on Germany - Year-over-year growth 2025-2030 (%)

12.4.3 France - Market size and forecast 2025-2030

Chart on France - Market size and forecast 2025-2030 ($ million)
Data Table on France - Market size and forecast 2025-2030 ($ million)
Chart on France - Year-over-year growth 2025-2030 (%)
Data Table on France - Year-over-year growth 2025-2030 (%)

12.4.4 The Netherlands - Market size and forecast 2025-2030

Chart on The Netherlands - Market size and forecast 2025-2030 ($ million)
Data Table on The Netherlands - Market size and forecast 2025-2030 ($ million)
Chart on The Netherlands - Year-over-year growth 2025-2030 (%)
Data Table on The Netherlands - Year-over-year growth 2025-2030 (%)

12.4.5 Italy - Market size and forecast 2025-2030

Chart on Italy - Market size and forecast 2025-2030 ($ million)
Data Table on Italy - Market size and forecast 2025-2030 ($ million)
Chart on Italy - Year-over-year growth 2025-2030 (%)
Data Table on Italy - Year-over-year growth 2025-2030 (%)

12.4.6 Spain - Market size and forecast 2025-2030

Chart on Spain - Market size and forecast 2025-2030 ($ million)
Data Table on Spain - Market size and forecast 2025-2030 ($ million)
Chart on Spain - Year-over-year growth 2025-2030 (%)
Data Table on Spain - Year-over-year growth 2025-2030 (%)

12.5 APAC - Market size and forecast 2025-2030

Chart on APAC - Market size and forecast 2025-2030 ($ million)
Data Table on APAC - Market size and forecast 2025-2030 ($ million)
Chart on APAC - Year-over-year growth 2025-2030 (%)
Data Table on APAC - Year-over-year growth 2025-2030 (%)
Chart on Regional Comparison - APAC
Data Table on Regional Comparison - APAC

12.5.1 China - Market size and forecast 2025-2030

Chart on China - Market size and forecast 2025-2030 ($ million)
Data Table on China - Market size and forecast 2025-2030 ($ million)
Chart on China - Year-over-year growth 2025-2030 (%)
Data Table on China - Year-over-year growth 2025-2030 (%)

12.5.2 Japan - Market size and forecast 2025-2030

Chart on Japan - Market size and forecast 2025-2030 ($ million)
Data Table on Japan - Market size and forecast 2025-2030 ($ million)
Chart on Japan - Year-over-year growth 2025-2030 (%)
Data Table on Japan - Year-over-year growth 2025-2030 (%)

12.5.3 India - Market size and forecast 2025-2030

Chart on India - Market size and forecast 2025-2030 ($ million)
Data Table on India - Market size and forecast 2025-2030 ($ million)
Chart on India - Year-over-year growth 2025-2030 (%)
Data Table on India - Year-over-year growth 2025-2030 (%)

12.5.4 South Korea - Market size and forecast 2025-2030

Chart on South Korea - Market size and forecast 2025-2030 ($ million)
Data Table on South Korea - Market size and forecast 2025-2030 ($ million)
Chart on South Korea - Year-over-year growth 2025-2030 (%)
Data Table on South Korea - Year-over-year growth 2025-2030 (%)

12.5.5 Australia - Market size and forecast 2025-2030

Chart on Australia - Market size and forecast 2025-2030 ($ million)
Data Table on Australia - Market size and forecast 2025-2030 ($ million)
Chart on Australia - Year-over-year growth 2025-2030 (%)
Data Table on Australia - Year-over-year growth 2025-2030 (%)

12.5.6 Singapore - Market size and forecast 2025-2030

Chart on Singapore - Market size and forecast 2025-2030 ($ million)
Data Table on Singapore - Market size and forecast 2025-2030 ($ million)
Chart on Singapore - Year-over-year growth 2025-2030 (%)
Data Table on Singapore - Year-over-year growth 2025-2030 (%)

12.6 South America - Market size and forecast 2025-2030

Chart on South America - Market size and forecast 2025-2030 ($ million)
Data Table on South America - Market size and forecast 2025-2030 ($ million)
Chart on South America - Year-over-year growth 2025-2030 (%)
Data Table on South America - Year-over-year growth 2025-2030 (%)
Chart on Regional Comparison - South America
Data Table on Regional Comparison - South America

12.6.1 Brazil - Market size and forecast 2025-2030

Chart on Brazil - Market size and forecast 2025-2030 ($ million)
Data Table on Brazil - Market size and forecast 2025-2030 ($ million)
Chart on Brazil - Year-over-year growth 2025-2030 (%)
Data Table on Brazil - Year-over-year growth 2025-2030 (%)

12.6.2 Argentina - Market size and forecast 2025-2030

Chart on Argentina - Market size and forecast 2025-2030 ($ million)
Data Table on Argentina - Market size and forecast 2025-2030 ($ million)
Chart on Argentina - Year-over-year growth 2025-2030 (%)
Data Table on Argentina - Year-over-year growth 2025-2030 (%)

12.6.3 Chile - Market size and forecast 2025-2030

Chart on Chile - Market size and forecast 2025-2030 ($ million)
Data Table on Chile - Market size and forecast 2025-2030 ($ million)
Chart on Chile - Year-over-year growth 2025-2030 (%)
Data Table on Chile - Year-over-year growth 2025-2030 (%)

12.7 Middle East and Africa - Market size and forecast 2025-2030

Chart on Middle East and Africa - Market size and forecast 2025-2030 ($ million)
Data Table on Middle East and Africa - Market size and forecast 2025-2030 ($ million)
Chart on Middle East and Africa - Year-over-year growth 2025-2030 (%)
Data Table on Middle East and Africa - Year-over-year growth 2025-2030 (%)
Chart on Regional Comparison - Middle East and Africa
Data Table on Regional Comparison - Middle East and Africa

12.7.1 UAE - Market size and forecast 2025-2030

Chart on UAE - Market size and forecast 2025-2030 ($ million)
Data Table on UAE - Market size and forecast 2025-2030 ($ million)
Chart on UAE - Year-over-year growth 2025-2030 (%)
Data Table on UAE - Year-over-year growth 2025-2030 (%)

12.7.2 Saudi Arabia - Market size and forecast 2025-2030

Chart on Saudi Arabia - Market size and forecast 2025-2030 ($ million)
Data Table on Saudi Arabia - Market size and forecast 2025-2030 ($ million)
Chart on Saudi Arabia - Year-over-year growth 2025-2030 (%)
Data Table on Saudi Arabia - Year-over-year growth 2025-2030 (%)

12.7.3 South Africa - Market size and forecast 2025-2030

Chart on South Africa - Market size and forecast 2025-2030 ($ million)
Data Table on South Africa - Market size and forecast 2025-2030 ($ million)
Chart on South Africa - Year-over-year growth 2025-2030 (%)
Data Table on South Africa - Year-over-year growth 2025-2030 (%)

12.7.4 Israel - Market size and forecast 2025-2030

Chart on Israel - Market size and forecast 2025-2030 ($ million)
Data Table on Israel - Market size and forecast 2025-2030 ($ million)
Chart on Israel - Year-over-year growth 2025-2030 (%)
Data Table on Israel - Year-over-year growth 2025-2030 (%)

12.7.5 Turkey - Market size and forecast 2025-2030

Chart on Turkey - Market size and forecast 2025-2030 ($ million)
Data Table on Turkey - Market size and forecast 2025-2030 ($ million)
Chart on Turkey - Year-over-year growth 2025-2030 (%)
Data Table on Turkey - Year-over-year growth 2025-2030 (%)

12.8 Market opportunity by geography

Market opportunity by geography ($ million)
Data Tables on Market opportunity by geography ($ million)

13. Drivers, Challenges, and Opportunity

13.1 Market drivers

Transition toward autonomous agentic orchestration
Addressing cognitive overload and persistent labor scarcity
Demand for seamless interoperability across disparate enterprise systems

13.2 Market challenges

Data security and protection of corporate intellectual property
System reliability and mitigation of autonomous decision errors
Technological debt and integration with fragmented legacy infrastructure

13.3 Impact of drivers and challenges

Impact of drivers and challenges in 2025 and 2030

13.4 Market opportunities

Emergence of multi-agent orchestration and collaborative ecosystems
Advancements in agentic governance and the requirement for transparent reasoning
Integration of computer-use capabilities and visual interface navigation

14. Competitive Landscape

14.1 Overview

14.2

Overview on criticality of inputs and factors of differentiation

14.3 Landscape disruption

Overview on factors of disruption

14.4 Industry risks

Impact of key risks on business

15. Competitive Analysis

15.1 Companies profiled

Companies covered

15.2 Company ranking index

15.3 Market positioning of companies

Matrix on companies position and classification

15.4 Amazon Web Services Inc.

Amazon Web Services Inc. - Overview
Amazon Web Services Inc. - Product / Service
Amazon Web Services Inc. - Key news
Amazon Web Services Inc. - Key offerings
SWOT

15.5 Anthropic

Anthropic - Overview
Anthropic - Product / Service
Anthropic - Key offerings
SWOT

15.6 Appian Corp.

Appian Corp. - Overview
Appian Corp. - Business segments
Appian Corp. - Key offerings
Appian Corp. - Segment focus
SWOT

15.7 Automation Anywhere Inc.

Automation Anywhere Inc. - Overview
Automation Anywhere Inc. - Product / Service
Automation Anywhere Inc. - Key offerings
SWOT

15.8 Cognigy GmbH

Cognigy GmbH - Overview
Cognigy GmbH - Product / Service
Cognigy GmbH - Key offerings
SWOT

15.9 Cohere

Cohere - Overview
Cohere - Product / Service
Cohere - Key offerings
SWOT

15.10 Glean Technologies Inc.

Glean Technologies Inc. - Overview
Glean Technologies Inc. - Product / Service
Glean Technologies Inc. - Key offerings
SWOT

15.11 Google LLC

Google LLC - Overview
Google LLC - Product / Service
Google LLC - Key offerings
SWOT

15.12 IBM Corp.

IBM Corp. - Overview
IBM Corp. - Business segments
IBM Corp. - Key offerings
IBM Corp. - Segment focus
SWOT

15.13 Microsoft Corp.

Microsoft Corp. - Overview
Microsoft Corp. - Business segments
Microsoft Corp. - Key news
Microsoft Corp. - Key offerings
Microsoft Corp. - Segment focus
SWOT

15.14 NICE Ltd.

NICE Ltd. - Overview
NICE Ltd. - Business segments
NICE Ltd. - Key news
NICE Ltd. - Key offerings
NICE Ltd. - Segment focus
SWOT

15.15 OpenAI OpCo LLC

OpenAI OpCo LLC - Overview
OpenAI OpCo LLC - Product / Service
OpenAI OpCo LLC - Key offerings
SWOT

15.16 Pegasystems Inc.

Pegasystems Inc. - Overview
Pegasystems Inc. - Business segments
Pegasystems Inc. - Key offerings
Pegasystems Inc. - Segment focus
SWOT

15.17 Salesforce Inc.

Salesforce Inc. - Overview
Salesforce Inc. - Business segments
Salesforce Inc. - Key news
Salesforce Inc. - Key offerings
Salesforce Inc. - Segment focus
SWOT

15.18 SAP SE

SAP SE - Overview
SAP SE - Business segments
SAP SE - Key news
SAP SE - Key offerings
SAP SE - Segment focus
SWOT

16. Appendix

16.1 Scope of the report

Market definition
Objectives
Notes and caveats

16.2 Inclusions and exclusions checklist

Inclusions checklist
Exclusions checklist

16.3 Currency conversion rates for US$

16.4 Research methodology

16.5 Data procurement

Information sources

16.6 Data validation

16.7 Validation techniques employed for market sizing

16.8 Data synthesis

16.9 360 degree market analysis

16.10 List of abbreviations

Research Methodology

Technavio presents a detailed picture of the market by way of study, synthesis, and summation of data from multiple sources. The analysts have presented the various facets of the market with a particular focus on identifying the key industry influencers. The data thus presented is comprehensive, reliable, and the result of extensive research, both primary and secondary.

INFORMATION SOURCES

Primary sources

  • Manufacturers and suppliers
  • Channel partners
  • Industry experts
  • Strategic decision makers

Secondary sources

  • Industry journals and periodicals
  • Government data
  • Financial reports of key industry players
  • Historical data
  • Press releases

DATA ANALYSIS

Data Synthesis

  • Collation of data
  • Estimation of key figures
  • Analysis of derived insights

Data Validation

  • Triangulation with data models
  • Reference against proprietary databases
  • Corroboration with industry experts

REPORT WRITING

Qualitative

  • Market drivers
  • Market challenges
  • Market trends
  • Five forces analysis

Quantitative

  • Market size and forecast
  • Market segmentation
  • Geographical insights
  • Competitive landscape

Interested in this report?

Get your sample now to see our research methodology and insights!

Download Now

Frequently Asked Questions

AI Agents In Enterprise Workflows market growth will increase by USD 5763.5 million during 2026-2030.

The AI Agents In Enterprise Workflows market is expected to grow at a CAGR of 47.4% during 2026-2030.

AI Agents In Enterprise Workflows market is segmented by Component (Software, Services) Deployment (Cloud based, On premises) Business segment (Large enterprises, Small and medium enterprises)

Amazon Web Services Inc., Anthropic, Appian Corp., Automation Anywhere Inc., Cognigy GmbH, Cohere, Glean Technologies Inc., Google LLC, IBM Corp., Microsoft Corp., NICE Ltd., OpenAI OpCo LLC, Pegasystems Inc., Salesforce Inc., SAP SE, ServiceNow Inc., UiPath Inc., Workday Inc., Writer, Zendesk Inc. are a few of the key vendors in the AI Agents In Enterprise Workflows market.

North America will register the highest growth rate of 38.5% among the other regions. Therefore, the AI Agents In Enterprise Workflows market in North America is expected to garner significant business opportunities for the vendors during the forecast period.

US, Canada, Mexico, UK, Germany, France, The Netherlands, Italy, Spain, China, Japan, India, South Korea, Australia, Singapore, Brazil, Argentina, Chile, UAE, Saudi Arabia, South Africa, Israel, Turkey

  • Transition toward autonomous agentic orchestration is the driving factor this market.

The AI Agents In Enterprise Workflows market vendors should focus on grabbing business opportunities from the Component segment as it accounted for the largest market share in the base year.
RIA - Research AI Assistant
Ask RIA