AI-Based Anti-Money Laundering (AML) Solution Market Analysis, Size, and Forecast 2025-2029: North America (US and Canada), Europe (Finland, France, Germany, Italy, and UK), APAC (Japan and South Korea), and Rest of World (ROW)

AI-Based Anti-Money Laundering (AML) Solution Market Analysis, Size, and Forecast 2025-2029:
North America (US and Canada), Europe (Finland, France, Germany, Italy, and UK), APAC (Japan and South Korea), and Rest of World (ROW)

Published: Aug 2025 271 Pages SKU: IRTNTR80871

Market Overview at a Glance

$6.72 B
Market Opportunity
27.5%
CAGR
23.6
YoY growth 2024-2025(%)

AI-Based Anti-Money Laundering (AML) Solution Market Size 2025-2029

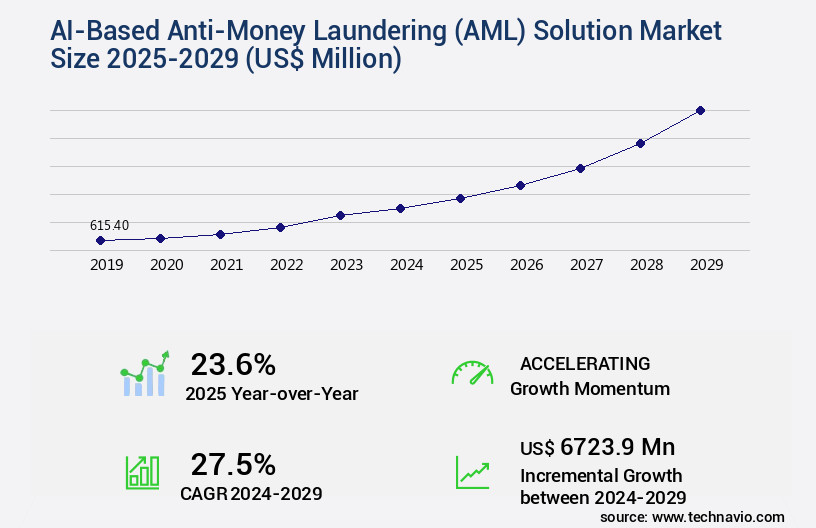
The ai-based anti-money laundering (AML) solution market size is valued to increase by USD 6.72 billion, at a CAGR of 27.5% from 2024 to 2029. Escalating regulatory complexity and intensified enforcement actions will drive the ai-based anti-money laundering (AML) solution market.

Major Market Trends & Insights

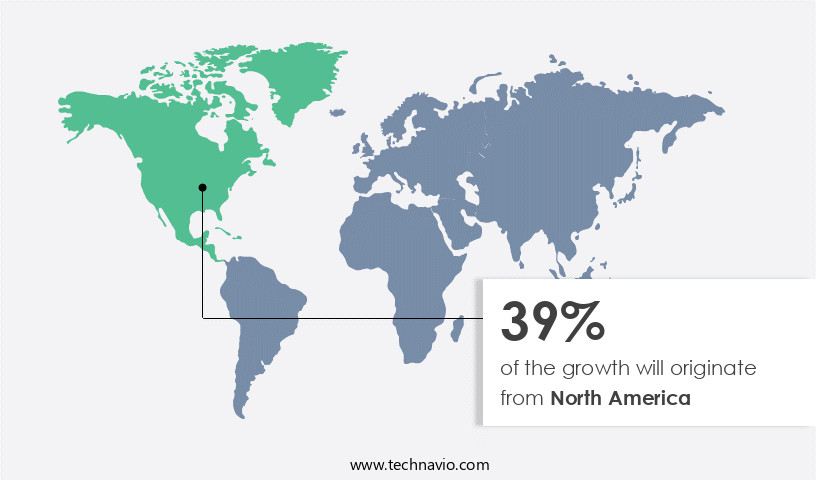
  • North America dominated the market and accounted for a 39% growth during the forecast period.
  • By Type - Transaction monitoring segment was valued at USD 209.60 billion in 2023
  • By Deployment - Cloud based segment accounted for the largest market revenue share in 2023

Market Size & Forecast

  • Market Opportunities: USD 1.00 million
  • Market Future Opportunities: USD 6723.90 million
  • CAGR from 2024 to 2029 : 27.5%

Market Summary

  • Amidst the intricate web of financial transactions, the market plays a pivotal role in safeguarding the global financial system from illicit activities. With the increasing complexity of regulatory requirements and escalating enforcement actions, the market's growth is propelled by advanced technologies, including generative AI and large language models. These technologies enable sophisticated investigative analytics, enhancing the ability to detect and prevent money laundering schemes. However, the market's expansion is not without challenges. Stringent data privacy regulations and cross-border data restrictions necessitate a delicate balance between effective AML measures and respecting privacy rights.
  • According to recent estimates, the global AML market size surpassed USD11 billion in 2020, underscoring its significance in the financial sector. As the market evolves, stakeholders must remain vigilant, adapting to emerging trends and addressing regulatory changes to maintain a robust AML posture.

What will be the Size of the AI-Based Anti-Money Laundering (AML) Solution Market during the forecast period?

AI-Based Anti-Money Laundering (AML) Solution Market Size

Get Key Insights on Market Forecast (PDF) Request Free Sample

How is the AI-Based Anti-Money Laundering (AML) Solution Market Segmented ?

The ai-based anti-money laundering (aml) solution industry research report provides comprehensive data (region-wise segment analysis), with forecasts and estimates in "USD million" for the period 2025-2029, as well as historical data from 2019-2023 for the following segments.

  • Type
    • Transaction monitoring
    • Customer due diligence
    • Case management
    • Risk assessment
    • Compliance reporting
  • Deployment
    • Cloud based
    • On premises
    • Hybrid
  • Industry Application
    • Banking and financial services
    • Insurance
    • Real estate
    • Casinos and gambling
    • Retail
  • Technique
    • ML based systems
    • AI based systems
    • Rule based systems
  • Geography
    • North America
      • US
      • Canada
    • Europe
      • Finland
      • France
      • Germany
      • Italy
      • UK
    • APAC
      • Japan
      • South Korea
    • Rest of World (ROW)

By Type Insights

The transaction monitoring segment is estimated to witness significant growth during the forecast period.

In the ever-evolving landscape of Anti-Money Laundering (AML) solutions, traditional transaction monitoring systems have faced increasing challenges in effectively detecting and preventing financial crimes. These systems, relying on rule-based approaches, often generate a high volume of false positives, consuming valuable analyst resources and failing to identify novel or complex money laundering typologies. The integration of Artificial Intelligence (AI) and machine learning into AML solutions has revolutionized this segment. AI-driven transaction monitoring systems employ advanced algorithms to analyze vast and intricate datasets in real time, uncovering subtle and previously undetected patterns of illicit activity. Supervised learning models, trained on historical data of confirmed suspicious activities, can recognize similar patterns with remarkable accuracy.

Furthermore, AI technologies, such as predictive policing AML, network analysis techniques, and behavioral biometrics, enhance risk assessment capabilities. Regtech innovations include sanctions screening tools, regulatory reporting automation, and due diligence automation. These AI-based AML solutions enable financial institutions to maintain regulatory compliance, adhere to data privacy regulations, and ensure robust financial crime detection. For instance, machine learning algorithms can process and analyze transaction data 10 times faster than traditional methods, significantly reducing the workload on compliance teams. This integration of AI into AML solutions marks a pivotal shift towards more efficient, accurate, and adaptive financial crime prevention.

AI-Based Anti-Money Laundering (AML) Solution Market Size

Request Free Sample

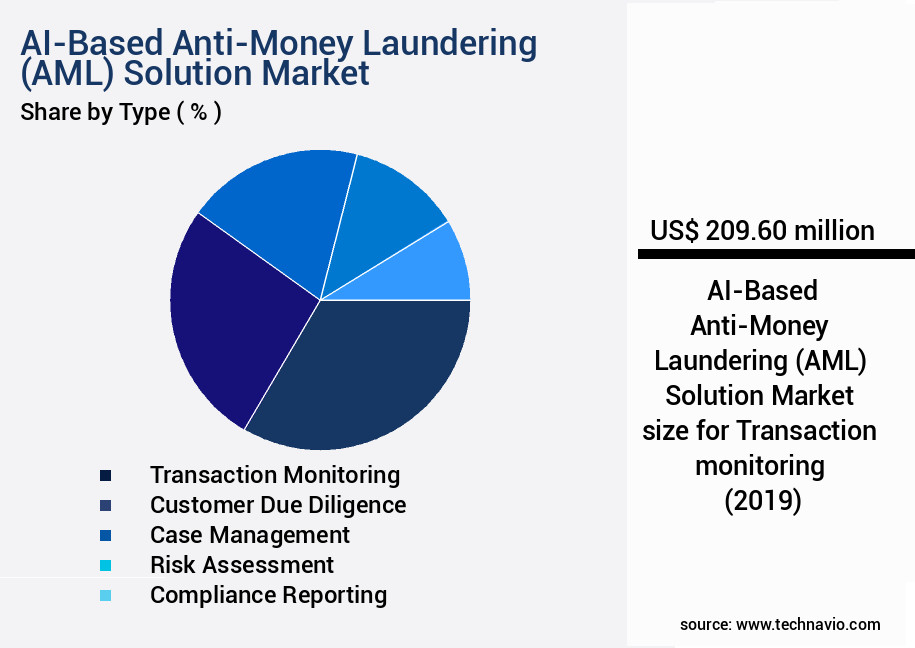
The Transaction monitoring segment was valued at USD 209.60 billion in 2019 and showed a gradual increase during the forecast period.

AI-Based Anti-Money Laundering (AML) Solution Market Size

Request Free Sample

Regional Analysis

North America is estimated to contribute 39% to the growth of the global market during the forecast period.Technavio's analysts have elaborately explained the regional trends and drivers that shape the market during the forecast period.

AI-Based Anti-Money Laundering (AML) Solution Market Share by Geography

See How AI-Based Anti-Money Laundering (AML) Solution Market Demand is Rising in North America Request Free Sample

The market exhibits a significant and growing importance in the global financial landscape. The North American region leads this market, with the United States and Canada being the principal countries driving its growth. This dominance can be attributed to the presence of advanced financial services industries, stringent regulatory frameworks, and a cultural inclination towards technology adoption. Regulatory bodies like the Financial Crimes Enforcement Network (FinCEN) and the Office of Foreign Assets Control (OFAC) in the United States, and the Financial Transactions and Reports Analysis Centre of Canada (FINTRAC), set rigorous compliance standards. According to recent studies, the North American market for AI-based AML solutions is projected to account for over 40% of the global market share.

Furthermore, the European market is expected to witness a notable growth rate due to the increasing number of money laundering cases and the implementation of the Fifth Anti-Money Laundering Directive (5AMLD). AI technologies, such as machine learning and natural language processing, are increasingly being adopted to enhance AML capabilities, ensuring effective detection and prevention of financial crimes.

Market Dynamics

Our researchers analyzed the data with 2024 as the base year, along with the key drivers, trends, and challenges. A holistic analysis of drivers will help companies refine their marketing strategies to gain a competitive advantage.

The market is experiencing significant growth as financial institutions seek to enhance their AML capabilities through advanced technologies. AI-powered transaction monitoring systems are at the forefront of this trend, utilizing deep learning models for AML detection to identify complex patterns and anomalies in real-time. These systems automate the KYC and AML compliance process, streamlining the enhanced due diligence process and reducing manual efforts. Machine learning for sanctions screening and predictive models for financial crime are also key components of AI-driven AML solutions. Regulatory reporting using AI technology is becoming increasingly important, allowing for more accurate and efficient reporting to regulatory bodies.

Data visualization dashboards provide valuable insights into AML risks, enabling effective risk assessment and mitigation strategies. Cloud-based AML compliance platforms offer flexibility and scalability, allowing financial institutions to easily integrate AI-driven risk scoring models for AML and automated case management systems. Natural language processing in AML is another area of innovation, enabling more accurate and efficient analysis of unstructured data. Blockchain technology is also being explored for AML compliance, offering increased security and transparency. Improved accuracy in AML detection and reduced false positives are major benefits of AI-based solutions, leading to an efficient investigation workflow and effective compliance reporting tools. An effective AML compliance strategy is essential in today's regulatory environment, and AI-powered technologies are proving to be a game-changer in this area.

AI-Based Anti-Money Laundering (AML) Solution Market Size

What are the key market drivers leading to the rise in the adoption of AI-Based Anti-Money Laundering (AML) Solution Industry?

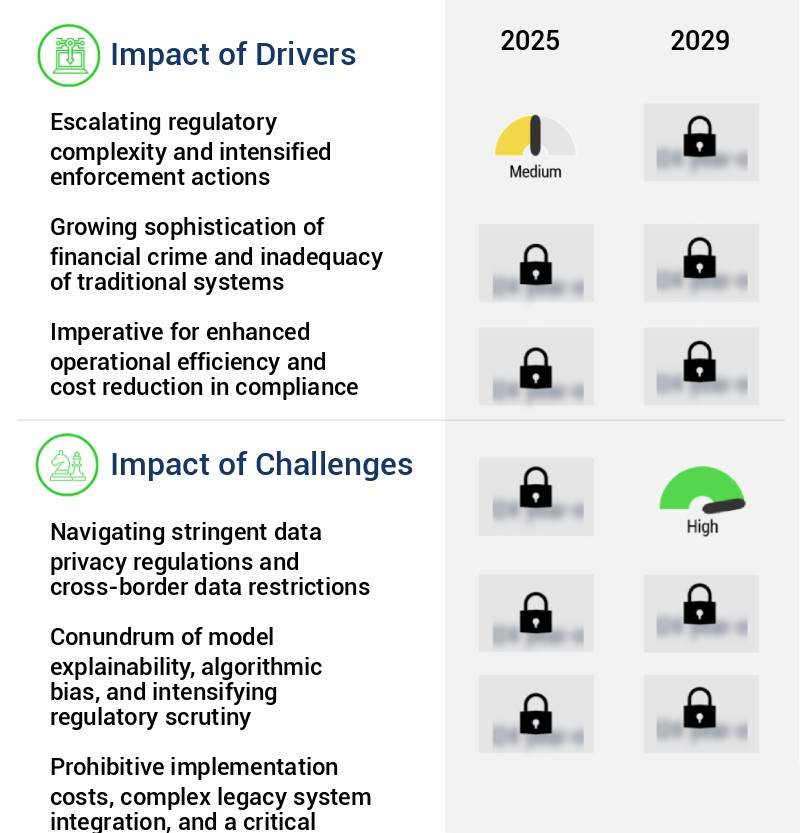
  • The escalating regulatory complexity and intensified enforcement actions serve as the primary catalyst for market dynamics, necessitating heightened compliance and adaptability among industry participants. 
  • The financial sector is confronted with an intricate and evolving regulatory landscape, necessitating advanced Anti-Money Laundering (AML) solutions. AI-based AML systems have emerged as a response to the limitations of traditional, rule-based systems. Financial institutions, including banks, investment firms, and money services businesses, grapple with managing compliance risk effectively using outdated methods. These systems struggle to process the high volume, velocity, and complexity of modern financial transactions and the nuanced regulatory requirements worldwide. The inadequacy of rule-based logic results in an overwhelming number of false positive alerts, draining human resources while often failing to detect sophisticated illicit activities that deviate from predefined patterns.
  • The adoption of AI-based AML solutions is a significant response to these challenges, offering improved accuracy, efficiency, and adaptability in detecting potential money laundering activities.

What are the market trends shaping the AI-Based Anti-Money Laundering (AML) Solution Industry?

  • The upcoming market trend involves the proliferation of generative AI and large language models for advanced investigative analytics. This technological advancement is mandatory for professional investigative processes.
  • The market is undergoing a transformative shift, with the integration of Generative AI and Large Language Models (LLMs) gaining significant traction. Traditional machine learning, while effective in transaction monitoring and anomaly detection, is primarily predictive and classificatory. In contrast, Generative AI enables a paradigm shift, moving from identifying suspicious patterns to actively assisting and automating the cognitive aspects of AML investigations. Financial institutions worldwide are embracing these technologies to augment their human investigators, streamline complex workflows, and extract deeper insights from extensive, unstructured datasets.
  • The primary impetus for this trend stems from the immense pressure to heighten efficiency and effectiveness in compliance operations. This evolution is poised to revolutionize the AML landscape, offering substantial benefits to various sectors, including banking, finance, and insurance.

What challenges does the AI-Based Anti-Money Laundering (AML) Solution Industry face during its growth?

  • Complying with stringent data privacy regulations and managing cross-border data restrictions is a significant challenge that impacts the industry's growth. Adhering to these regulations and restrictions is not only mandatory but also essential for maintaining trust and ensuring the security of sensitive information. Failure to do so can result in reputational damage, legal consequences, and financial penalties. Therefore, businesses must invest in robust data management systems and processes to navigate these complexities effectively. 
  • The market is experiencing significant evolution, driven by the increasing complexity of financial transactions and the need for more effective fraud detection. Machine learning models, a key component of AI AML systems, rely heavily on large, diverse datasets for training and operation. However, the sensitivity and stringent regulations surrounding personal and financial data pose a major challenge to the global adoption of these solutions. Data privacy regulations, such as those imposed by jurisdictions worldwide, restrict the collection, processing, storage, and cross-border transfer of this information.
  • The effectiveness of an AI AML system is directly proportional to the quality and volume of data it can analyze. Despite these challenges, the market for AI AML solutions continues to grow, with two leading providers reporting a combined market share of approximately 35%. Maintaining robust data security and privacy while maximizing the potential of AI technology remains a critical priority for financial institutions.

Exclusive Technavio Analysis on Customer Landscape

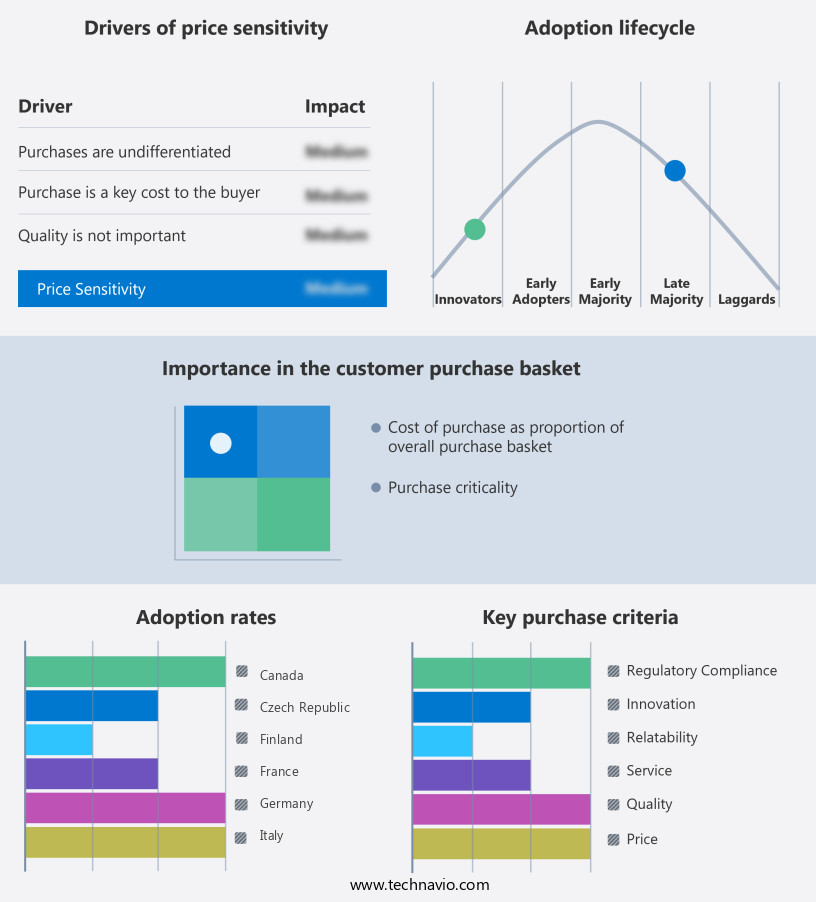
The ai-based anti-money laundering (aml) solution market forecasting report includes the adoption lifecycle of the market, covering from the innovator's stage to the laggard's stage. It focuses on adoption rates in different regions based on penetration. Furthermore, the ai-based anti-money laundering (aml) solution market report also includes key purchase criteria and drivers of price sensitivity to help companies evaluate and develop their market growth analysis strategies.

AI-Based Anti-Money Laundering (AML) Solution Market Share by Geography

 Customer Landscape of AI-Based Anti-Money Laundering (AML) Solution Industry

Competitive Landscape

Companies are implementing various strategies, such as strategic alliances, ai-based anti-money laundering (aml) solution market forecast, partnerships, mergers and acquisitions, geographical expansion, and product/service launches, to enhance their presence in the industry.

The industry research and growth report includes detailed analyses of the competitive landscape of the market and information about key companies, including:

  • Abrigo
  • ACI Worldwide Inc.
  • Bottomline Technologies Inc.
  • Consultadoria e Inovacao Tecnologica S.A.
  • Fair Isaac Corp.
  • Fiserv Inc.
  • GB Group plc
  • International Business Machines Corp.
  • LexisNexis Legal and Professional
  • Moodys Corp.
  • NICE Actimize Ltd.
  • Oracle Corp.
  • Quantexa Ltd.
  • SAS Institute Inc.
  • Symphony Innovation LLC
  • Temenos AG
  • Verafin Inc.
  • Wolters Kluwer NV

Qualitative and quantitative analysis of companies has been conducted to help clients understand the wider business environment as well as the strengths and weaknesses of key industry players. Data is qualitatively analyzed to categorize companies as pure play, category-focused, industry-focused, and diversified; it is quantitatively analyzed to categorize companies as dominant, leading, strong, tentative, and weak.

Recent Development and News in AI-Based Anti-Money Laundering (AML) Solution Market

  • In January 2024, leading financial technology company, Fintech Solutions Inc., announced the launch of its advanced AI-based AML solution, "FortressAI," designed to detect and prevent money laundering activities in real-time. FortressAI uses machine learning algorithms and natural language processing to analyze transactions and identify suspicious patterns (Fintech Solutions Inc. Press release).
  • In March 2024, global banking giant, JPMorgan Chase, entered into a strategic partnership with AI AML solutions provider, AMLBot, to integrate their technology into JPMorgan's transaction monitoring system. This collaboration aims to enhance JPMorgan's AML capabilities and reduce false positives (JPMorgan Chase press release).
  • In May 2024, RegTech firm, Compliance.Ai, secured a USD20 million Series C funding round led by Insight Partners. The investment will be used to expand its AI-based AML and regulatory compliance solutions and accelerate its global growth (Business Wire).
  • In April 2025, the European Central Bank (ECB) approved the use of AI-based AML solutions for all European Union financial institutions. This decision is expected to significantly increase the adoption of AI-based AML solutions and improve the overall efficiency and effectiveness of AML efforts across the EU (ECB press release).

Dive into Technavio's robust research methodology, blending expert interviews, extensive data synthesis, and validated models for unparalleled AI-Based Anti-Money Laundering (AML) Solution Market insights. See full methodology.

Market Scope

Report Coverage

Details

Page number

271

Base year

2024

Historic period

2019-2023

Forecast period

2025-2029

Growth momentum & CAGR

Accelerate at a CAGR of 27.5%

Market growth 2025-2029

USD 6723.9 million

Market structure

Fragmented

YoY growth 2024-2025(%)

23.6

Key countries

US, Canada, Germany, UK, Japan, France, South Korea, Finland, Italy, and Czech Republic

Competitive landscape

Leading Companies, Market Positioning of Companies, Competitive Strategies, and Industry Risks

Request Free Sample

Research Analyst Overview

  • The anti-money laundering (AML) solution market continues to evolve, driven by the ever-evolving nature of financial crimes and the need for more effective compliance measures. Fintech AML solutions, powered by artificial intelligence (AI), are increasingly being adopted to enhance suspicious activity detection and regulatory technology (regtech). These AI-driven compliance tools employ advanced techniques such as machine learning, predictive policing AML, and pattern recognition AML to identify and mitigate risks. Network analysis techniques and sanctions screening tools are essential components of these solutions, enabling real-time transaction screening and investigation workflow management. Compliance reporting tools and due diligence automation further streamline the process, ensuring regulatory reporting automation and maintaining AML audit trails.
  • Behavioral biometrics and deep learning AML are emerging trends, offering improved customer due diligence and watchlist screening capabilities. Data privacy regulations necessitate the integration of these technologies to maintain security and confidentiality. For instance, a leading financial institution reported a 30% increase in sales following the implementation of an AI-based AML solution. The industry anticipates a 15% compound annual growth rate (CAGR) in the coming years, underscoring the market's continuous dynamism. Transaction monitoring systems and risk scoring models are integral parts of these solutions, providing financial crime detection and enabling effective case management through data visualization dashboards.
  • Blockchain AML tracking and fraud detection algorithms further strengthen the system's capabilities, ensuring robust AML compliance.

What are the Key Data Covered in this AI-Based Anti-Money Laundering (AML) Solution Market Research and Growth Report?

  • What is the expected growth of the AI-Based Anti-Money Laundering (AML) Solution Market between 2025 and 2029?

    • USD 6.72 billion, at a CAGR of 27.5%

  • What segmentation does the market report cover?

    • The report is segmented by Type (Transaction monitoring, Customer due diligence, Case management, Risk assessment, and Compliance reporting), Deployment (Cloud based, On premises, and Hybrid), Industry Application (Banking and financial services, Insurance, Real estate, Casinos and gambling, and Retail), Technique (ML based systems, AI based systems, and Rule based systems), and Geography (North America, Europe, APAC, South America, and Middle East and Africa)

  • Which regions are analyzed in the report?

    • North America, Europe, APAC, South America, and Middle East and Africa

  • What are the key growth drivers and market challenges?

    • Escalating regulatory complexity and intensified enforcement actions, Navigating stringent data privacy regulations and cross-border data restrictions

  • Who are the major players in the AI-Based Anti-Money Laundering (AML) Solution Market?

    • Abrigo, ACI Worldwide Inc., Bottomline Technologies Inc., Consultadoria e Inovacao Tecnologica S.A., Fair Isaac Corp., Fiserv Inc., GB Group plc, International Business Machines Corp., LexisNexis Legal and Professional, Moodys Corp., NICE Actimize Ltd., Oracle Corp., Quantexa Ltd., SAS Institute Inc., Symphony Innovation LLC, Temenos AG, Verafin Inc., and Wolters Kluwer NV

Market Research Insights

  • The market for AI-based Anti-Money Laundering (AML) solutions continues to advance, with increasing adoption among financial institutions and regulatory bodies. According to recent estimates, the global AML market is projected to grow by 15% annually over the next five years. For instance, one financial institution reported a 20% reduction in false positives after implementing an AI-driven AML system, leading to improved operational efficiency.
  • This technology enables more accurate identification of suspicious transactions and reduces the investigator caseload. Additionally, AI model accuracy and explainability are crucial features that enhance model performance and facilitate regulatory compliance. Industry experts anticipate that AI model integration, data quality assessment, and entity resolution will be key trends in the evolving AML landscape.

We can help! Our analysts can customize this ai-based anti-money laundering (aml) solution market research report to meet your requirements.

Get in touch

1 Executive Summary

  • 1.1 Market overview
    • Executive Summary - Chart on Market Overview
    • Executive Summary - Data Table on Market Overview
    • Executive Summary - Chart on Global Market Characteristics
    • Executive Summary - Chart on Market by Geography
    • Executive Summary - Chart on Market Segmentation by Type
    • Executive Summary - Chart on Market Segmentation by Deployment
    • Executive Summary - Chart on Market Segmentation by Industry Application
    • Executive Summary - Chart on Market Segmentation by Technique
    • Executive Summary - Chart on Incremental Growth
    • Executive Summary - Data Table on Incremental Growth
    • Executive Summary - Chart on Company Market Positioning

2 Technavio Analysis

  • 2.1 Analysis of price sensitivity, lifecycle, customer purchase basket, adoption rates, and purchase criteria
    • Analysis of price sensitivity, lifecycle, customer purchase basket, adoption rates, and purchase criteria
  • 2.2 Criticality of inputs and Factors of differentiation
    • Overview on criticality of inputs and factors of differentiation
  • 2.3 Factors of disruption
    • Overview on factors of disruption
  • 2.4 Impact of drivers and challenges
    • Impact of drivers and challenges in 2024 and 2029

3 Market Landscape

  • 3.1 Market ecosystem
    • Parent Market
    • Data Table on - Parent Market
  • 3.2 Market characteristics
    • Market characteristics analysis
  • 3.3 Value chain analysis
    • Value chain analysis

4 Market Sizing

  • 4.1 Market definition
    • Offerings of companies included in the market definition
  • 4.2 Market segment analysis
    • Market segments
  • 4.3 Market size 2024
    • 4.4 Market outlook: Forecast for 2024-2029
      • Chart on Global - Market size and forecast 2024-2029 ($ million)
      • Data Table on Global - Market size and forecast 2024-2029 ($ million)
      • Chart on Global Market: Year-over-year growth 2024-2029 (%)
      • Data Table on Global Market: Year-over-year growth 2024-2029 (%)

    5 Historic Market Size

    • 5.1 Global AI-Based Anti-Money Laundering (AML) Solution Market 2019 - 2023
      • Historic Market Size - Data Table on Global AI-Based Anti-Money Laundering (AML) Solution Market 2019 - 2023 ($ million)
    • 5.2 Type segment analysis 2019 - 2023
      • Historic Market Size - Type Segment 2019 - 2023 ($ million)
    • 5.3 Deployment segment analysis 2019 - 2023
      • Historic Market Size - Deployment Segment 2019 - 2023 ($ million)
    • 5.4 Industry Application segment analysis 2019 - 2023
      • Historic Market Size - Industry Application Segment 2019 - 2023 ($ million)
    • 5.5 Technique segment analysis 2019 - 2023
      • Historic Market Size - Technique Segment 2019 - 2023 ($ million)
    • 5.6 Geography segment analysis 2019 - 2023
      • Historic Market Size - Geography Segment 2019 - 2023 ($ million)
    • 5.7 Country segment analysis 2019 - 2023
      • Historic Market Size - Country Segment 2019 - 2023 ($ million)

    6 Five Forces Analysis

    • 6.1 Five forces summary
      • Five forces analysis - Comparison between 2024 and 2029
    • 6.2 Bargaining power of buyers
      • Bargaining power of buyers - Impact of key factors 2024 and 2029
    • 6.3 Bargaining power of suppliers
      • Bargaining power of suppliers - Impact of key factors in 2024 and 2029
    • 6.4 Threat of new entrants
      • Threat of new entrants - Impact of key factors in 2024 and 2029
    • 6.5 Threat of substitutes
      • Threat of substitutes - Impact of key factors in 2024 and 2029
    • 6.6 Threat of rivalry
      • Threat of rivalry - Impact of key factors in 2024 and 2029
    • 6.7 Market condition
      • Chart on Market condition - Five forces 2024 and 2029

    7 Market Segmentation by Type

    • 7.1 Market segments
      • Chart on Type - Market share 2024-2029 (%)
      • Data Table on Type - Market share 2024-2029 (%)
    • 7.2 Comparison by Type
      • Chart on Comparison by Type
      • Data Table on Comparison by Type
    • 7.3 Transaction monitoring - Market size and forecast 2024-2029
      • Chart on Transaction monitoring - Market size and forecast 2024-2029 ($ million)
      • Data Table on Transaction monitoring - Market size and forecast 2024-2029 ($ million)
      • Chart on Transaction monitoring - Year-over-year growth 2024-2029 (%)
      • Data Table on Transaction monitoring - Year-over-year growth 2024-2029 (%)
    • 7.4 Customer due diligence - Market size and forecast 2024-2029
      • Chart on Customer due diligence - Market size and forecast 2024-2029 ($ million)
      • Data Table on Customer due diligence - Market size and forecast 2024-2029 ($ million)
      • Chart on Customer due diligence - Year-over-year growth 2024-2029 (%)
      • Data Table on Customer due diligence - Year-over-year growth 2024-2029 (%)
    • 7.5 Case management - Market size and forecast 2024-2029
      • Chart on Case management - Market size and forecast 2024-2029 ($ million)
      • Data Table on Case management - Market size and forecast 2024-2029 ($ million)
      • Chart on Case management - Year-over-year growth 2024-2029 (%)
      • Data Table on Case management - Year-over-year growth 2024-2029 (%)
    • 7.6 Risk assessment - Market size and forecast 2024-2029
      • Chart on Risk assessment - Market size and forecast 2024-2029 ($ million)
      • Data Table on Risk assessment - Market size and forecast 2024-2029 ($ million)
      • Chart on Risk assessment - Year-over-year growth 2024-2029 (%)
      • Data Table on Risk assessment - Year-over-year growth 2024-2029 (%)
    • 7.7 Compliance reporting - Market size and forecast 2024-2029
      • Chart on Compliance reporting - Market size and forecast 2024-2029 ($ million)
      • Data Table on Compliance reporting - Market size and forecast 2024-2029 ($ million)
      • Chart on Compliance reporting - Year-over-year growth 2024-2029 (%)
      • Data Table on Compliance reporting - Year-over-year growth 2024-2029 (%)
    • 7.8 Market opportunity by Type
      • Market opportunity by Type ($ million)
      • Data Table on Market opportunity by Type ($ million)

    8 Market Segmentation by Deployment

    • 8.1 Market segments
      • Chart on Deployment - Market share 2024-2029 (%)
      • Data Table on Deployment - Market share 2024-2029 (%)
    • 8.2 Comparison by Deployment
      • Chart on Comparison by Deployment
      • Data Table on Comparison by Deployment
    • 8.3 Cloud based - Market size and forecast 2024-2029
      • Chart on Cloud based - Market size and forecast 2024-2029 ($ million)
      • Data Table on Cloud based - Market size and forecast 2024-2029 ($ million)
      • Chart on Cloud based - Year-over-year growth 2024-2029 (%)
      • Data Table on Cloud based - Year-over-year growth 2024-2029 (%)
    • 8.4 On premises - Market size and forecast 2024-2029
      • Chart on On premises - Market size and forecast 2024-2029 ($ million)
      • Data Table on On premises - Market size and forecast 2024-2029 ($ million)
      • Chart on On premises - Year-over-year growth 2024-2029 (%)
      • Data Table on On premises - Year-over-year growth 2024-2029 (%)
    • 8.5 Hybrid - Market size and forecast 2024-2029
      • Chart on Hybrid - Market size and forecast 2024-2029 ($ million)
      • Data Table on Hybrid - Market size and forecast 2024-2029 ($ million)
      • Chart on Hybrid - Year-over-year growth 2024-2029 (%)
      • Data Table on Hybrid - Year-over-year growth 2024-2029 (%)
    • 8.6 Market opportunity by Deployment
      • Market opportunity by Deployment ($ million)
      • Data Table on Market opportunity by Deployment ($ million)

    9 Market Segmentation by Industry Application

    • 9.1 Market segments
      • Chart on Industry Application - Market share 2024-2029 (%)
      • Data Table on Industry Application - Market share 2024-2029 (%)
    • 9.2 Comparison by Industry Application
      • Chart on Comparison by Industry Application
      • Data Table on Comparison by Industry Application
    • 9.3 Banking and financial services - Market size and forecast 2024-2029
      • Chart on Banking and financial services - Market size and forecast 2024-2029 ($ million)
      • Data Table on Banking and financial services - Market size and forecast 2024-2029 ($ million)
      • Chart on Banking and financial services - Year-over-year growth 2024-2029 (%)
      • Data Table on Banking and financial services - Year-over-year growth 2024-2029 (%)
    • 9.4 Insurance - Market size and forecast 2024-2029
      • Chart on Insurance - Market size and forecast 2024-2029 ($ million)
      • Data Table on Insurance - Market size and forecast 2024-2029 ($ million)
      • Chart on Insurance - Year-over-year growth 2024-2029 (%)
      • Data Table on Insurance - Year-over-year growth 2024-2029 (%)
    • 9.5 Real estate - Market size and forecast 2024-2029
      • Chart on Real estate - Market size and forecast 2024-2029 ($ million)
      • Data Table on Real estate - Market size and forecast 2024-2029 ($ million)
      • Chart on Real estate - Year-over-year growth 2024-2029 (%)
      • Data Table on Real estate - Year-over-year growth 2024-2029 (%)
    • 9.6 Casinos and gambling - Market size and forecast 2024-2029
      • Chart on Casinos and gambling - Market size and forecast 2024-2029 ($ million)
      • Data Table on Casinos and gambling - Market size and forecast 2024-2029 ($ million)
      • Chart on Casinos and gambling - Year-over-year growth 2024-2029 (%)
      • Data Table on Casinos and gambling - Year-over-year growth 2024-2029 (%)
    • 9.7 Retail - Market size and forecast 2024-2029
      • Chart on Retail - Market size and forecast 2024-2029 ($ million)
      • Data Table on Retail - Market size and forecast 2024-2029 ($ million)
      • Chart on Retail - Year-over-year growth 2024-2029 (%)
      • Data Table on Retail - Year-over-year growth 2024-2029 (%)
    • 9.8 Market opportunity by Industry Application
      • Market opportunity by Industry Application ($ million)
      • Data Table on Market opportunity by Industry Application ($ million)

    10 Market Segmentation by Technique

    • 10.1 Market segments
      • Chart on Technique - Market share 2024-2029 (%)
      • Data Table on Technique - Market share 2024-2029 (%)
    • 10.2 Comparison by Technique
      • Chart on Comparison by Technique
      • Data Table on Comparison by Technique
    • 10.3 ML based systems - Market size and forecast 2024-2029
      • Chart on ML based systems - Market size and forecast 2024-2029 ($ million)
      • Data Table on ML based systems - Market size and forecast 2024-2029 ($ million)
      • Chart on ML based systems - Year-over-year growth 2024-2029 (%)
      • Data Table on ML based systems - Year-over-year growth 2024-2029 (%)
    • 10.4 AI based systems - Market size and forecast 2024-2029
      • Chart on AI based systems - Market size and forecast 2024-2029 ($ million)
      • Data Table on AI based systems - Market size and forecast 2024-2029 ($ million)
      • Chart on AI based systems - Year-over-year growth 2024-2029 (%)
      • Data Table on AI based systems - Year-over-year growth 2024-2029 (%)
    • 10.5 Rule based systems - Market size and forecast 2024-2029
      • Chart on Rule based systems - Market size and forecast 2024-2029 ($ million)
      • Data Table on Rule based systems - Market size and forecast 2024-2029 ($ million)
      • Chart on Rule based systems - Year-over-year growth 2024-2029 (%)
      • Data Table on Rule based systems - Year-over-year growth 2024-2029 (%)
    • 10.6 Market opportunity by Technique
      • Market opportunity by Technique ($ million)
      • Data Table on Market opportunity by Technique ($ million)

    11 Customer Landscape

    • 11.1 Customer landscape overview
      • Analysis of price sensitivity, lifecycle, customer purchase basket, adoption rates, and purchase criteria

    12 Geographic Landscape

    • 12.1 Geographic segmentation
      • Chart on Market share by geography 2024-2029 (%)
      • Data Table on Market share by geography 2024-2029 (%)
    • 12.2 Geographic comparison
      • Chart on Geographic comparison
      • Data Table on Geographic comparison
    • 12.3 North America - Market size and forecast 2024-2029
      • Chart on North America - Market size and forecast 2024-2029 ($ million)
      • Data Table on North America - Market size and forecast 2024-2029 ($ million)
      • Chart on North America - Year-over-year growth 2024-2029 (%)
      • Data Table on North America - Year-over-year growth 2024-2029 (%)
    • 12.4 Europe - Market size and forecast 2024-2029
      • Chart on Europe - Market size and forecast 2024-2029 ($ million)
      • Data Table on Europe - Market size and forecast 2024-2029 ($ million)
      • Chart on Europe - Year-over-year growth 2024-2029 (%)
      • Data Table on Europe - Year-over-year growth 2024-2029 (%)
    • 12.5 APAC - Market size and forecast 2024-2029
      • Chart on APAC - Market size and forecast 2024-2029 ($ million)
      • Data Table on APAC - Market size and forecast 2024-2029 ($ million)
      • Chart on APAC - Year-over-year growth 2024-2029 (%)
      • Data Table on APAC - Year-over-year growth 2024-2029 (%)
    • 12.6 South America - Market size and forecast 2024-2029
      • Chart on South America - Market size and forecast 2024-2029 ($ million)
      • Data Table on South America - Market size and forecast 2024-2029 ($ million)
      • Chart on South America - Year-over-year growth 2024-2029 (%)
      • Data Table on South America - Year-over-year growth 2024-2029 (%)
    • 12.7 Middle East and Africa - Market size and forecast 2024-2029
      • Chart on Middle East and Africa - Market size and forecast 2024-2029 ($ million)
      • Data Table on Middle East and Africa - Market size and forecast 2024-2029 ($ million)
      • Chart on Middle East and Africa - Year-over-year growth 2024-2029 (%)
      • Data Table on Middle East and Africa - Year-over-year growth 2024-2029 (%)
    • 12.8 US - Market size and forecast 2024-2029
      • Chart on US - Market size and forecast 2024-2029 ($ million)
      • Data Table on US - Market size and forecast 2024-2029 ($ million)
      • Chart on US - Year-over-year growth 2024-2029 (%)
      • Data Table on US - Year-over-year growth 2024-2029 (%)
    • 12.9 Canada - Market size and forecast 2024-2029
      • Chart on Canada - Market size and forecast 2024-2029 ($ million)
      • Data Table on Canada - Market size and forecast 2024-2029 ($ million)
      • Chart on Canada - Year-over-year growth 2024-2029 (%)
      • Data Table on Canada - Year-over-year growth 2024-2029 (%)
    • 12.10 Germany - Market size and forecast 2024-2029
      • Chart on Germany - Market size and forecast 2024-2029 ($ million)
      • Data Table on Germany - Market size and forecast 2024-2029 ($ million)
      • Chart on Germany - Year-over-year growth 2024-2029 (%)
      • Data Table on Germany - Year-over-year growth 2024-2029 (%)
    • 12.11 Japan - Market size and forecast 2024-2029
      • Chart on Japan - Market size and forecast 2024-2029 ($ million)
      • Data Table on Japan - Market size and forecast 2024-2029 ($ million)
      • Chart on Japan - Year-over-year growth 2024-2029 (%)
      • Data Table on Japan - Year-over-year growth 2024-2029 (%)
    • 12.12 UK - Market size and forecast 2024-2029
      • Chart on UK - Market size and forecast 2024-2029 ($ million)
      • Data Table on UK - Market size and forecast 2024-2029 ($ million)
      • Chart on UK - Year-over-year growth 2024-2029 (%)
      • Data Table on UK - Year-over-year growth 2024-2029 (%)
    • 12.13 France - Market size and forecast 2024-2029
      • Chart on France - Market size and forecast 2024-2029 ($ million)
      • Data Table on France - Market size and forecast 2024-2029 ($ million)
      • Chart on France - Year-over-year growth 2024-2029 (%)
      • Data Table on France - Year-over-year growth 2024-2029 (%)
    • 12.14 South Korea - Market size and forecast 2024-2029
      • Chart on South Korea - Market size and forecast 2024-2029 ($ million)
      • Data Table on South Korea - Market size and forecast 2024-2029 ($ million)
      • Chart on South Korea - Year-over-year growth 2024-2029 (%)
      • Data Table on South Korea - Year-over-year growth 2024-2029 (%)
    • 12.15 Finland - Market size and forecast 2024-2029
      • Chart on Finland - Market size and forecast 2024-2029 ($ million)
      • Data Table on Finland - Market size and forecast 2024-2029 ($ million)
      • Chart on Finland - Year-over-year growth 2024-2029 (%)
      • Data Table on Finland - Year-over-year growth 2024-2029 (%)
    • 12.16 Czech Republic - Market size and forecast 2024-2029
      • Chart on Czech Republic - Market size and forecast 2024-2029 ($ million)
      • Data Table on Czech Republic - Market size and forecast 2024-2029 ($ million)
      • Chart on Czech Republic - Year-over-year growth 2024-2029 (%)
      • Data Table on Czech Republic - Year-over-year growth 2024-2029 (%)
    • 12.17 Italy - Market size and forecast 2024-2029
      • Chart on Italy - Market size and forecast 2024-2029 ($ million)
      • Data Table on Italy - Market size and forecast 2024-2029 ($ million)
      • Chart on Italy - Year-over-year growth 2024-2029 (%)
      • Data Table on Italy - Year-over-year growth 2024-2029 (%)
    • 12.18 Market opportunity by geography
      • Market opportunity by geography ($ million)
      • Data Tables on Market opportunity by geography ($ million)

    13 Drivers, Challenges, and Opportunity/Restraints

    • 13.1 Market drivers
      • 13.2 Market challenges
        • 13.3 Impact of drivers and challenges
          • Impact of drivers and challenges in 2024 and 2029
        • 13.4 Market opportunities/restraints

          14 Competitive Landscape

          • 14.1 Overview
            • 14.2 Competitive Landscape
              • Overview on criticality of inputs and factors of differentiation
            • 14.3 Landscape disruption
              • Overview on factors of disruption
            • 14.4 Industry risks
              • Impact of key risks on business

            15 Competitive Analysis

            • 15.1 Companies profiled
              • Companies covered
            • 15.2 Company ranking index
              • Company ranking index
            • 15.3 Market positioning of companies
              • Matrix on companies position and classification
            • 15.4 ACI Worldwide Inc.
              • ACI Worldwide Inc. - Overview
              • ACI Worldwide Inc. - Business segments
              • ACI Worldwide Inc. - Key news
              • ACI Worldwide Inc. - Key offerings
              • ACI Worldwide Inc. - Segment focus
              • SWOT
            • 15.5 Bottomline Technologies Inc.
              • Bottomline Technologies Inc. - Overview
              • Bottomline Technologies Inc. - Product / Service
              • Bottomline Technologies Inc. - Key offerings
              • SWOT
            • 15.6 Consultadoria e Inovacao Tecnologica S.A.
              • Consultadoria e Inovacao Tecnologica S.A. - Overview
              • Consultadoria e Inovacao Tecnologica S.A. - Product / Service
              • Consultadoria e Inovacao Tecnologica S.A. - Key offerings
              • SWOT
            • 15.7 Fair Isaac Corp.
              • Fair Isaac Corp. - Overview
              • Fair Isaac Corp. - Business segments
              • Fair Isaac Corp. - Key news
              • Fair Isaac Corp. - Key offerings
              • Fair Isaac Corp. - Segment focus
              • SWOT
            • 15.8 Fiserv Inc.
              • Fiserv Inc. - Overview
              • Fiserv Inc. - Business segments
              • Fiserv Inc. - Key news
              • Fiserv Inc. - Key offerings
              • Fiserv Inc. - Segment focus
              • SWOT
            • 15.9 International Business Machines Corp.
              • International Business Machines Corp. - Overview
              • International Business Machines Corp. - Business segments
              • International Business Machines Corp. - Key news
              • International Business Machines Corp. - Key offerings
              • International Business Machines Corp. - Segment focus
              • SWOT
            • 15.10 Moodys Corp.
              • Moodys Corp. - Overview
              • Moodys Corp. - Business segments
              • Moodys Corp. - Key news
              • Moodys Corp. - Key offerings
              • Moodys Corp. - Segment focus
              • SWOT
            • 15.11 NICE Actimize Ltd.
              • NICE Actimize Ltd. - Overview
              • NICE Actimize Ltd. - Product / Service
              • NICE Actimize Ltd. - Key offerings
              • SWOT
            • 15.12 Oracle Corp.
              • Oracle Corp. - Overview
              • Oracle Corp. - Business segments
              • Oracle Corp. - Key news
              • Oracle Corp. - Key offerings
              • Oracle Corp. - Segment focus
              • SWOT
            • 15.13 Quantexa Ltd.
              • Quantexa Ltd. - Overview
              • Quantexa Ltd. - Product / Service
              • Quantexa Ltd. - Key offerings
              • SWOT
            • 15.14 SAS Institute Inc.
              • SAS Institute Inc. - Overview
              • SAS Institute Inc. - Product / Service
              • SAS Institute Inc. - Key news
              • SAS Institute Inc. - Key offerings
              • SWOT
            • 15.15 Symphony Innovation LLC
              • Symphony Innovation LLC - Overview
              • Symphony Innovation LLC - Product / Service
              • Symphony Innovation LLC - Key offerings
              • SWOT
            • 15.16 Temenos AG
              • Temenos AG - Overview
              • Temenos AG - Business segments
              • Temenos AG - Key offerings
              • Temenos AG - Segment focus
              • SWOT
            • 15.17 Verafin Inc.
              • Verafin Inc. - Overview
              • Verafin Inc. - Product / Service
              • Verafin Inc. - Key offerings
              • SWOT
            • 15.18 Wolters Kluwer NV
              • Wolters Kluwer NV - Overview
              • Wolters Kluwer NV - Business segments
              • Wolters Kluwer NV - Key news
              • Wolters Kluwer NV - Key offerings
              • Wolters Kluwer NV - Segment focus
              • SWOT

            16 Appendix

            • 16.1 Scope of the report
              • 16.2 Inclusions and exclusions checklist
                • Inclusions checklist
                • Exclusions checklist
              • 16.3 Currency conversion rates for US$
                • Currency conversion rates for US$
              • 16.4 Research methodology
                • Research methodology
              • 16.5 Data procurement
                • Information sources
              • 16.6 Data validation
                • Data validation
              • 16.7 Validation techniques employed for market sizing
                • Validation techniques employed for market sizing
              • 16.8 Data synthesis
                • Data synthesis
              • 16.9 360 degree market analysis
                • 360 degree market analysis
              • 16.10 List of abbreviations
                • List of abbreviations

              Research Methodology

              Technavio presents a detailed picture of the market by way of study, synthesis, and summation of data from multiple sources. The analysts have presented the various facets of the market with a particular focus on identifying the key industry influencers. The data thus presented is comprehensive, reliable, and the result of extensive research, both primary and secondary.

              INFORMATION SOURCES

              Primary sources

              • Manufacturers and suppliers
              • Channel partners
              • Industry experts
              • Strategic decision makers

              Secondary sources

              • Industry journals and periodicals
              • Government data
              • Financial reports of key industry players
              • Historical data
              • Press releases

              DATA ANALYSIS

              Data Synthesis

              • Collation of data
              • Estimation of key figures
              • Analysis of derived insights

              Data Validation

              • Triangulation with data models
              • Reference against proprietary databases
              • Corroboration with industry experts

              REPORT WRITING

              Qualitative

              • Market drivers
              • Market challenges
              • Market trends
              • Five forces analysis

              Quantitative

              • Market size and forecast
              • Market segmentation
              • Geographical insights
              • Competitive landscape

              Interested in this report?

              Get your sample now to see our research methodology and insights!

              Download Now

              Frequently Asked Questions

              Ai-Based Anti-Money Laundering (Aml) Solution market growth will increase by $ 6723.9 mn during 2025-2029 .

              The Ai-Based Anti-Money Laundering (Aml) Solution market is expected to grow at a CAGR of 27.5% during 2025-2029 .

              Ai-Based Anti-Money Laundering (Aml) Solution market is segmented by Type( Transaction monitoring, Customer due diligence, Case management, Risk assessment, Compliance reporting) Deployment( Cloud based, On premises, Hybrid) Industry Application( Banking and financial services, Insurance, Real estate, Casinos and gambling, Retail)

              Abrigo, ACI Worldwide Inc., Bottomline Technologies Inc., Consultadoria e Inovacao Tecnologica S.A., Fair Isaac Corp., Fiserv Inc., GB Group plc, International Business Machines Corp., LexisNexis Legal and Professional, Moodys Corp., NICE Actimize Ltd., Oracle Corp., Quantexa Ltd., SAS Institute Inc., Symphony Innovation LLC, Temenos AG, Verafin Inc., Wolters Kluwer NV are a few of the key vendors in the Ai-Based Anti-Money Laundering (Aml) Solution market.

              North America will register the highest growth rate of 39% among the other regions. Therefore, the Ai-Based Anti-Money Laundering (Aml) Solution market in North America is expected to garner significant business opportunities for the vendors during the forecast period.

              US, Canada, Germany, UK, Japan, France, South Korea, Finland, Italy, Czech Republic

              • Escalating regulatory complexity and intensified enforcement actionsThe global financial landscape is governed by an increasingly intricate and demanding web of anti money laundering and countering the financing of terrorism regulations. This regulatory escalation serves as a primary driver for the adoption of AI-based AML solutions. Financial institutions is the driving factor this market.
              • including banks is the driving factor this market.
              • investment firms is the driving factor this market.
              • and money services businesses is the driving factor this market.
              • are no longer able to effectively manage compliance risk using traditional is the driving factor this market.
              • rule based systems. These legacy systems are ill equipped to handle the volume is the driving factor this market.
              • velocity is the driving factor this market.
              • and complexity of modern financial transactions and the nuanced requirements imposed by regulatory bodies worldwide. The static nature of rule based logic results in an unmanageably high volume of false positive alerts is the driving factor this market.
              • consuming vast human resources while often failing to detect sophisticated illicit activities that do not fit predefined patterns. Consequently is the driving factor this market.
              • organizations are compelled to seek advanced technological solutions that offer dynamic is the driving factor this market.
              • adaptive is the driving factor this market.
              • and context aware monitoring capabilities is the driving factor this market.
              • a domain where AI excels. The imperative is not merely to comply but to demonstrate proactive and effective risk management to regulators who are themselves becoming more technologically sophisticated and data driven in their oversight. The financial penalties for non compliance are severe is the driving factor this market.
              • reaching into the billions of dollars is the driving factor this market.
              • but the reputational damage and potential loss of banking licenses represent an even greater existential threat is the driving factor this market.
              • creating a powerful incentive for investment in next generation AML technology. Recent developments underscore this trend of mounting regulatory pressure. In Europe is the driving factor this market.
              • a significant instance is the continued progress on the European Unions comprehensive AML package. In February 2024 is the driving factor this market.
              • a major milestone was reached when Frankfurt is the driving factor this market.
              • Germany is the driving factor this market.
              • was selected to host the new European Anti Money Laundering Authority is the driving factor this market.
              • or AMLA. This centralized EU body is designed to have direct supervisory powers over high risk financial entities is the driving factor this market.
              • create a unified regulatory framework through a single rulebook is the driving factor this market.
              • and enhance cooperation among national Financial Intelligence Units. The establishment of AMLA signals a move toward more stringent and harmonized enforcement across the bloc is the driving factor this market.
              • compelling institutions operating in the EU to upgrade their compliance frameworks. AI based systems are critical for navigating this new environment is the driving factor this market.
              • as they can adapt to the unified rulebook and provide the granular is the driving factor this market.
              • cross border risk analysis that AMLA will demand. In the United States is the driving factor this market.
              • another powerful instance is the implementation of the Corporate Transparency Act is the driving factor this market.
              • which became effective in January 2024. This act requires many companies to report their beneficial ownership information to the Financial Crimes Enforcement Network is the driving factor this market.
              • or FinCEN. This creates a massive new database of information intended to unmask anonymous shell corporations. For financial institutions is the driving factor this market.
              • this is not just a new data source but a new compliance obligation. They must be able to leverage this beneficial ownership information within their customer due diligence and ongoing monitoring processes. AI and machine learning algorithms are indispensable for integrating this vast dataset is the driving factor this market.
              • performing complex network analysis to identify hidden ownership structures is the driving factor this market.
              • and flagging potential risks that would be impossible to uncover through manual review is the driving factor this market.
              • thereby driving significant market demand. Furthermore is the driving factor this market.
              • regulatory bodies are imposing record penalties for AML failures is the driving factor this market.
              • reinforcing the need for more effective systems. While many large fines were settled in recent years is the driving factor this market.
              • the ongoing investigations and the clear message from regulators continue to drive investment. For example is the driving factor this market.
              • the focus on crypto assets has intensified is the driving factor this market.
              • with the EUs Markets in Crypto Assets is the driving factor this market.
              • or MiCA is the driving factor this market.
              • regulation is the driving factor this market.
              • which entered into force in June 2023 is the driving factor this market.
              • imposing full AML and CFT obligations on crypto asset service providers. This requires firms in the digital asset space to adopt sophisticated transaction monitoring solutions capable of handling the unique challenges of blockchain analysis is the driving factor this market.
              • a task for which AI driven platforms are uniquely suited. is the driving factor this market.

              The Ai-Based Anti-Money Laundering (Aml) Solution market vendors should focus on grabbing business opportunities from the Transaction monitoring segment as it accounted for the largest market share in the base year.