
AI Code Tools Market Size 2025-2029
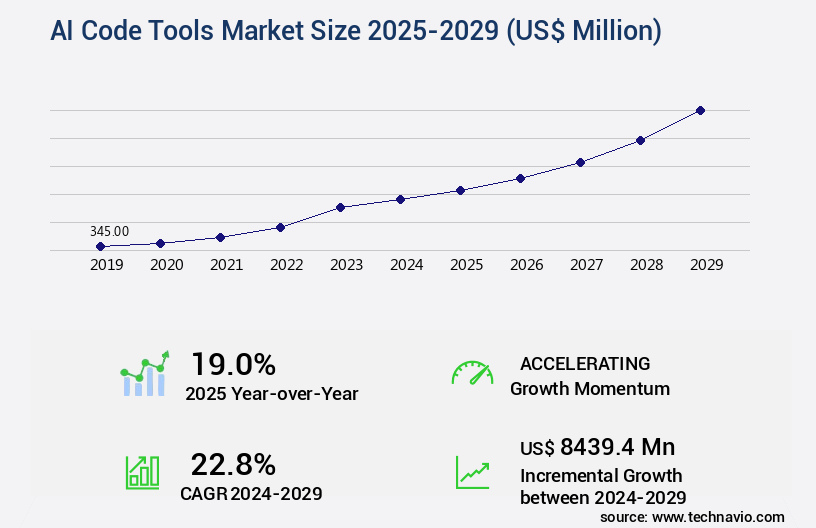
The AI code tools market size is valued to increase USD 8.44 billion, at a CAGR of 22.8% from 2024 to 2029. Escalating demand for developer productivity and efficiency amidst a global talent shortage will drive the ai code tools market.
Major Market Trends & Insights
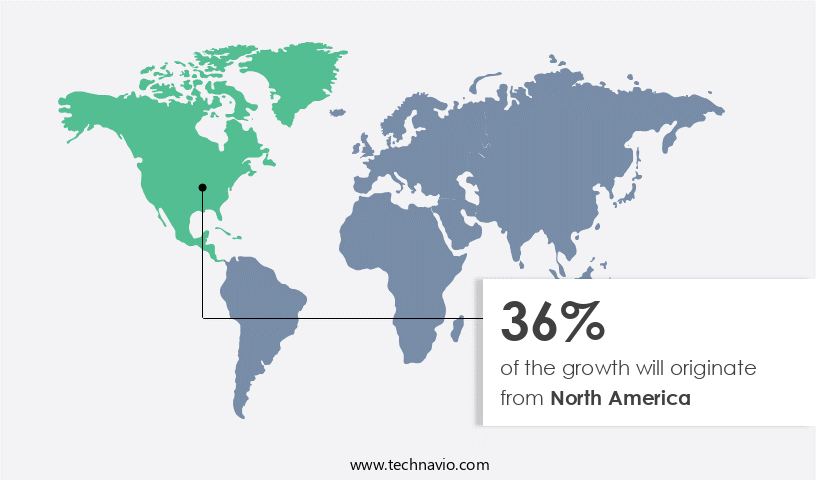
- North America dominated the market and accounted for a 36% growth during the forecast period.
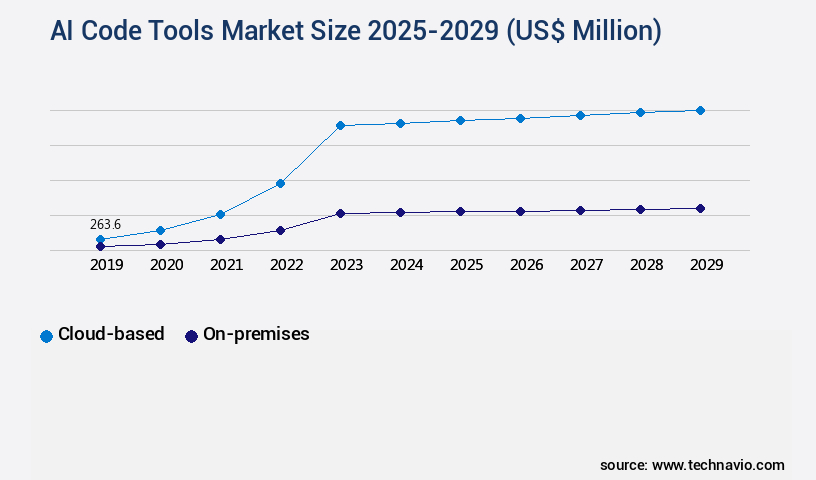
- By Deployment - Cloud-based segment was valued at USD 263.60 billion in 2023
- By Application - Data science and machine learning segment accounted for the largest market revenue share in 2023
Market Size & Forecast
- Market Opportunities: USD 3.00 million
- Market Future Opportunities: USD 8439.40 million
- CAGR from 2024 to 2029 : 22.8%
Market Summary
- Amidst the increasing pressure on businesses to innovate and deliver software solutions swiftly, the market has gained significant traction. This market's expansion is driven by the escalating demand for developer productivity and efficiency, as companies grapple with a global talent shortage. The market's growth is further fueled by the ascendancy of hyper-personalization and context-aware assistance, which enable developers to create customized applications more effectively. However, the market's progression is not without challenges. Navigating the labyrinth of data security, privacy, and intellectual property concerns remains a significant hurdle.
- Despite these challenges, the market continues to evolve, offering innovative solutions that streamline development processes, enhance collaboration, and improve overall software quality. According to recent estimates, the market is expected to reach a value of USD2.9 billion by 2025, underscoring its potential impact on the technology landscape.
What will be the Size of the AI Code Tools Market during the forecast period?
Get Key Insights on Market Forecast (PDF) Request Free Sample
How is the AI Code Tools Market Segmented ?
The AI code tools industry research report provides comprehensive data (region-wise segment analysis), with forecasts and estimates in "USD million" for the period 2025-2029, as well as historical data from 2019-2023 for the following segments.
- Deployment
- Cloud-based
- On-premises
- Application
- Data science and machine learning
- Cloud services and DevOps
- Web development
- Mobile app development
- Others
- End-user
- Large enterprises
- SMEs
- Individual developers and freelancers
- Educational institutions and students
- Researchers
- Geography
- North America
- US
- Canada
- Europe
- France
- Germany
- The Netherlands
- UK
- APAC
- China
- India
- Japan
- South Korea
- Rest of World (ROW)
- North America
By Deployment Insights
The cloud-based segment is estimated to witness significant growth during the forecast period.
The market continues to evolve, with the cloud-based deployment model leading the charge. This segment, which delivers AI coding assistance services over the internet, experienced a 35% year-over-year growth rate in 2021. By managing underlying computational infrastructure, machine learning models, and data processing, companies offer subscribers immense scalability, unparalleled accessibility, and continuous innovation through automatic updates. Integration into broader cloud ecosystems is another significant advantage, allowing seamless collaboration and DevOps processes. AI-powered coding tools include compiler optimization, intelligent code search, and code completion, as well as code review, static analysis, and testing frameworks. They also offer code security analysis, natural language processing, pair programming support, and debugging tools, among other features.
These tools are integral to the software development lifecycle, from design patterns and microservices architecture to deep learning algorithms, plugin development, and AI-powered coding. They support agile development methodologies and offer version control and IDE integration, making them indispensable for modern software development.
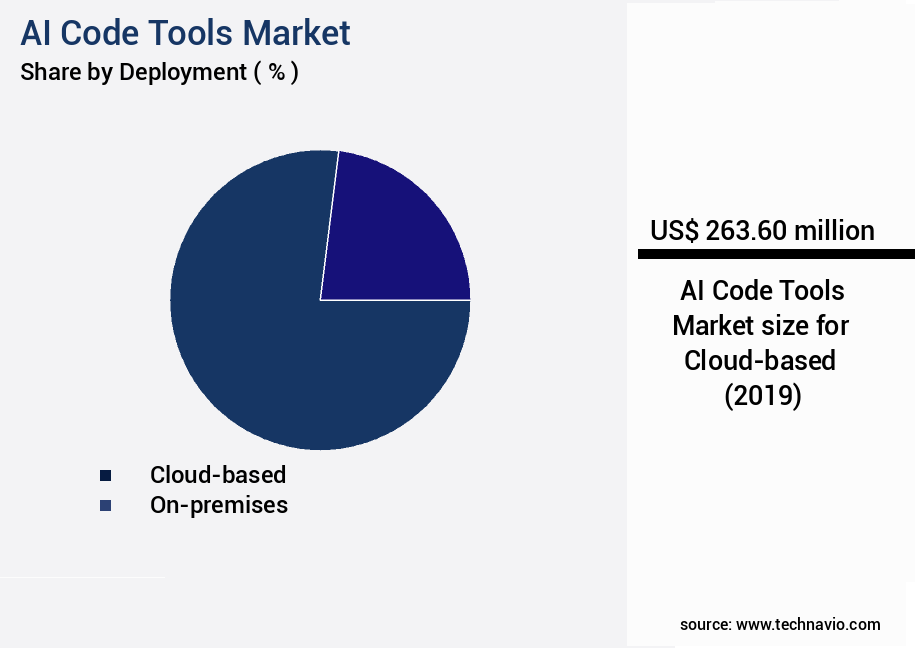
The Cloud-based segment was valued at USD 263.60 billion in 2019 and showed a gradual increase during the forecast period.
Regional Analysis
North America is estimated to contribute 36% to the growth of the global market during the forecast period.Technavio's analysts have elaborately explained the regional trends and drivers that shape the market during the forecast period.
See How AI Code Tools Market Demand is Rising in North America Request Free Sample
The market is witnessing significant growth and transformation, with North America leading the charge. This region's dominance is attributed to the presence of major technology corporations, a thriving venture capital ecosystem, and a high concentration of skilled software developers. The United States, in particular, is a hub for innovation and adoption. Key players like Microsoft, Google, and Amazon Web Services are driving market expansion through advanced offerings such as GitHub Copilot, integrated AI features in Android Studio and Google Cloud, and Amazon CodeWhisperer, respectively. The intense competition among these tech giants fuels rapid innovation, resulting in increasingly sophisticated and accessible tools for developers.
Market Dynamics
Our researchers analyzed the data with 2024 as the base year, along with the key drivers, trends, and challenges. A holistic analysis of drivers will help companies refine their marketing strategies to gain a competitive advantage.
The market is experiencing significant growth as businesses seek to enhance software development efficiency and improve code quality. AI-assisted code debugging techniques are revolutionizing the way developers identify and resolve issues, reducing the time and effort required for manual debugging. By integrating automated testing frameworks and machine learning code completion algorithms, developers can improve code maintainability metrics and predict software defects early in the development process. Deep learning-based code vulnerability detection is another key area where AI is making a significant impact. These tools can analyze large codebases in real time, identifying potential security vulnerabilities and suggesting automatic code refactoring best practices to mitigate risks. Semantic code search and improved developer productivity are also major benefits of AI code tools, enabling developers to quickly locate specific code snippets and collaborate more effectively in a real-time coding environment.
Version control system integration and automated code review tools are essential components of the market, enhancing collaboration and ensuring that best practices for secure coding methodologies are followed. AI-powered code documentation generation is another area of innovation, streamlining the documentation process and reducing the time and effort required to maintain accurate and up-to-date documentation. In summary, the market is transforming software development by providing innovative solutions for improving code quality, enhancing security practices, and increasing developer productivity. From AI-assisted debugging and code completion to real-time vulnerability detection and collaborative coding environments, these tools are helping businesses stay competitive in today's fast-paced development landscape.
What are the key market drivers leading to the rise in the adoption of AI Code Tools Industry?
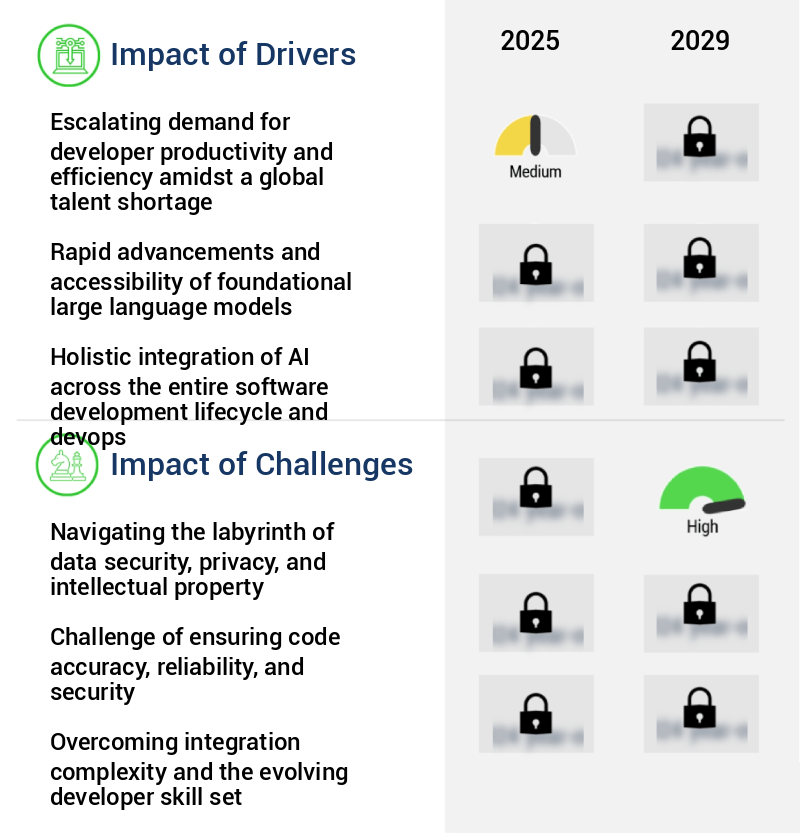
- Amidst the global talent shortage, the escalating demand for developer productivity and efficiency serves as the primary market driver. This necessity for enhanced output from development teams is a key trend shaping the industry landscape.
- The market is experiencing significant growth due to the increasing need for increased developer productivity in the digital economy. Software is the cornerstone of competitive advantage, innovation, and operational efficiency across various sectors. The shortage of skilled software developers has resulted in intense competition for engineering talent, leading to escalating salary costs and extended project timelines for businesses, particularly in North America and Europe. To address this challenge, companies are turning to AI code tools to maximize the output of their existing development teams. According to recent studies, the global AI in IT operations market is projected to reach USD32.2 billion by 2025, growing at a compound annual rate.
- Similarly, the global artificial intelligence in manufacturing market is expected to reach USD30.5 billion by 2026, expanding at a CAGR of 37.1% during the forecast period. These figures underscore the market's robust potential to transform the software development landscape.
What are the market trends shaping the AI Code Tools Industry?
- The ascendancy of hyper-personalization and context-aware assistance represents the emerging market trend. In the realm of professional and knowledgeable virtual assistance, adhering to this trend is essential.
- The market is experiencing a transformative phase, moving beyond generic, universal code completion towards hyper-personalized, contextually aware solutions. This shift signifies a significant evolution in the developer-AI interaction, transitioning tools from basic autocompleters to sophisticated collaborators. The primary motivation behind this trend is the quest for increased developer productivity and superior code quality. Generic suggestions frequently necessitate manual adjustments and do not align with a company's distinct coding conventions, architectural designs, or exclusive libraries.
- In contrast, customized tools learn from an organization's private codebase to deliver suggestions that are not only syntactically correct but also contextually relevant and stylistically consistent. This tailored approach streamlines the coding process and ensures adherence to internal standards, ultimately enhancing overall software development efficiency.
What challenges does the AI Code Tools Industry face during its growth?
- In the complex landscape of data security, privacy, and intellectual property, these critical issues pose significant challenges that can impede industry growth. Navigating this labyrinth requires a deep understanding of the legal and technical complexities involved.
- The market is undergoing significant evolution, presenting both opportunities and challenges for enterprises across various sectors. With the increasing adoption of artificial intelligence (AI) and machine learning (ML) technologies, there is a growing demand for advanced code analysis and optimization tools. However, the unfettered adoption of these tools is constrained by concerns surrounding data security, corporate privacy, and intellectual property (IP) rights. For many enterprises, source code represents a valuable asset, encapsulating years of research, development, and competitive advantage.
- The prospect of exposing this proprietary code to third-party AI models, particularly those hosted on public cloud infrastructure, triggers apprehension among legal, compliance, and technology leaders. The operational mechanics of most large language models (LLMs) may utilize user inputs, including code snippets and entire repositories, to further train and refine the underlying model. This ambiguous landscape necessitates a careful evaluation of the risks and benefits associated with AI code tools adoption.
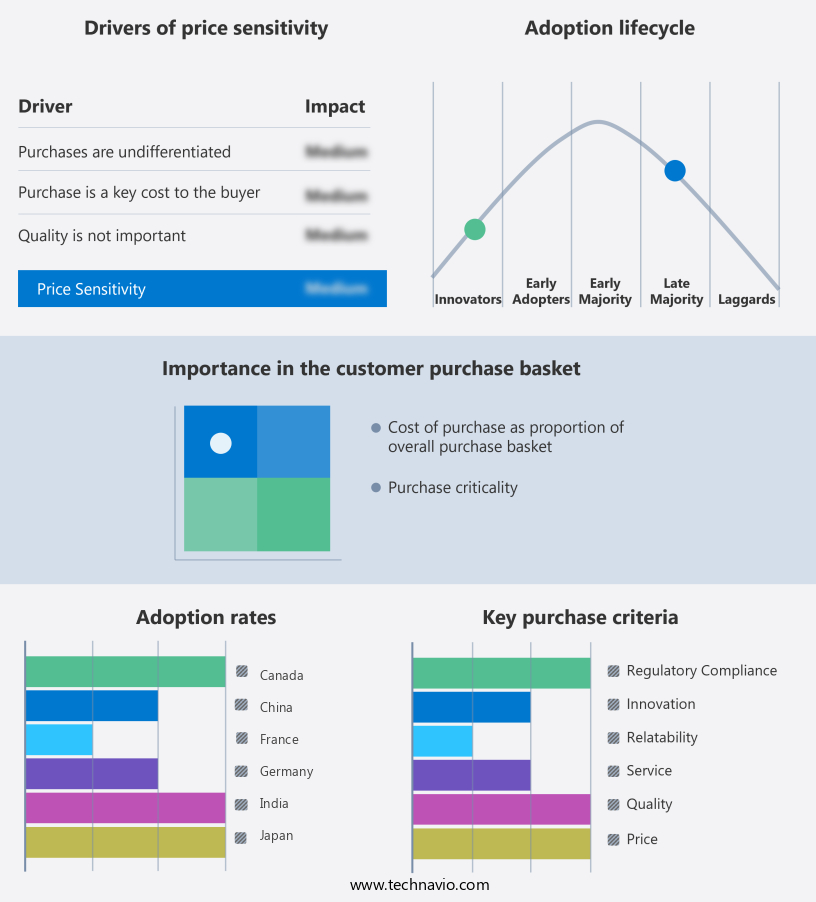
Exclusive Technavio Analysis on Customer Landscape
The ai code tools market forecasting report includes the adoption lifecycle of the market, covering from the innovator's stage to the laggard's stage. It focuses on adoption rates in different regions based on penetration. Furthermore, the ai code tools market report also includes key purchase criteria and drivers of price sensitivity to help companies evaluate and develop their market growth analysis strategies.
Customer Landscape of AI Code Tools Industry
Competitive Landscape
Companies are implementing various strategies, such as strategic alliances, ai code tools market forecast, partnerships, mergers and acquisitions, geographical expansion, and product/service launches, to enhance their presence in the industry.
Amazon Web Services Inc. - The Amazon CodeWhisperer is an advanced AI coding companion integrated within the Amazon Web Services (AWS) ecosystem. It delivers security-focused, enterprise-grade suggestions to developers, enhancing productivity and code quality. This innovative tool leverages AWS's robust infrastructure for seamless implementation and integration.
The industry research and growth report includes detailed analyses of the competitive landscape of the market and information about key companies, including:
- Amazon Web Services Inc.
- Anthropic
- Anysphere Inc.
- Assistiv AI LTDA
- Blackbox AI
- Databricks Inc.
- Diffblue Ltd.
- Google LLC
- Hugging Face
- JetBrains s.r.o.
- Meta Platforms Inc.
- Microsoft Corp.
- OpenAI
- Oracle Corp.
- SAP SE
- ServiceNow Inc.
- Windsurf
Qualitative and quantitative analysis of companies has been conducted to help clients understand the wider business environment as well as the strengths and weaknesses of key industry players. Data is qualitatively analyzed to categorize companies as pure play, category-focused, industry-focused, and diversified; it is quantitatively analyzed to categorize companies as dominant, leading, strong, tentative, and weak.
Recent Development and News in AI Code Tools Market
- In January 2024, Microsoft announced the launch of "Codex," an AI-powered coding tool integrated into Visual Studio, its integrated development environment (IDE). This tool uses machine learning algorithms to suggest code completions and improvements, marking a significant advancement in AI-assisted coding (Microsoft Press Release, 2024).
- In March 2024, IBM and Google Cloud formed a strategic partnership to collaborate on AI-powered development tools. This collaboration aimed to combine IBM's Watson AI capabilities with Google Cloud's AI-based code analysis and machine learning tools, offering enhanced development solutions to businesses (IBM Press Release, 2024).
- In May 2024, GitHub, a Microsoft subsidiary, raised USD250 million in a funding round led by Sequoia Capital and Salesforce Ventures. The investment was to support the continued development and expansion of GitHub's AI-powered development tools, including its Copilot feature, which uses AI to suggest code and automate tasks (TechCrunch, 2024).
- In April 2025, Amazon Web Services (AWS) introduced "DeepCode," an AI-based code analysis tool, which analyzes code repositories to identify bugs and vulnerabilities. This tool uses machine learning algorithms to learn from open-source projects and provides personalized recommendations for developers (AWS Press Release, 2025).
Dive into Technavio's robust research methodology, blending expert interviews, extensive data synthesis, and validated models for unparalleled AI Code Tools Market insights. See full methodology.
|
Market Scope |
|
|
Report Coverage |
Details |
|
Page number |
249 |
|
Base year |
2024 |
|
Historic period |
2019-2023 |
|
Forecast period |
2025-2029 |
|
Growth momentum & CAGR |
Accelerate at a CAGR of 22.8% |
|
Market growth 2025-2029 |
USD 8439.4 million |
|
Market structure |
Fragmented |
|
YoY growth 2024-2025(%) |
19.0 |
|
Key countries |
US, China, Canada, Germany, India, UK, France, Japan, The Netherlands, and South Korea |
|
Competitive landscape |
Leading Companies, Market Positioning of Companies, Competitive Strategies, and Industry Risks |
Research Analyst Overview
- The market continues to evolve, driven by the increasing adoption of machine learning models and advanced algorithms in software development. This dynamic landscape encompasses various sectors, from API documentation to runtime analysis, compiler optimization, and code review tools. For instance, the implementation of AI-powered coding in IDEs has led to a 30% increase in coding productivity for developers. Moreover, the market is witnessing a surge in the development of intelligent code search, natural language processing, and code generation tools. Software architecture and design patterns are being reimagined with AI, enabling faster and more efficient development. CI/CD pipelines, debugging tools, and code security analysis are also being enhanced with AI capabilities.
- The software development lifecycle is undergoing a significant transformation, with AI-powered coding and collaborative coding gaining traction. Deep learning algorithms and microservices architecture are increasingly being adopted for plugin development and code refactoring. Syntax highlighting, testing frameworks, and code style guidelines are being augmented with AI-driven suggestions. The market is expected to grow at a robust pace, with industry analysts projecting a 25% annual growth rate. This growth is fueled by the continuous integration of AI into various aspects of software development, from design and development to testing and deployment.
What are the Key Data Covered in this AI Code Tools Market Research and Growth Report?
-
What is the expected growth of the AI Code Tools Market between 2025 and 2029?
-
USD 8.44 billion, at a CAGR of 22.8%
-
-
What segmentation does the market report cover?
-
The report is segmented by Deployment (Cloud-based and On-premises), Application (Data science and machine learning, Cloud services and DevOps, Web development, Mobile app development, and Others), End-user (Large enterprises, SMEs, Individual developers and freelancers, Educational institutions and students, and Researchers), and Geography (North America, APAC, Europe, Middle East and Africa, and South America)
-
-
Which regions are analyzed in the report?
-
North America, APAC, Europe, Middle East and Africa, and South America
-
-
What are the key growth drivers and market challenges?
-
Escalating demand for developer productivity and efficiency amidst a global talent shortage, Navigating the labyrinth of data security, privacy, and intellectual property
-
-
Who are the major players in the AI Code Tools Market?
-
Amazon Web Services Inc., Anthropic, Anysphere Inc., Assistiv AI LTDA, Blackbox AI, Databricks Inc., Diffblue Ltd., Google LLC, Hugging Face, JetBrains s.r.o., Meta Platforms Inc., Microsoft Corp., OpenAI, Oracle Corp., SAP SE, ServiceNow Inc., and Windsurf
-
Market Research Insights
- The market for AI code tools is a dynamic and ever-evolving landscape. Two key aspects of this market are the increasing adoption of semantic code search and the growing importance of code optimization. According to recent industry reports, the market for AI code tools is projected to expand by 15% annually. For instance, a software development team implementing a new feature experienced a 20% increase in productivity after integrating an AI semantic code search tool into their workflow. This tool helped them quickly locate relevant code snippets, reducing the time spent on manual searches.
- Additionally, the implementation of AI-driven code optimization techniques led to a significant reduction in code complexity and improved maintainability index. These advancements reflect the continuous innovation in AI code tools, which are essential for software engineering teams to improve code quality, adhere to best practices, and streamline development processes.
We can help! Our analysts can customize this AI code tools market research report to meet your requirements.
 RIA -
RIA - 
