
AI Devops Market Size 2026-2030
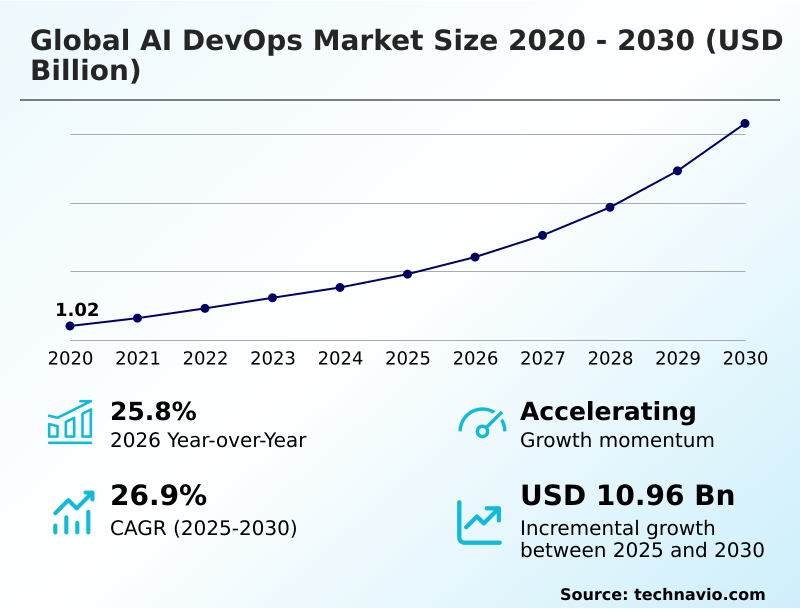
The ai devops market size is valued to increase by USD 10.96 billion, at a CAGR of 26.9% from 2025 to 2030. Escalating complexity of modern IT and cloud environments will drive the ai devops market.
Major Market Trends & Insights
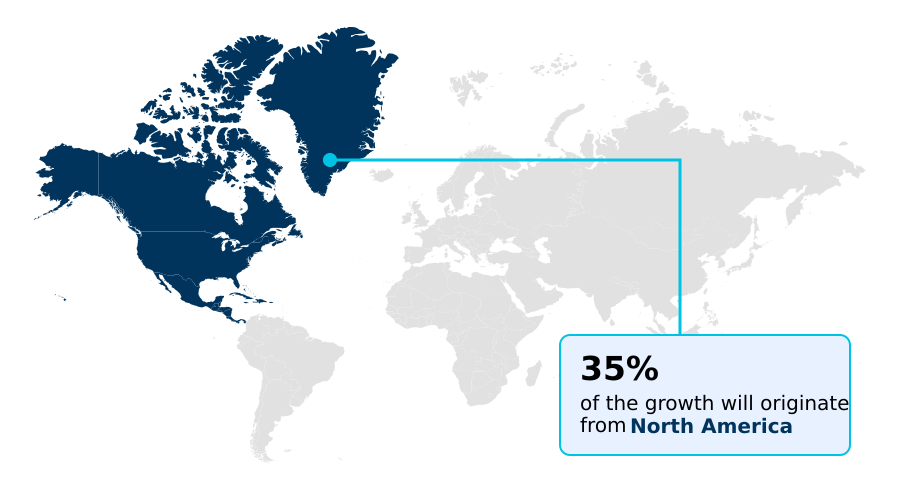
- North America dominated the market and accounted for a 35.2% growth during the forecast period.
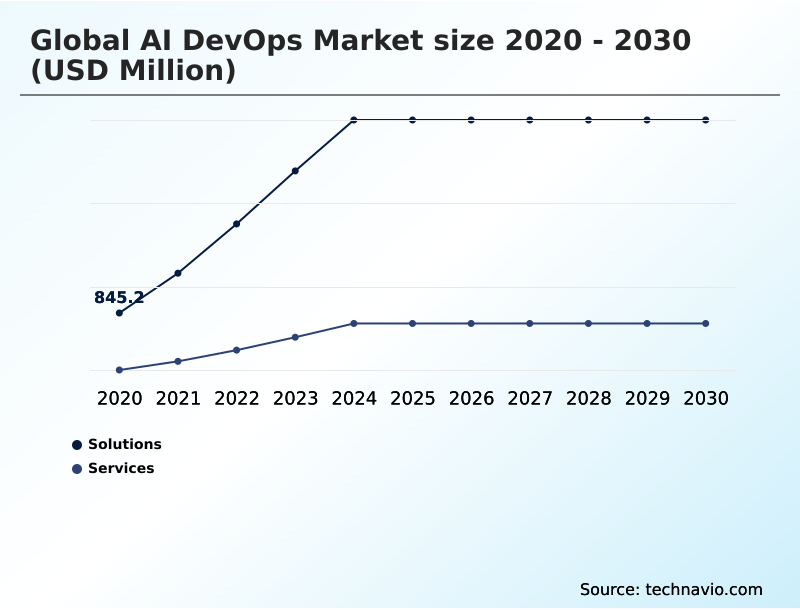
- By Component - Solutions segment was valued at USD 3.10 billion in 2024
- By Deployment - Cloud-based segment accounted for the largest market revenue share in 2024
Market Size & Forecast
- Market Opportunities: USD 14.73 billion
- Market Future Opportunities: USD 10.96 billion
- CAGR from 2025 to 2030 : 26.9%
Market Summary
- The AI DevOps market represents a critical evolution in software engineering, integrating intelligent automation to manage the complexities of modern application development and deployment. This convergence addresses the pressing business need for increased software delivery velocity and reliability in an era of microservices and multi-cloud architectures.
- Core to this market is the application of machine learning to the entire software development lifecycle, from generative ai code generation that boosts developer productivity to autonomous self-healing systems that ensure operational resilience.
- For instance, a global financial institution can leverage a unified observability platform to perform real-time anomaly detection across thousands of services, using ai-driven incident response to mitigate issues before they impact customers. This shift from reactive to predictive operations is enabled by technologies like ml pipeline orchestration, robust data version control, and continuous model retraining.
- However, realizing these benefits requires overcoming challenges such as ensuring data privacy through strong ai governance frameworks and managing the high costs associated with specialized talent and infrastructure. As organizations continue their digital transformation, the principles of AI DevOps, including devsecops for ai and ai-augmented development, are becoming standard practice for building competitive and resilient digital products.
What will be the Size of the AI Devops Market during the forecast period?
Get Key Insights on Market Forecast (PDF) Get Free Sample
How is the AI Devops Market Segmented?
The ai devops industry research report provides comprehensive data (region-wise segment analysis), with forecasts and estimates in "USD million" for the period 2026-2030, as well as historical data from 2020-2024 for the following segments.
- Component
- Solutions
- Services
- Deployment
- Cloud-based
- On-premises
- Application
- Automation testing and QA
- M and PO
- Security and compliance
- Geography
- North America
- US
- Canada
- Mexico
- Europe
- Germany
- UK
- France
- APAC
- China
- Japan
- India
- Middle East and Africa
- Saudi Arabia
- UAE
- South Africa
- South America
- Brazil
- Argentina
- Rest of World (ROW)
- North America
By Component Insights
The solutions segment is estimated to witness significant growth during the forecast period.
The solutions segment is the technological core of the AI DevOps market, providing frameworks to embed the ai in software development lifecycle.
These platforms facilitate machine learning operations (mlops) by offering tools for continuous integration for ml and full model deployment automation. Key offerings focus on ai for developer productivity, leveraging generative ai code generation and enabling intelligent automation in ci/cd.
The aiops platform convergence is evident, with solutions integrating observability in mlops and predictive performance monitoring.
By using ai-driven testing and automated root cause analysis, firms achieve significant gains; for instance, some integrated platforms have reduced deployment times for large language models by over 40%, showcasing the power of generative ai for devops.
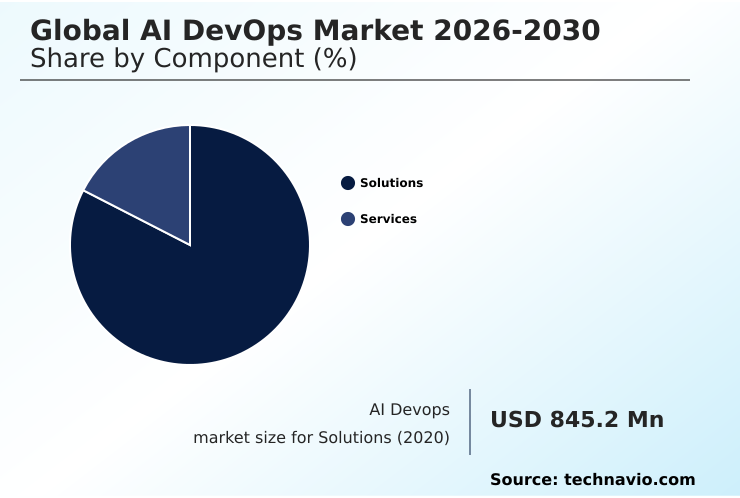
The Solutions segment was valued at USD 3.10 billion in 2024 and showed a gradual increase during the forecast period.
Regional Analysis
North America is estimated to contribute 35.2% to the growth of the global market during the forecast period.Technavio’s analysts have elaborately explained the regional trends and drivers that shape the market during the forecast period.
See How AI Devops Market Demand is Rising in North America Get Free Sample
The geographic landscape of the AI DevOps market is diverse. North America leads in maturity, focusing on intelligent software delivery and ai-driven site reliability, leveraging its robust cloud infrastructure.
Europe emphasizes data sovereignty, driving demand for on-premises solutions that support secure ai model lifecycle management and automated testing for ai models.
Meanwhile, APAC is the fastest-growing region, with a projected growth rate of 28.2%, fueled by its dominant hardware manufacturing and rapid adoption of low-code ai development tools. This region focuses on efficient predictive resource allocation for its massive user bases.
Across all regions, ai in continuous delivery is a shared goal, with teams utilizing intelligent collaboration platforms and techniques like automated code remediation, reproducible ml experiments, and continuous model retraining to maintain a competitive edge.
Market Dynamics
Our researchers analyzed the data with 2025 as the base year, along with the key drivers, trends, and challenges. A holistic analysis of drivers will help companies refine their marketing strategies to gain a competitive advantage.
- Understanding the benefits of ai in devops is crucial for enterprises aiming to stay competitive. The primary advantage lies in automating ci/cd with ai, which accelerates delivery cycles and enhances reliability. A key area of discussion is aiops vs traditional monitoring; modern AIOps platforms provide predictive insights that legacy tools cannot match, enabling proactive issue resolution.
- The use of generative ai for test automation is another significant leap, allowing teams to create more comprehensive test suites automatically. The ultimate goal for many is implementing self-healing systems, which autonomously detect and fix production issues, a milestone for operational maturity.
- However, the path is not without obstacles, and addressing the challenges of ai in devops, such as data privacy and talent gaps, is essential for success. A critical component of this is securing ai development pipelines, which addresses vulnerabilities throughout the development process. Organizations are also focused on ai for cloud resource optimization to manage spiraling compute costs.
- When adopting these technologies, following mlops best practices for enterprises is non-negotiable for scalable and governable deployments. Firms that invest in ai-driven root cause analysis tools find they can reduce mean-time-to-resolution by more than half compared to those using manual methods.
- The strategy also includes using ai for predictive maintenance in infrastructure, integrating observability with aiops for a single pane of glass, and ensuring continuous ai model monitoring for drift. The foundational elements of automating infrastructure with ai and leveraging ai-powered developer productivity tools are key.
- The role of ai in devsecops is to build security in from the start, supported by clear ai governance and compliance frameworks. Finally, ai-assisted code refactoring, reducing deployment failures with ai, and using ai for managing microservices are tactical applications that yield significant returns on investment.
What are the key market drivers leading to the rise in the adoption of AI Devops Industry?
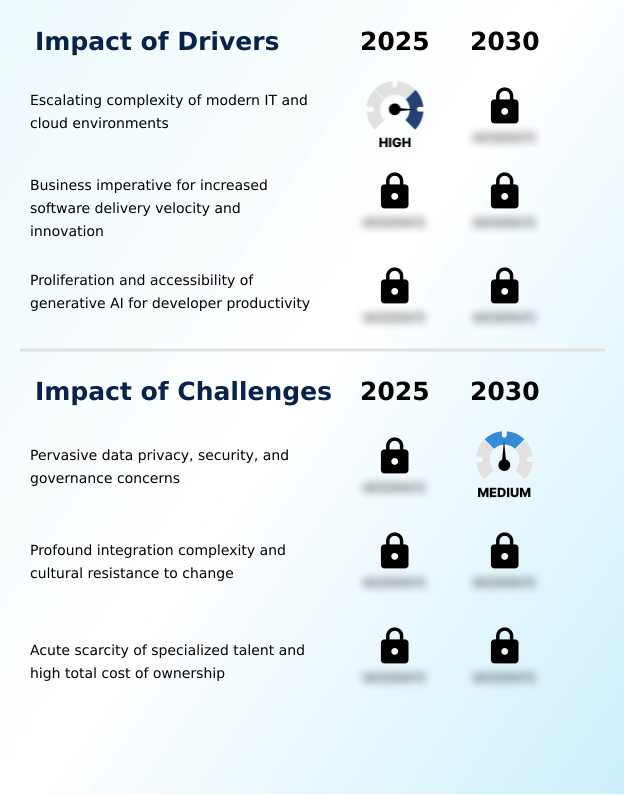
- The escalating complexity of modern IT and cloud environments serves as a key driver for the adoption of AI DevOps technologies.
- The escalating complexity of modern IT environments is a major driver, with systems generating petabytes of telemetry data that demand predictive analytics in devops for management.
- A cognitive operations platform leverages real-time anomaly detection to parse this data, enabling ai-enhanced incident management that reduces critical incident resolution times by over 30%.
- The business imperative for faster innovation propels ai-augmented development, supported by generative ai assistants in devops and robust ml pipeline orchestration. This ecosystem relies on automated infrastructure as code and infrastructure as code (iac) automation for consistency.
- A unified observability platform provides crucial insights for ai-driven performance optimization and better ai for software quality assurance, while automated security patching minimizes vulnerabilities within hours instead of days.
What are the market trends shaping the AI Devops Industry?
- The proliferation of generative AI assistants across the entire DevOps lifecycle is a fundamental trend, altering the strategic landscape for organizations seeking to eliminate manual friction within production chains.
- A primary trend is the shift toward autonomous devops, where autonomous self-healing systems can preemptively resolve issues, reducing manual intervention by up to 70%. This is enabled by ai-powered observability solutions and advanced ai-driven analytics for devops. The convergence of observability and security is driving devsecops automation, with a focus on integrating devsecops for ai early in the lifecycle.
- Development workflows are being redefined by robust data version control and seamless feature store integration, improving model reproducibility. Furthermore, advanced ml model deployment strategies now include continuous ml model monitoring and ai-driven incident response, while synthetic data generation qa enhances testing robustness, improving edge-case test coverage by over 50%, building a resilient self-healing infrastructure.
What challenges does the AI Devops Industry face during its growth?
- Pervasive data privacy, security, and governance concerns represent a primary challenge affecting the growth of the AI DevOps market.
- Significant challenges hinder widespread adoption. Pervasive security concerns necessitate strong ai governance frameworks and clear policies for ai governance in software delivery, as well as automated compliance checks. Integration complexity is another barrier, as nearly 60% of digital transformation projects falter due to cultural resistance and fragmented toolsets.
- Organizations struggle with containerized ml workloads and serverless ai deployment without a cohesive data-centric devops strategy. The scarcity of specialized talent capable of managing declarative machine learning and infrastructure automation drives up costs.
- Effective ai model versioning and model drift detection require skills that are in short supply, while tools for automated code review tools and ai-powered cloud cost management require significant investment and training.
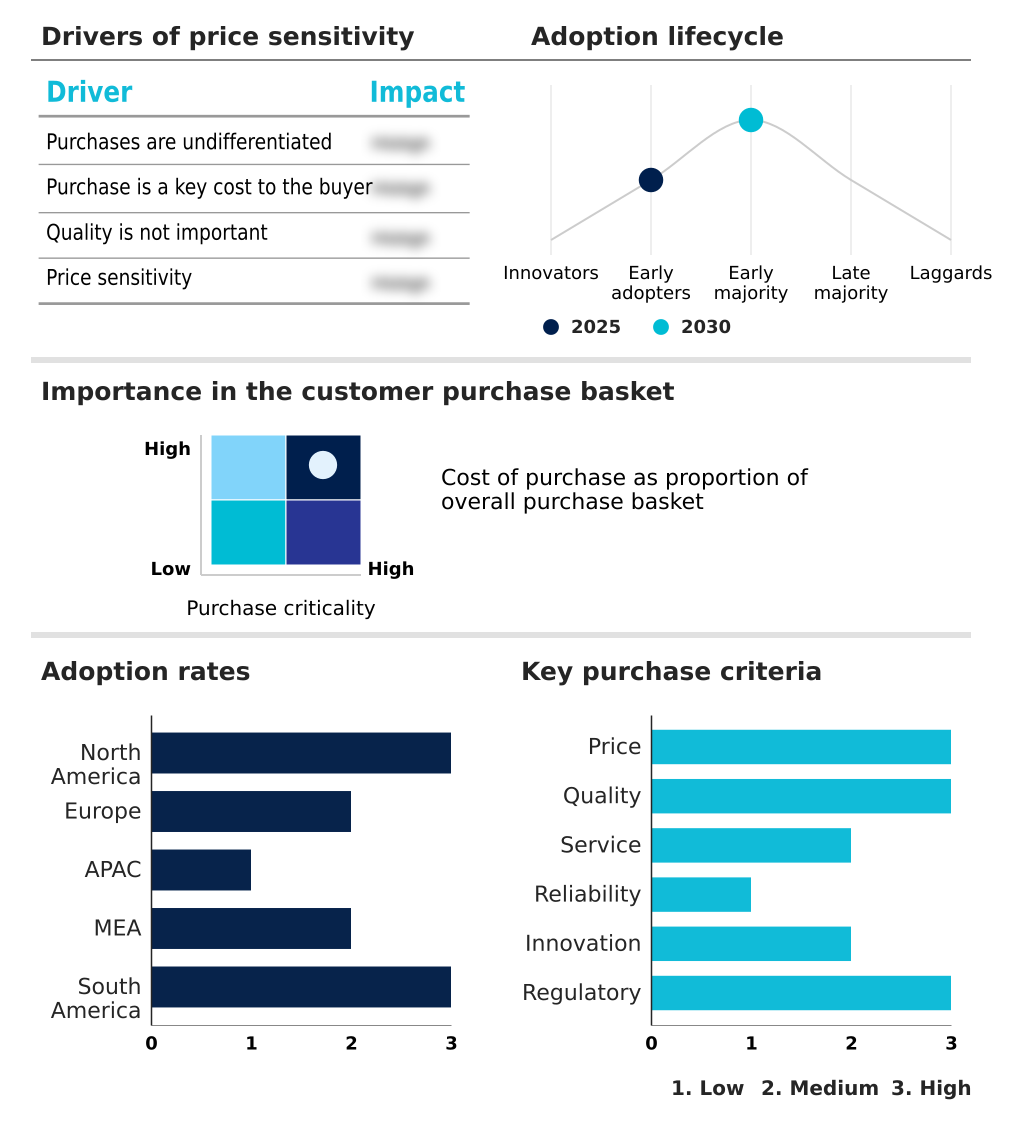
Exclusive Technavio Analysis on Customer Landscape
The ai devops market forecasting report includes the adoption lifecycle of the market, covering from the innovator’s stage to the laggard’s stage. It focuses on adoption rates in different regions based on penetration. Furthermore, the ai devops market report also includes key purchase criteria and drivers of price sensitivity to help companies evaluate and develop their market growth analysis strategies.
Customer Landscape of AI Devops Industry
Competitive Landscape
Companies are implementing various strategies, such as strategic alliances, ai devops market forecast, partnerships, mergers and acquisitions, geographical expansion, and product/service launches, to enhance their presence in the industry.
Amazon Web Services Inc. - Delivering integrated AI DevOps platforms that accelerate software delivery through automated CI/CD, intelligent observability, and generative AI-powered development tools for enhanced operational efficiency.
The industry research and growth report includes detailed analyses of the competitive landscape of the market and information about key companies, including:
- Amazon Web Services Inc.
- Atlassian Corp.
- CloudBees Inc.
- Datadog Inc.
- DBmaestro
- Dynatrace Inc.
- Google LLC
- Harness Inc.
- IBM Corp.
- Intel Corp.
- JFrog Ltd.
- Kentik Inc.
- Microsoft Corp.
- New Relic Inc.
- Oracle Corp.
- Perforce Software Inc.
- Progress Software Corp.
- Rootly Inc.
- Zymr Inc.
Qualitative and quantitative analysis of companies has been conducted to help clients understand the wider business environment as well as the strengths and weaknesses of key industry players. Data is qualitatively analyzed to categorize companies as pure play, category-focused, industry-focused, and diversified; it is quantitatively analyzed to categorize companies as dominant, leading, strong, tentative, and weak.
Recent Development and News in Ai devops market
- In May, 2025, GitLab revealed a major update to its integrated platform that utilizes generative models to automatically suggest code fixes and security patches, reducing time-to-market for enterprise clients by over 30%.
- In April, 2025, IBM finalized the deployment of its cognitive operations platform for a major international telecommunications group, enabling the management of over one million edge devices with minimal human intervention.
- In March, 2025, Datadog announced a tactical price adjustment for its high-end observability modules, citing the rising costs of maintaining massive server arrays for real-time anomaly detection and root cause analysis.
- In January, 2025, Palo Alto Networks announced a strategic update to its cloud security suite, specifically designed to address vulnerabilities in automated code generation and model deployment workflows.
Dive into Technavio’s robust research methodology, blending expert interviews, extensive data synthesis, and validated models for unparalleled AI Devops Market insights. See full methodology.
| Market Scope | |
|---|---|
| Page number | 291 |
| Base year | 2025 |
| Historic period | 2020-2024 |
| Forecast period | 2026-2030 |
| Growth momentum & CAGR | Accelerate at a CAGR of 26.9% |
| Market growth 2026-2030 | USD 10959.6 million |
| Market structure | Fragmented |
| YoY growth 2025-2026(%) | 25.8% |
| Key countries | US, Canada, Mexico, Germany, UK, France, Italy, Spain, The Netherlands, China, Japan, India, South Korea, Australia, Indonesia, Saudi Arabia, UAE, South Africa, Israel, Turkey, Brazil, Argentina and Chile |
| Competitive landscape | Leading Companies, Market Positioning of Companies, Competitive Strategies, and Industry Risks |
Research Analyst Overview
- The AI DevOps market is defined by a technological shift towards intelligent software delivery and infrastructure automation. The core of this transformation involves ai model lifecycle management, from reproducible ml experiments to full model deployment automation for containerized ml workloads and serverless ai deployment.
- Boardroom decisions now focus on budgeting for a cognitive operations platform that enables predictive performance monitoring and predictive resource allocation. Such platforms rely on a unified observability platform for observability in mlops, facilitating real-time anomaly detection and automated root cause analysis for ai-assisted debugging.
- This enables autonomous self-healing systems and rapid ai-driven incident response, with some firms achieving a 30% reduction in downtime. DevSecOps for AI is critical, integrating automated security patching and ai governance frameworks. Development is accelerated through ai-augmented development, generative ai code generation, and ai-powered collaboration tools.
- The lifecycle includes continuous integration for ml, ml pipeline orchestration, data version control, feature store integration, ml model monitoring for model drift detection, and continuous model retraining. Quality is assured with ai-driven testing and synthetic data generation qa, while declarative machine learning and automated code remediation streamline processes.
What are the Key Data Covered in this AI Devops Market Research and Growth Report?
-
What is the expected growth of the AI Devops Market between 2026 and 2030?
-
USD 10.96 billion, at a CAGR of 26.9%
-
-
What segmentation does the market report cover?
-
The report is segmented by Component (Solutions, and Services), Deployment (Cloud-based, and On-premises), Application (Automation testing and QA, M and PO, and Security and compliance) and Geography (North America, Europe, APAC, Middle East and Africa, South America)
-
-
Which regions are analyzed in the report?
-
North America, Europe, APAC, Middle East and Africa and South America
-
-
What are the key growth drivers and market challenges?
-
Escalating complexity of modern IT and cloud environments, Pervasive data privacy, security, and governance concerns
-
-
Who are the major players in the AI Devops Market?
-
Amazon Web Services Inc., Atlassian Corp., CloudBees Inc., Datadog Inc., DBmaestro, Dynatrace Inc., Google LLC, Harness Inc., IBM Corp., Intel Corp., JFrog Ltd., Kentik Inc., Microsoft Corp., New Relic Inc., Oracle Corp., Perforce Software Inc., Progress Software Corp., Rootly Inc. and Zymr Inc.
-
Market Research Insights
- Market dynamics are shaped by the integration of ai in software development lifecycle, with machine learning operations (mlops) becoming standard. The push for ai for developer productivity is met by generative ai for devops and generative ai assistants in devops. This drives intelligent automation in ci/cd and ai in continuous delivery, supported by the aiops platform convergence.
- Enterprises adopt ai-powered observability solutions for ai-driven analytics for devops and ai-driven performance optimization, enabling ai-driven site reliability and self-healing infrastructure. This move toward autonomous devops necessitates new ml model deployment strategies and robust ai for software quality assurance, including automated testing for ai models and ai-assisted security testing.
- Governance is managed through ai governance in software delivery and automated compliance checks. This data-centric devops approach utilizes ai model versioning, automated code review tools, and ai-powered cloud cost management for efficiency, while intelligent collaboration platforms and low-code ai development improve accessibility and ai-enhanced incident management ensures stability.
- Firms using this approach see up to a 40% improvement in deployment frequency.
We can help! Our analysts can customize this ai devops market research report to meet your requirements.
 RIA -
RIA - 
