Ai-driven Drug Safety And Pharmacovigilance Platforms Market Analysis, Size, and Forecast 2026-2030: North America (US, Canada, and Mexico), Europe (Germany, UK, and France), APAC (China, India, and Japan), Middle East and Africa (Saudi Arabia, UAE, and Israel), South America (Brazil, Argentina, and Colombia), and Rest of World (ROW)

Ai-driven Drug Safety And Pharmacovigilance Platforms Market Analysis, Size, and Forecast 2026-2030:
North America (US, Canada, and Mexico), Europe (Germany, UK, and France), APAC (China, India, and Japan), Middle East and Africa (Saudi Arabia, UAE, and Israel), South America (Brazil, Argentina, and Colombia), and Rest of World (ROW)

Published: Apr 2026 309 Pages SKU: IRTNTR81442

Market Overview at a Glance

$3.10 B
Market Opportunity
19.9%
CAGR 2025 - 2030
33.6%
North America Growth
$951.5 Mn
Cloud-based platforms segment 2024

Ai-driven Drug Safety And Pharmacovigilance Platforms Market Size 2026-2030

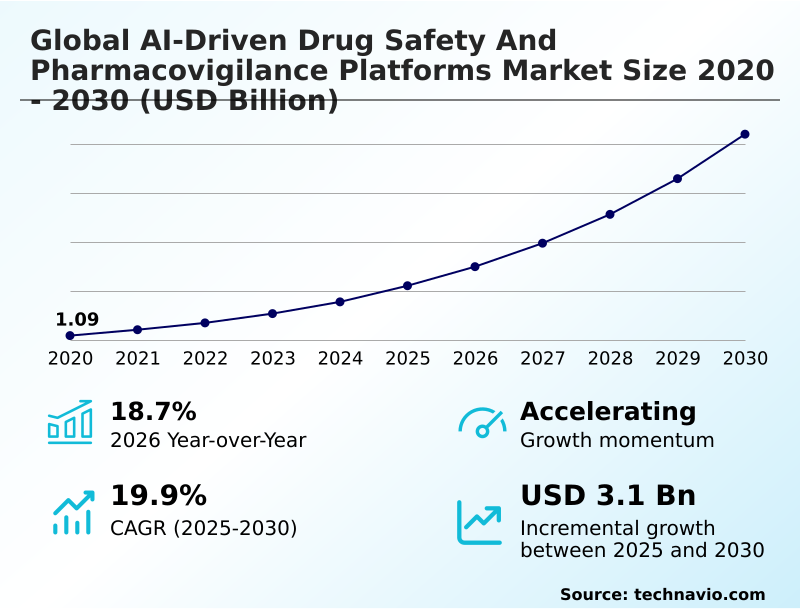
The ai-driven drug safety and pharmacovigilance platforms market size is valued to increase by USD 3.10 billion, at a CAGR of 19.9% from 2025 to 2030. Increasing volume and complexity of adverse event data will drive the ai-driven drug safety and pharmacovigilance platforms market.

Major Market Trends & Insights

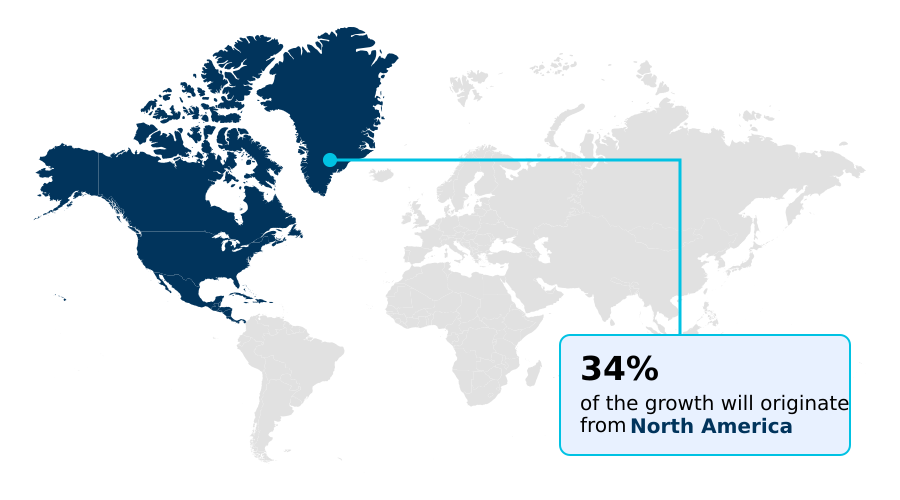
  • North America dominated the market and accounted for a 33.6% growth during the forecast period.
  • By Deployment - Cloud-based platforms segment was valued at USD 951.5 million in 2024
  • By End-user - Pharma and biotech companies segment accounted for the largest market revenue share in 2024

Market Size & Forecast

  • Market Opportunities: USD 4.12 billion
  • Market Future Opportunities: USD 3.10 billion
  • CAGR from 2025 to 2030 : 19.9%

Market Summary

  • The AI-driven drug safety and pharmacovigilance platforms market is undergoing a significant transformation, moving beyond reactive compliance to proactive, predictive safety management. This shift is fueled by the need to process vast volumes of unstructured data from sources like electronic health records, social media, and wearables.
  • Advanced platforms leverage automated case processing and natural language processing for safety to automate routine tasks, allowing pharmacovigilance teams to focus on strategic analysis and risk mitigation. For instance, a pharmaceutical company launching a new therapy can deploy machine learning signal detection models to monitor real-world evidence in near real-time.
  • This capability enables the rapid identification of potential adverse drug reaction monitoring, ensuring quicker updates to safety protocols and enhancing patient outcomes. The adoption of such intelligent pharmacovigilance systems not only ensures regulatory compliance but also builds a more resilient and efficient drug safety ecosystem, ultimately driving better public health protection through robust pharmacovigilance technology solutions and adverse event monitoring.

What will be the Size of the Ai-driven Drug Safety And Pharmacovigilance Platforms Market during the forecast period?

Get Key Insights on Market Forecast (PDF) Request Free Sample

How is the Ai-driven Drug Safety And Pharmacovigilance Platforms Market Segmented?

The ai-driven drug safety and pharmacovigilance platforms industry research report provides comprehensive data (region-wise segment analysis), with forecasts and estimates in "USD million" for the period 2026-2030, as well as historical data from 2020-2024 for the following segments.
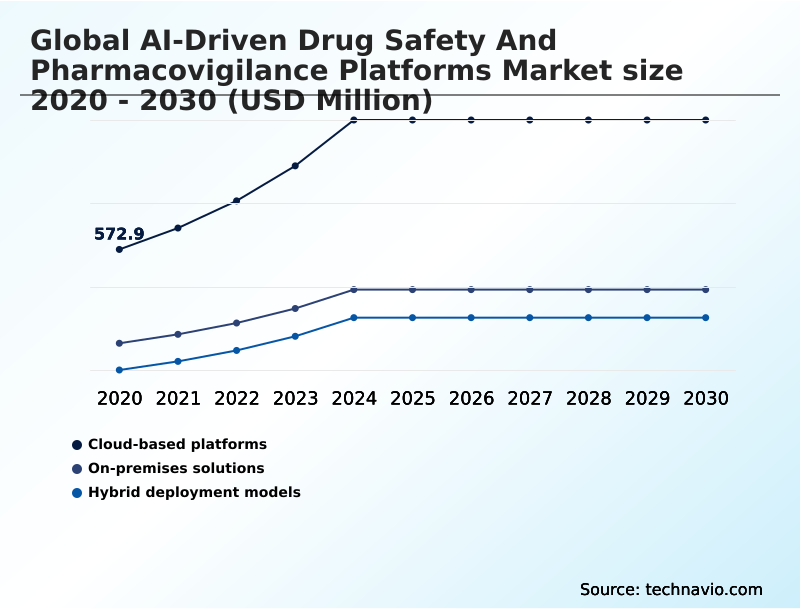
  • Deployment
    • Cloud-based platforms
    • On-premises solutions
    • Hybrid deployment models
  • End-user
    • Pharma and biotech companies
    • Contract research organizations
    • Regulatory authorities
    • Healthcare providers
  • Application
    • Adverse event detection
    • Risk management
    • Literature screening
    • Regulatory compliance
  • Geography
    • North America
      • US
      • Canada
      • Mexico
    • Europe
      • Germany
      • UK
      • France
    • APAC
      • China
      • India
      • Japan
    • Middle East and Africa
      • Saudi Arabia
      • UAE
      • Israel
    • South America
      • Brazil
      • Argentina
      • Colombia
    • Rest of World (ROW)

By Deployment Insights

The cloud-based platforms segment is estimated to witness significant growth during the forecast period.

Cloud-based platforms are reshaping pharmacovigilance through scalable, flexible software-as-a-service models. This deployment minimizes on-site hardware and maintenance, enabling GxP compliant cloud platforms to deliver continuous updates and refinements to machine learning signal detection algorithms.

Organizations benefit from a unified, accessible environment for global safety teams, improving data processing efficiency by up to 40%.

The model facilitates seamless real-world evidence integration and supports AI-driven benefit-risk assessment by providing the computational power needed for complex AI-powered literature screening.

This approach, centered on pharmacovigilance process optimization, shifts spending from capital to operational expenditures, making advanced pharmacovigilance automation technologies accessible to a broader range of organizations. The focus on AI for regulatory submissions and intelligent automation in pharmacovigilance is paramount.

Request Free Sample

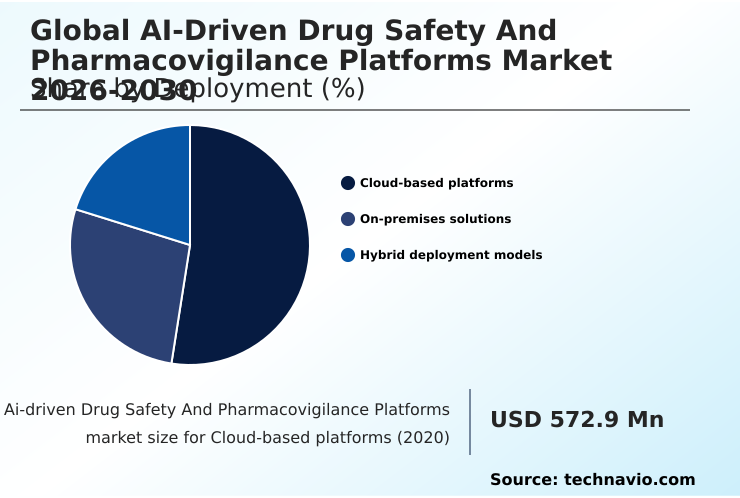
The Cloud-based platforms segment was valued at USD 951.5 million in 2024 and showed a gradual increase during the forecast period.

Request Free Sample

Regional Analysis

North America is estimated to contribute 33.6% to the growth of the global market during the forecast period.Technavio’s analysts have elaborately explained the regional trends and drivers that shape the market during the forecast period.

See How Ai-driven Drug Safety And Pharmacovigilance Platforms Market Demand is Rising in North America Request Free Sample

The geographic landscape of the AI-driven drug safety market is led by North America, which accounts for over 33% of incremental growth due to its advanced pharmaceutical ecosystem and early adoption of unified safety platforms.

This region leverages AI-enhanced signal management to meet stringent regulatory demands. Meanwhile, APAC is the fastest-growing region, driven by the expansion of pharmaceutical manufacturing and digitalization.

Europe maintains a strong position, with a focus on data privacy and the validation of adverse event detection algorithms. Firms in mature markets utilize AI-based safety signal analysis to reduce manual literature review times by over 50%.

The adoption of pharmacovigilance reporting tools and adverse event database management is becoming standard.

These regional dynamics highlight a global shift toward automated, data-centric safety surveillance and pharmacovigilance outsourcing services to manage complex requirements, with pharmacovigilance service providers playing a key role.

Market Dynamics

Our researchers analyzed the data with 2025 as the base year, along with the key drivers, trends, and challenges. A holistic analysis of drivers will help companies refine their marketing strategies to gain a competitive advantage.

  • Understanding the role of AI in the pharmacovigilance process is critical for life sciences organizations aiming to enhance efficiency and compliance. The evolution toward automating adverse event case processing is driven by the need to manage immense data volumes while ensuring accuracy. The benefits of cloud-based pharmacovigilance platforms are significant, offering scalability and accessibility that on-premise solutions cannot match.
  • However, the challenges of AI in drug safety, particularly around model validation and explainable AI for drug safety assessment, require careful consideration. Integrating real-world evidence in pharmacovigilance is no longer optional but a necessity for comprehensive post-market surveillance.
  • Organizations successfully implementing generative AI for safety narrative generation have reported efficiency gains nearly double those of peers who only partially automate their workflows. This demonstrates the profound impact of AI on pharmacovigilance workflows. The future of AI in pharmacovigilance lies in creating interconnected systems that improve regulatory compliance with AI and enhance patient safety with predictive analytics.
  • AI platforms for contract research organizations are also becoming essential, enabling them to offer more competitive services. As the industry overcomes data silos in pharmacovigilance and advances machine learning models for signal detection, the cost-effectiveness of automated pharmacovigilance systems becomes increasingly clear. This transition supports better AI applications in post-market surveillance and strengthens the entire drug safety lifecycle.

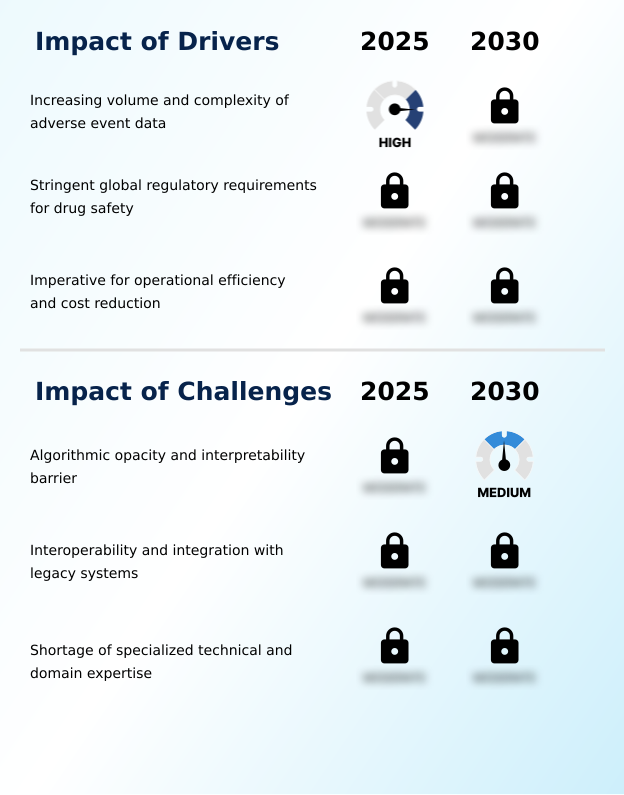
What are the key market drivers leading to the rise in the adoption of Ai-driven Drug Safety And Pharmacovigilance Platforms Industry?

  • The increasing volume and complexity of adverse event data from diverse sources is a key driver for the market.

  • The market's growth is propelled by several key drivers, including the imperative for operational efficiency. The use of automated case processing and other pharmacovigilance automation technologies reduces the cost per case for adverse event processing by an average of 35%.
  • Stringent global regulatory requirements are another major factor, pushing firms to adopt technologies that ensure high-quality safety data and auditable pharmacovigilance data processing. These AI-driven platforms help companies meet strict reporting deadlines with over 99% accuracy.
  • The increasing volume and complexity of adverse event data from sources like social media and wearables make manual analysis untenable, necessitating advanced safety data analysis tools and intelligent pharmacovigilance systems.
  • The adoption of these tools is crucial for maintaining a proactive approach to drug safety.

What are the market trends shaping the Ai-driven Drug Safety And Pharmacovigilance Platforms Industry?

  • The integration of generative artificial intelligence for automated medical narrative generation is an emerging market trend. This development aims to accelerate compliant safety reporting and enhance standardization.

  • Key trends are reshaping the market, led by the adoption of generative AI in life sciences and proactive safety surveillance. The move toward cloud-native and modular SaaS platforms enables greater agility, allowing firms to adopt specific functionalities like AI-enhanced signal management as needed.
  • This approach offers significant efficiency gains, with the use of generative AI narrative generation shown to reduce safety reporting cycle times by over 30%. Furthermore, the transition to proactive monitoring using real-world evidence has improved early safety signal detection by 25% compared to legacy methods.
  • The focus on pharmacovigilance system validation ensures these AI-driven drug safety and pharmacovigilance platforms meet rigorous regulatory standards, while adverse reaction monitoring software becomes more sophisticated. The market is also seeing growth in adverse event monitoring and AI for drug development safety, enhancing safety throughout the product lifecycle.

What challenges does the Ai-driven Drug Safety And Pharmacovigilance Platforms Industry face during its growth?

  • The opacity and interpretability barriers of complex algorithms present a key challenge affecting industry growth.

  • Despite strong drivers, the market faces significant challenges, including the need for specialized technical and domain expertise. The issue of algorithmic opacity creates an interpretability barrier, as the 'black box' nature of some machine learning for drug safety models complicates validation. This lack of transparency can require up to a 20% increase in manual verification for high-risk signals.
  • Furthermore, ensuring data interoperability and integration with legacy systems remains a primary hurdle. The process of mapping inconsistent data to a centralized pharmacovigilance technology solution can account for 60% of an implementation timeline. Overcoming these challenges is essential for realizing the full potential of AI-powered signal management and adverse event case intake.
  • The industry must balance innovation with the need for trust and reliability in its safety signal analysis and drug safety monitoring solutions.

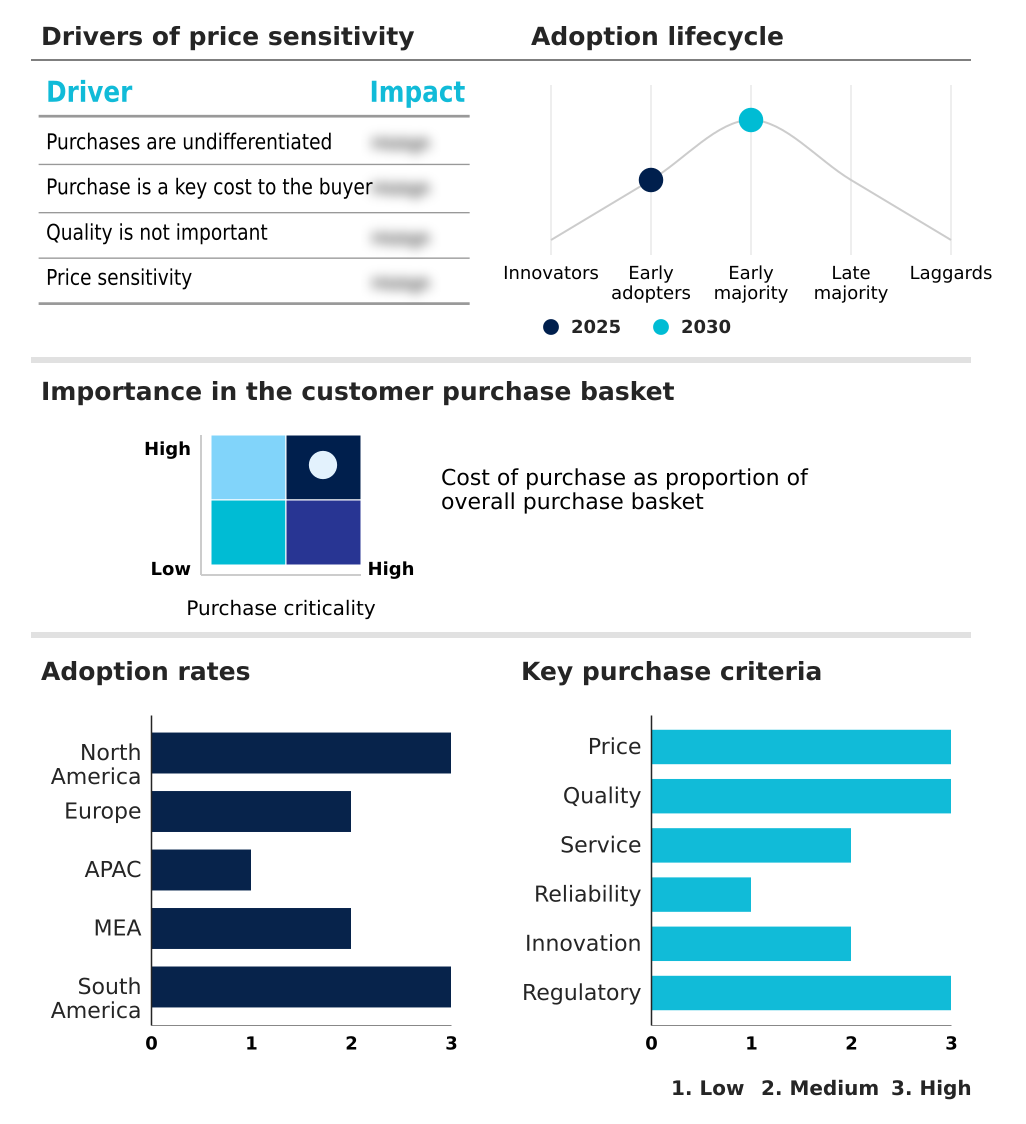
Exclusive Technavio Analysis on Customer Landscape

The ai-driven drug safety and pharmacovigilance platforms market forecasting report includes the adoption lifecycle of the market, covering from the innovator’s stage to the laggard’s stage. It focuses on adoption rates in different regions based on penetration. Furthermore, the ai-driven drug safety and pharmacovigilance platforms market report also includes key purchase criteria and drivers of price sensitivity to help companies evaluate and develop their market growth analysis strategies.

Customer Landscape of Ai-driven Drug Safety And Pharmacovigilance Platforms Industry

Competitive Landscape

Companies are implementing various strategies, such as strategic alliances, ai-driven drug safety and pharmacovigilance platforms market forecast, partnerships, mergers and acquisitions, geographical expansion, and product/service launches, to enhance their presence in the industry.

Accenture Plc - Delivers end-to-end patient safety operations through AI-driven platforms for automated case processing, signal management, and analytics-driven pharmacovigilance workflows.

The industry research and growth report includes detailed analyses of the competitive landscape of the market and information about key companies, including:

  • Accenture Plc
  • Anju Software Inc.
  • ArisGlobal LLC
  • Certara Inc.
  • Clarivate PLC
  • ClinChoice
  • Cognizant Technology Solution
  • Ennov SAS
  • EXTEDO GmbH
  • Genpact Ltd.
  • HCL Technologies Ltd.
  • Infosys Ltd.
  • IQVIA Holdings Inc.
  • Medidata Solutions Inc
  • Navitas Life Sciences
  • Oracle Corp.
  • Saama Technologies Inc.
  • Sorcero Inc.
  • Tata Consultancy Services
  • Veeva Systems Inc.
  • WCG Clinical Inc.
  • Wipro Ltd.

Qualitative and quantitative analysis of companies has been conducted to help clients understand the wider business environment as well as the strengths and weaknesses of key industry players. Data is qualitatively analyzed to categorize companies as pure play, category-focused, industry-focused, and diversified; it is quantitatively analyzed to categorize companies as dominant, leading, strong, tentative, and weak.

Recent Development and News in Ai-driven drug safety and pharmacovigilance platforms market

  • In February 2025, ArisGlobal announced the full integration of a generative AI framework within its LifeSphere safety suite to automate the creation of clinical safety narratives.
  • In March 2025, Oracle Health Sciences released an updated version of its safety cloud platform that utilizes autonomous database technology to provide real-time signal detection across diverse patient populations.
  • In April 2025, IQVIA launched an enhanced vigilance platform that incorporates advanced natural language processing to analyze unstructured data from medical literature and digital patient forums.
  • In April 2025, Google launched a specialized cloud-based suite for life sciences organizations to automate the extraction of safety data from unstructured patient narratives.

Dive into Technavio’s robust research methodology, blending expert interviews, extensive data synthesis, and validated models for unparalleled Ai-driven Drug Safety And Pharmacovigilance Platforms Market insights. See full methodology.

Market Scope
Page number 309
Base year 2025
Historic period 2020-2024
Forecast period 2026-2030
Growth momentum & CAGR Accelerate at a CAGR of 19.9%
Market growth 2026-2030 USD 3103.6 million
Market structure Fragmented
YoY growth 2025-2026(%) 18.7%
Key countries US, Canada, Mexico, Germany, UK, France, Italy, Spain, The Netherlands, China, India, Japan, Australia, South Korea, Indonesia, Saudi Arabia, UAE, Israel, South Africa, Turkey, Brazil, Argentina and Colombia
Competitive landscape Leading Companies, Market Positioning of Companies, Competitive Strategies, and Industry Risks

Request Free Sample

Research Analyst Overview

  • The AI-driven drug safety and pharmacovigilance platforms market is fundamentally shifting from reactive reporting to proactive, predictive safety intelligence. This evolution is driven by the strategic integration of technologies that enable continuous post-market safety surveillance and real-time analysis.
  • A key trend, real-world evidence integration, directly influences boardroom decisions regarding risk management and R&D resource allocation, as it provides a clearer picture of a drug's performance in diverse populations. Leading firms leveraging predictive safety analytics and pharmacovigilance workflow automation have achieved a 30% reduction in the time required to validate new safety signals.
  • This efficiency is critical in a tightly regulated environment. The implementation of end-to-end patient safety systems, supported by automated case processing and AI-driven benefit-risk assessment, is becoming a competitive differentiator. These platforms, which utilize structured safety data formats and pharmacovigilance compliance tools, are essential for managing the entire drug lifecycle safety and ensuring robust regulatory submission automation.

What are the Key Data Covered in this Ai-driven Drug Safety And Pharmacovigilance Platforms Market Research and Growth Report?

  • What is the expected growth of the Ai-driven Drug Safety And Pharmacovigilance Platforms Market between 2026 and 2030?

    • USD 3.10 billion, at a CAGR of 19.9%

  • What segmentation does the market report cover?

    • The report is segmented by Deployment (Cloud-based platforms, On-premises solutions, and Hybrid deployment models), End-user (Pharma and biotech companies, Contract research organizations, Regulatory authorities, and Healthcare providers), Application (Adverse event detection, Risk management, Literature screening, and Regulatory compliance) and Geography (North America, Europe, APAC, Middle East and Africa, South America)

  • Which regions are analyzed in the report?

    • North America, Europe, APAC, Middle East and Africa and South America

  • What are the key growth drivers and market challenges?

    • Increasing volume and complexity of adverse event data, Algorithmic opacity and interpretability barrier

  • Who are the major players in the Ai-driven Drug Safety And Pharmacovigilance Platforms Market?

    • Accenture Plc, Anju Software Inc., ArisGlobal LLC, Certara Inc., Clarivate PLC, ClinChoice, Cognizant Technology Solution, Ennov SAS, EXTEDO GmbH, Genpact Ltd., HCL Technologies Ltd., Infosys Ltd., IQVIA Holdings Inc., Medidata Solutions Inc, Navitas Life Sciences, Oracle Corp., Saama Technologies Inc., Sorcero Inc., Tata Consultancy Services, Veeva Systems Inc., WCG Clinical Inc. and Wipro Ltd.

Market Research Insights

  • The market's dynamics are increasingly shaped by the adoption of sophisticated pharmacovigilance analytics and cloud pharmacovigilance platforms. These technologies are central to improving drug safety automation and operational efficiency. Firms leveraging adverse event reporting systems powered by AI have reported up to a 40% reduction in manual case processing times, directly impacting operational costs.
  • Furthermore, the use of advanced pharmacovigilance trends and analytics for signal detection in pharmacovigilance has demonstrated a 15% improvement in identifying true safety signals compared to traditional statistical methods. This enhancement in accuracy is critical for mitigating risk and ensuring patient safety.
  • The integration of real-world data for pharmacovigilance into these platforms provides a more comprehensive view of a drug's performance, solidifying the move toward proactive, data-driven safety monitoring. This shift is crucial for companies seeking a competitive edge in a highly regulated industry.

We can help! Our analysts can customize this ai-driven drug safety and pharmacovigilance platforms market research report to meet your requirements.

Get in touch

1. Executive Summary

1.1 Market overview

Executive Summary - Chart on Market Overview
Executive Summary - Data Table on Market Overview
Executive Summary - Chart on Global Market Characteristics
Executive Summary - Chart on Market by Geography
Executive Summary - Chart on Market Segmentation by Deployment
Executive Summary - Chart on Market Segmentation by End-user
Executive Summary - Chart on Market Segmentation by Application
Executive Summary - Chart on Incremental Growth
Executive Summary - Data Table on Incremental Growth
Executive Summary - Chart on Company Market Positioning

2. Technavio Analysis

2.1 Analysis of price sensitivity, lifecycle, customer purchase basket, adoption rates, and purchase criteria

2.2 Criticality of inputs and Factors of differentiation

Chart on Overview on criticality of inputs and factors of differentiation

2.3 Factors of disruption

Chart on Overview on factors of disruption

2.4 Impact of drivers and challenges

Chart on Impact of drivers and challenges in 2025 and 2030

3. Market Landscape

3.1 Market ecosystem

Chart on Parent Market
Data Table on - Parent Market

3.2 Market characteristics

Chart on Market characteristics analysis

3.3 Value chain analysis

Chart on Value chain analysis

4. Market Sizing

4.1 Market definition

Data Table on Offerings of companies included in the market definition

4.2 Market segment analysis

Market segments

4.3 Market size 2025

4.4 Market outlook: Forecast for 2025-2030

Chart on Global - Market size and forecast 2025-2030 ($ million)
Data Table on Global - Market size and forecast 2025-2030 ($ million)
Chart on Global Market: Year-over-year growth 2025-2030 (%)
Data Table on Global Market: Year-over-year growth 2025-2030 (%)

5. Historic Market Size

5.1 Global AI-Driven Drug Safety And Pharmacovigilance Platforms Market 2020 - 2024

Historic Market Size - Data Table on Global AI-Driven Drug Safety And Pharmacovigilance Platforms Market 2020 - 2024 ($ million)

5.2 Deployment segment analysis 2020 - 2024

Historic Market Size - Deployment Segment 2020 - 2024 ($ million)

5.3 End-user segment analysis 2020 - 2024

Historic Market Size - End-user Segment 2020 - 2024 ($ million)

5.4 Application segment analysis 2020 - 2024

Historic Market Size - Application Segment 2020 - 2024 ($ million)

5.5 Geography segment analysis 2020 - 2024

Historic Market Size - Geography Segment 2020 - 2024 ($ million)

5.6 Country segment analysis 2020 - 2024

Historic Market Size - Country Segment 2020 - 2024 ($ million)

6. Qualitative Analysis

6.1 Impact of geopolitical conflicts on global AI-driven drug safety and pharmacovigilance platforms market

7. Five Forces Analysis

7.1 Five forces summary

Five forces analysis - Comparison between 2025 and 2030

7.2 Bargaining power of buyers

Bargaining power of buyers - Impact of key factors 2025 and 2030

7.3 Bargaining power of suppliers

Bargaining power of suppliers - Impact of key factors in 2025 and 2030

7.4 Threat of new entrants

Threat of new entrants - Impact of key factors in 2025 and 2030

7.5 Threat of substitutes

Threat of substitutes - Impact of key factors in 2025 and 2030

7.6 Threat of rivalry

Threat of rivalry - Impact of key factors in 2025 and 2030

7.7 Market condition

Chart on Market condition - Five forces 2025 and 2030

8. Market Segmentation by Deployment

8.1 Market segments

Chart on Deployment - Market share 2025-2030 (%)
Data Table on Deployment - Market share 2025-2030 (%)

8.2 Comparison by Deployment

Chart on Comparison by Deployment
Data Table on Comparison by Deployment

8.3 Cloud-based platforms - Market size and forecast 2025-2030

Chart on Cloud-based platforms - Market size and forecast 2025-2030 ($ million)
Data Table on Cloud-based platforms - Market size and forecast 2025-2030 ($ million)
Chart on Cloud-based platforms - Year-over-year growth 2025-2030 (%)
Data Table on Cloud-based platforms - Year-over-year growth 2025-2030 (%)

8.4 On-premises solutions - Market size and forecast 2025-2030

Chart on On-premises solutions - Market size and forecast 2025-2030 ($ million)
Data Table on On-premises solutions - Market size and forecast 2025-2030 ($ million)
Chart on On-premises solutions - Year-over-year growth 2025-2030 (%)
Data Table on On-premises solutions - Year-over-year growth 2025-2030 (%)

8.5 Hybrid deployment models - Market size and forecast 2025-2030

Chart on Hybrid deployment models - Market size and forecast 2025-2030 ($ million)
Data Table on Hybrid deployment models - Market size and forecast 2025-2030 ($ million)
Chart on Hybrid deployment models - Year-over-year growth 2025-2030 (%)
Data Table on Hybrid deployment models - Year-over-year growth 2025-2030 (%)

8.6 Market opportunity by Deployment

Market opportunity by Deployment ($ million)
Data Table on Market opportunity by Deployment ($ million)

9. Market Segmentation by End-user

9.1 Market segments

Chart on End-user - Market share 2025-2030 (%)
Data Table on End-user - Market share 2025-2030 (%)

9.2 Comparison by End-user

Chart on Comparison by End-user
Data Table on Comparison by End-user

9.3 Pharma and biotech companies - Market size and forecast 2025-2030

Chart on Pharma and biotech companies - Market size and forecast 2025-2030 ($ million)
Data Table on Pharma and biotech companies - Market size and forecast 2025-2030 ($ million)
Chart on Pharma and biotech companies - Year-over-year growth 2025-2030 (%)
Data Table on Pharma and biotech companies - Year-over-year growth 2025-2030 (%)

9.4 Contract research organizations - Market size and forecast 2025-2030

Chart on Contract research organizations - Market size and forecast 2025-2030 ($ million)
Data Table on Contract research organizations - Market size and forecast 2025-2030 ($ million)
Chart on Contract research organizations - Year-over-year growth 2025-2030 (%)
Data Table on Contract research organizations - Year-over-year growth 2025-2030 (%)

9.5 Regulatory authorities - Market size and forecast 2025-2030

Chart on Regulatory authorities - Market size and forecast 2025-2030 ($ million)
Data Table on Regulatory authorities - Market size and forecast 2025-2030 ($ million)
Chart on Regulatory authorities - Year-over-year growth 2025-2030 (%)
Data Table on Regulatory authorities - Year-over-year growth 2025-2030 (%)

9.6 Healthcare providers - Market size and forecast 2025-2030

Chart on Healthcare providers - Market size and forecast 2025-2030 ($ million)
Data Table on Healthcare providers - Market size and forecast 2025-2030 ($ million)
Chart on Healthcare providers - Year-over-year growth 2025-2030 (%)
Data Table on Healthcare providers - Year-over-year growth 2025-2030 (%)

9.7 Market opportunity by End-user

Market opportunity by End-user ($ million)
Data Table on Market opportunity by End-user ($ million)

10. Market Segmentation by Application

10.1 Market segments

Chart on Application - Market share 2025-2030 (%)
Data Table on Application - Market share 2025-2030 (%)

10.2 Comparison by Application

Chart on Comparison by Application
Data Table on Comparison by Application

10.3 Adverse event detection - Market size and forecast 2025-2030

Chart on Adverse event detection - Market size and forecast 2025-2030 ($ million)
Data Table on Adverse event detection - Market size and forecast 2025-2030 ($ million)
Chart on Adverse event detection - Year-over-year growth 2025-2030 (%)
Data Table on Adverse event detection - Year-over-year growth 2025-2030 (%)

10.4 Risk management - Market size and forecast 2025-2030

Chart on Risk management - Market size and forecast 2025-2030 ($ million)
Data Table on Risk management - Market size and forecast 2025-2030 ($ million)
Chart on Risk management - Year-over-year growth 2025-2030 (%)
Data Table on Risk management - Year-over-year growth 2025-2030 (%)

10.5 Literature screening - Market size and forecast 2025-2030

Chart on Literature screening - Market size and forecast 2025-2030 ($ million)
Data Table on Literature screening - Market size and forecast 2025-2030 ($ million)
Chart on Literature screening - Year-over-year growth 2025-2030 (%)
Data Table on Literature screening - Year-over-year growth 2025-2030 (%)

10.6 Regulatory compliance - Market size and forecast 2025-2030

Chart on Regulatory compliance - Market size and forecast 2025-2030 ($ million)
Data Table on Regulatory compliance - Market size and forecast 2025-2030 ($ million)
Chart on Regulatory compliance - Year-over-year growth 2025-2030 (%)
Data Table on Regulatory compliance - Year-over-year growth 2025-2030 (%)

10.7 Market opportunity by Application

Market opportunity by Application ($ million)
Data Table on Market opportunity by Application ($ million)

11. Customer Landscape

11.1 Customer landscape overview

Analysis of price sensitivity, lifecycle, customer purchase basket, adoption rates, and purchase criteria

12. Geographic Landscape

12.1 Geographic segmentation

Chart on Market share by geography 2025-2030 (%)
Data Table on Market share by geography 2025-2030 (%)

12.2 Geographic comparison

Chart on Geographic comparison
Data Table on Geographic comparison

12.3 North America - Market size and forecast 2025-2030

Chart on North America - Market size and forecast 2025-2030 ($ million)
Data Table on North America - Market size and forecast 2025-2030 ($ million)
Chart on North America - Year-over-year growth 2025-2030 (%)
Data Table on North America - Year-over-year growth 2025-2030 (%)
Chart on Regional Comparison - North America
Data Table on Regional Comparison - North America

12.3.1 US - Market size and forecast 2025-2030

Chart on US - Market size and forecast 2025-2030 ($ million)
Data Table on US - Market size and forecast 2025-2030 ($ million)
Chart on US - Year-over-year growth 2025-2030 (%)
Data Table on US - Year-over-year growth 2025-2030 (%)

12.3.2 Canada - Market size and forecast 2025-2030

Chart on Canada - Market size and forecast 2025-2030 ($ million)
Data Table on Canada - Market size and forecast 2025-2030 ($ million)
Chart on Canada - Year-over-year growth 2025-2030 (%)
Data Table on Canada - Year-over-year growth 2025-2030 (%)

12.3.3 Mexico - Market size and forecast 2025-2030

Chart on Mexico - Market size and forecast 2025-2030 ($ million)
Data Table on Mexico - Market size and forecast 2025-2030 ($ million)
Chart on Mexico - Year-over-year growth 2025-2030 (%)
Data Table on Mexico - Year-over-year growth 2025-2030 (%)

12.4 Europe - Market size and forecast 2025-2030

Chart on Europe - Market size and forecast 2025-2030 ($ million)
Data Table on Europe - Market size and forecast 2025-2030 ($ million)
Chart on Europe - Year-over-year growth 2025-2030 (%)
Data Table on Europe - Year-over-year growth 2025-2030 (%)
Chart on Regional Comparison - Europe
Data Table on Regional Comparison - Europe

12.4.1 Germany - Market size and forecast 2025-2030

Chart on Germany - Market size and forecast 2025-2030 ($ million)
Data Table on Germany - Market size and forecast 2025-2030 ($ million)
Chart on Germany - Year-over-year growth 2025-2030 (%)
Data Table on Germany - Year-over-year growth 2025-2030 (%)

12.4.2 UK - Market size and forecast 2025-2030

Chart on UK - Market size and forecast 2025-2030 ($ million)
Data Table on UK - Market size and forecast 2025-2030 ($ million)
Chart on UK - Year-over-year growth 2025-2030 (%)
Data Table on UK - Year-over-year growth 2025-2030 (%)

12.4.3 France - Market size and forecast 2025-2030

Chart on France - Market size and forecast 2025-2030 ($ million)
Data Table on France - Market size and forecast 2025-2030 ($ million)
Chart on France - Year-over-year growth 2025-2030 (%)
Data Table on France - Year-over-year growth 2025-2030 (%)

12.4.4 Italy - Market size and forecast 2025-2030

Chart on Italy - Market size and forecast 2025-2030 ($ million)
Data Table on Italy - Market size and forecast 2025-2030 ($ million)
Chart on Italy - Year-over-year growth 2025-2030 (%)
Data Table on Italy - Year-over-year growth 2025-2030 (%)

12.4.5 Spain - Market size and forecast 2025-2030

Chart on Spain - Market size and forecast 2025-2030 ($ million)
Data Table on Spain - Market size and forecast 2025-2030 ($ million)
Chart on Spain - Year-over-year growth 2025-2030 (%)
Data Table on Spain - Year-over-year growth 2025-2030 (%)

12.4.6 The Netherlands - Market size and forecast 2025-2030

Chart on The Netherlands - Market size and forecast 2025-2030 ($ million)
Data Table on The Netherlands - Market size and forecast 2025-2030 ($ million)
Chart on The Netherlands - Year-over-year growth 2025-2030 (%)
Data Table on The Netherlands - Year-over-year growth 2025-2030 (%)

12.5 APAC - Market size and forecast 2025-2030

Chart on APAC - Market size and forecast 2025-2030 ($ million)
Data Table on APAC - Market size and forecast 2025-2030 ($ million)
Chart on APAC - Year-over-year growth 2025-2030 (%)
Data Table on APAC - Year-over-year growth 2025-2030 (%)
Chart on Regional Comparison - APAC
Data Table on Regional Comparison - APAC

12.5.1 China - Market size and forecast 2025-2030

Chart on China - Market size and forecast 2025-2030 ($ million)
Data Table on China - Market size and forecast 2025-2030 ($ million)
Chart on China - Year-over-year growth 2025-2030 (%)
Data Table on China - Year-over-year growth 2025-2030 (%)

12.5.2 India - Market size and forecast 2025-2030

Chart on India - Market size and forecast 2025-2030 ($ million)
Data Table on India - Market size and forecast 2025-2030 ($ million)
Chart on India - Year-over-year growth 2025-2030 (%)
Data Table on India - Year-over-year growth 2025-2030 (%)

12.5.3 Japan - Market size and forecast 2025-2030

Chart on Japan - Market size and forecast 2025-2030 ($ million)
Data Table on Japan - Market size and forecast 2025-2030 ($ million)
Chart on Japan - Year-over-year growth 2025-2030 (%)
Data Table on Japan - Year-over-year growth 2025-2030 (%)

12.5.4 Australia - Market size and forecast 2025-2030

Chart on Australia - Market size and forecast 2025-2030 ($ million)
Data Table on Australia - Market size and forecast 2025-2030 ($ million)
Chart on Australia - Year-over-year growth 2025-2030 (%)
Data Table on Australia - Year-over-year growth 2025-2030 (%)

12.5.5 South Korea - Market size and forecast 2025-2030

Chart on South Korea - Market size and forecast 2025-2030 ($ million)
Data Table on South Korea - Market size and forecast 2025-2030 ($ million)
Chart on South Korea - Year-over-year growth 2025-2030 (%)
Data Table on South Korea - Year-over-year growth 2025-2030 (%)

12.5.6 Indonesia - Market size and forecast 2025-2030

Chart on Indonesia - Market size and forecast 2025-2030 ($ million)
Data Table on Indonesia - Market size and forecast 2025-2030 ($ million)
Chart on Indonesia - Year-over-year growth 2025-2030 (%)
Data Table on Indonesia - Year-over-year growth 2025-2030 (%)

12.6 Middle East and Africa - Market size and forecast 2025-2030

Chart on Middle East and Africa - Market size and forecast 2025-2030 ($ million)
Data Table on Middle East and Africa - Market size and forecast 2025-2030 ($ million)
Chart on Middle East and Africa - Year-over-year growth 2025-2030 (%)
Data Table on Middle East and Africa - Year-over-year growth 2025-2030 (%)
Chart on Regional Comparison - Middle East and Africa
Data Table on Regional Comparison - Middle East and Africa

12.6.1 Saudi Arabia - Market size and forecast 2025-2030

Chart on Saudi Arabia - Market size and forecast 2025-2030 ($ million)
Data Table on Saudi Arabia - Market size and forecast 2025-2030 ($ million)
Chart on Saudi Arabia - Year-over-year growth 2025-2030 (%)
Data Table on Saudi Arabia - Year-over-year growth 2025-2030 (%)

12.6.2 UAE - Market size and forecast 2025-2030

Chart on UAE - Market size and forecast 2025-2030 ($ million)
Data Table on UAE - Market size and forecast 2025-2030 ($ million)
Chart on UAE - Year-over-year growth 2025-2030 (%)
Data Table on UAE - Year-over-year growth 2025-2030 (%)

12.6.3 Israel - Market size and forecast 2025-2030

Chart on Israel - Market size and forecast 2025-2030 ($ million)
Data Table on Israel - Market size and forecast 2025-2030 ($ million)
Chart on Israel - Year-over-year growth 2025-2030 (%)
Data Table on Israel - Year-over-year growth 2025-2030 (%)

12.6.4 South Africa - Market size and forecast 2025-2030

Chart on South Africa - Market size and forecast 2025-2030 ($ million)
Data Table on South Africa - Market size and forecast 2025-2030 ($ million)
Chart on South Africa - Year-over-year growth 2025-2030 (%)
Data Table on South Africa - Year-over-year growth 2025-2030 (%)

12.6.5 Turkey - Market size and forecast 2025-2030

Chart on Turkey - Market size and forecast 2025-2030 ($ million)
Data Table on Turkey - Market size and forecast 2025-2030 ($ million)
Chart on Turkey - Year-over-year growth 2025-2030 (%)
Data Table on Turkey - Year-over-year growth 2025-2030 (%)

12.7 South America - Market size and forecast 2025-2030

Chart on South America - Market size and forecast 2025-2030 ($ million)
Data Table on South America - Market size and forecast 2025-2030 ($ million)
Chart on South America - Year-over-year growth 2025-2030 (%)
Data Table on South America - Year-over-year growth 2025-2030 (%)
Chart on Regional Comparison - South America
Data Table on Regional Comparison - South America

12.7.1 Brazil - Market size and forecast 2025-2030

Chart on Brazil - Market size and forecast 2025-2030 ($ million)
Data Table on Brazil - Market size and forecast 2025-2030 ($ million)
Chart on Brazil - Year-over-year growth 2025-2030 (%)
Data Table on Brazil - Year-over-year growth 2025-2030 (%)

12.7.2 Argentina - Market size and forecast 2025-2030

Chart on Argentina - Market size and forecast 2025-2030 ($ million)
Data Table on Argentina - Market size and forecast 2025-2030 ($ million)
Chart on Argentina - Year-over-year growth 2025-2030 (%)
Data Table on Argentina - Year-over-year growth 2025-2030 (%)

12.7.3 Colombia - Market size and forecast 2025-2030

Chart on Colombia - Market size and forecast 2025-2030 ($ million)
Data Table on Colombia - Market size and forecast 2025-2030 ($ million)
Chart on Colombia - Year-over-year growth 2025-2030 (%)
Data Table on Colombia - Year-over-year growth 2025-2030 (%)

12.8 Market opportunity by geography

Market opportunity by geography ($ million)
Data Tables on Market opportunity by geography ($ million)

13. Drivers, Challenges, and Opportunity

13.1 Market drivers

Increasing volume and complexity of adverse event data
Stringent global regulatory requirements for drug safety
Imperative for operational efficiency and cost reduction

13.2 Market challenges

Algorithmic opacity and interpretability barrier
Interoperability and integration with legacy systems
Shortage of specialized technical and domain expertise

13.3 Impact of drivers and challenges

Impact of drivers and challenges in 2025 and 2030

13.4 Market opportunities

Integration of generative artificial intelligence for narrative generation
Transition toward proactive and real-world evidence monitoring
Emergence of cloud-native and modular SaaS platforms

14. Competitive Landscape

14.1 Overview

14.2

Overview on criticality of inputs and factors of differentiation

14.3 Landscape disruption

Overview on factors of disruption

14.4 Industry risks

Impact of key risks on business

15. Competitive Analysis

15.1 Companies profiled

Companies covered

15.2 Company ranking index

15.3 Market positioning of companies

Matrix on companies position and classification

15.4 Accenture Plc

Accenture Plc - Overview
Accenture Plc - Business segments
Accenture Plc - Key news
Accenture Plc - Key offerings
Accenture Plc - Segment focus
SWOT

15.5 ArisGlobal LLC

ArisGlobal LLC - Overview
ArisGlobal LLC - Product / Service
ArisGlobal LLC - Key offerings
SWOT

15.6 Certara Inc.

Certara Inc. - Overview
Certara Inc. - Business segments
Certara Inc. - Key offerings
Certara Inc. - Segment focus
SWOT

15.7 Cognizant Technology Solution

Cognizant Technology Solution - Overview
Cognizant Technology Solution - Business segments
Cognizant Technology Solution - Key news
Cognizant Technology Solution - Key offerings
Cognizant Technology Solution - Segment focus
SWOT

15.8 Ennov SAS

Ennov SAS - Overview
Ennov SAS - Product / Service
Ennov SAS - Key offerings
SWOT

15.9 EXTEDO GmbH

EXTEDO GmbH - Overview
EXTEDO GmbH - Product / Service
EXTEDO GmbH - Key offerings
SWOT

15.10 Genpact Ltd.

Genpact Ltd. - Overview
Genpact Ltd. - Business segments
Genpact Ltd. - Key news
Genpact Ltd. - Key offerings
Genpact Ltd. - Segment focus
SWOT

15.11 HCL Technologies Ltd.

HCL Technologies Ltd. - Overview
HCL Technologies Ltd. - Business segments
HCL Technologies Ltd. - Key offerings
HCL Technologies Ltd. - Segment focus
SWOT

15.12 Infosys Ltd.

Infosys Ltd. - Overview
Infosys Ltd. - Business segments
Infosys Ltd. - Key news
Infosys Ltd. - Key offerings
Infosys Ltd. - Segment focus
SWOT

15.13 IQVIA Holdings Inc.

IQVIA Holdings Inc. - Overview
IQVIA Holdings Inc. - Business segments
IQVIA Holdings Inc. - Key offerings
IQVIA Holdings Inc. - Segment focus
SWOT

15.14 Medidata Solutions Inc

Medidata Solutions Inc - Overview
Medidata Solutions Inc - Product / Service
Medidata Solutions Inc - Key offerings
SWOT

15.15 Oracle Corp.

Oracle Corp. - Overview
Oracle Corp. - Business segments
Oracle Corp. - Key news
Oracle Corp. - Key offerings
Oracle Corp. - Segment focus
SWOT

15.16 Sorcero Inc.

Sorcero Inc. - Overview
Sorcero Inc. - Product / Service
Sorcero Inc. - Key offerings
SWOT

15.17 Tata Consultancy Services

Tata Consultancy Services - Overview
Tata Consultancy Services - Business segments
Tata Consultancy Services - Key offerings
Tata Consultancy Services - Segment focus
SWOT

15.18 Wipro Ltd.

Wipro Ltd. - Overview
Wipro Ltd. - Business segments
Wipro Ltd. - Key news
Wipro Ltd. - Key offerings
Wipro Ltd. - Segment focus
SWOT

16. Appendix

16.1 Scope of the report

Market definition
Objectives
Notes and caveats

16.2 Inclusions and exclusions checklist

Inclusions checklist
Exclusions checklist

16.3 Currency conversion rates for US$

16.4 Research methodology

16.5 Data procurement

Information sources

16.6 Data validation

16.7 Validation techniques employed for market sizing

16.8 Data synthesis

16.9 360 degree market analysis

16.10 List of abbreviations

Research Methodology

Technavio presents a detailed picture of the market by way of study, synthesis, and summation of data from multiple sources. The analysts have presented the various facets of the market with a particular focus on identifying the key industry influencers. The data thus presented is comprehensive, reliable, and the result of extensive research, both primary and secondary.

INFORMATION SOURCES

Primary sources

  • Manufacturers and suppliers
  • Channel partners
  • Industry experts
  • Strategic decision makers

Secondary sources

  • Industry journals and periodicals
  • Government data
  • Financial reports of key industry players
  • Historical data
  • Press releases

DATA ANALYSIS

Data Synthesis

  • Collation of data
  • Estimation of key figures
  • Analysis of derived insights

Data Validation

  • Triangulation with data models
  • Reference against proprietary databases
  • Corroboration with industry experts

REPORT WRITING

Qualitative

  • Market drivers
  • Market challenges
  • Market trends
  • Five forces analysis

Quantitative

  • Market size and forecast
  • Market segmentation
  • Geographical insights
  • Competitive landscape

Interested in this report?

Get your sample now to see our research methodology and insights!

Download Now

Frequently Asked Questions

Ai-driven Drug Safety And Pharmacovigilance Platforms market growth will increase by USD 3103.6 million during 2026-2030.

The Ai-driven Drug Safety And Pharmacovigilance Platforms market is expected to grow at a CAGR of 19.9% during 2026-2030.

Ai-driven Drug Safety And Pharmacovigilance Platforms market is segmented by Deployment (Cloud-based platforms, On-premises solutions, Hybrid deployment models) End-user (Pharma and biotech companies, Contract research organizations, Regulatory authorities, Healthcare providers) Application (Adverse event detection, Risk management, Literature screening, Regulatory compliance)

Accenture Plc, Anju Software Inc., ArisGlobal LLC, Certara Inc., Clarivate PLC, ClinChoice, Cognizant Technology Solution, Ennov SAS, EXTEDO GmbH, Genpact Ltd., HCL Technologies Ltd., Infosys Ltd., IQVIA Holdings Inc., Medidata Solutions Inc, Navitas Life Sciences, Oracle Corp., Saama Technologies Inc., Sorcero Inc., Tata Consultancy Services, Veeva Systems Inc., WCG Clinical Inc., Wipro Ltd. are a few of the key vendors in the Ai-driven Drug Safety And Pharmacovigilance Platforms market.

North America will register the highest growth rate of 33.6% among the other regions. Therefore, the Ai-driven Drug Safety And Pharmacovigilance Platforms market in North America is expected to garner significant business opportunities for the vendors during the forecast period.

US, Canada, Mexico, Germany, UK, France, Italy, Spain, The Netherlands, China, India, Japan, Australia, South Korea, Indonesia, Saudi Arabia, UAE, Israel, South Africa, Turkey, Brazil, Argentina, Colombia

  • Increasing volume and complexity of adverse event data is the driving factor this market.

The Ai-driven Drug Safety And Pharmacovigilance Platforms market vendors should focus on grabbing business opportunities from the Deployment segment as it accounted for the largest market share in the base year.
RIA - Research AI Assistant
Ask RIA