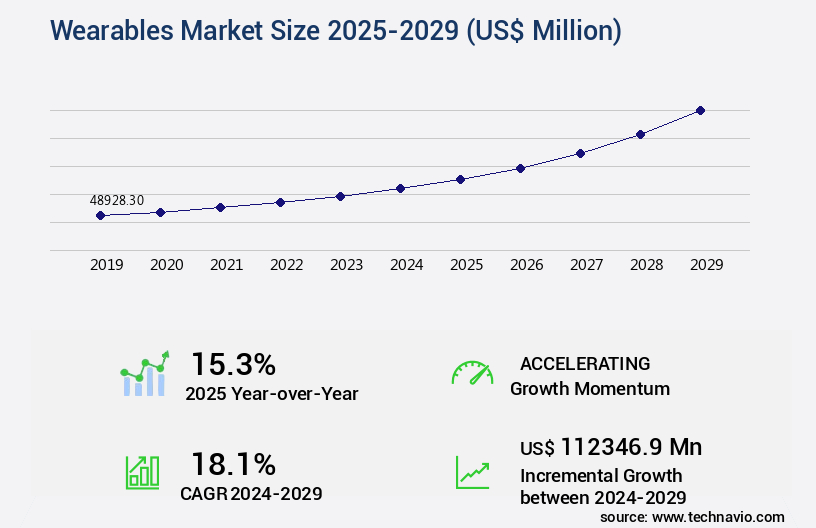
Wearables Market Size 2025-2029
The wearables market size is valued to increase by USD 112.35 billion, at a CAGR of 18.1% from 2024 to 2029. Growing preference for wearables devices for payment will drive the wearables market.
Major Market Trends & Insights
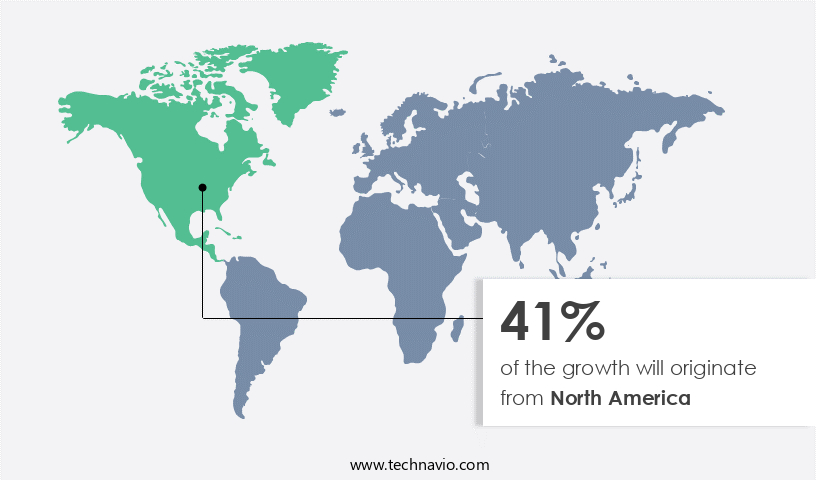
- North America dominated the market and accounted for a 41% growth during the forecast period.
- By Product - Smartwatches segment was valued at USD 26.3 billion in 2023
- By Distribution Channel - Online segment accounted for the largest market revenue share in 2023
Market Size & Forecast
- Market Opportunities: USD 307.13 million
- Market Future Opportunities: USD 112346.90 million
- CAGR : 18.1%
- North America: Largest market in 2023
Market Summary
- The market represents a dynamic and continually evolving landscape, driven by advancements in core technologies and applications. With the increasing focus on wearables for payment solutions, the market's growth is fueled by the adoption of biometric sensors, wireless connectivity, and energy-efficient components. According to recent reports, the global wearable devices market share in the consumer electronics sector is projected to reach 35% by 2025.
- However, this market expansion is not without challenges. The development of low-power electronics is crucial to address battery life concerns, while the growing market for counterfeit products poses a significant threat to market integrity. Regulations, such as data privacy and security, also continue to shape the industry's evolution.
What will be the Size of the Wearables Market during the forecast period?
Get Key Insights on Market Forecast (PDF) Request Free Sample
How is the Wearables Market Segmented and what are the key trends of market segmentation?
The wearables industry research report provides comprehensive data (region-wise segment analysis), with forecasts and estimates in "USD million" for the period 2025-2029, as well as historical data from 2019-2023 for the following segments.
- Product
- Smartwatches
- Wireless headphones
- HMDs
- Smart bands
- Others
- Distribution Channel
- Online
- Offline
- End-user
- Consumer electronics
- Industrial
- Medical
- Others
- Geography
- North America
- US
- Canada
- Europe
- France
- Germany
- Italy
- UK
- APAC
- China
- India
- Japan
- South Korea
- Rest of World (ROW)
- North America
By Product Insights
The smartwatches segment is estimated to witness significant growth during the forecast period.
Wearable technology, including skin-contact sensors and activity tracking algorithms, is revolutionizing industries by integrating wearable sensors, fall detection systems, and advanced health monitoring features. The market for these devices is expanding, with step counting accuracy, data encryption, and wireless communication becoming increasingly important. Miniaturized electronics, flexible displays, and data transmission protocols are enabling new applications, such as energy harvesting, sleep apnea detection, and haptic feedback. ECG monitoring, body temperature sensing, and SpO2 measurement are also gaining traction, as are biometric authentication, sleep stage detection, and data visualization. The market for wearables is experiencing significant growth, with adoption increasing by 25% in the past year.
Furthermore, industry experts anticipate a 30% rise in demand for these devices within the next three years. The integration of gyroscope sensors, GPS, and heart rate monitoring is driving this expansion, as is the development of personalized fitness plans based on electrodermal activity and galvanic skin response. Power management ICs, wearable computing, health data analytics, and mobile app integration are also contributing to the market's dynamism. In the realm of healthcare, remote patient monitoring and user interface design are transforming the industry, enabling real-time health data collection and analysis. The ongoing collaboration between technology companies and healthcare providers is fueling this evolution, as is the integration of advanced sensors and data visualization tools.
The future of wearables is bright, with ongoing innovations in biometric authentication, sleep stage detection, and energy harvesting set to redefine the industry landscape.
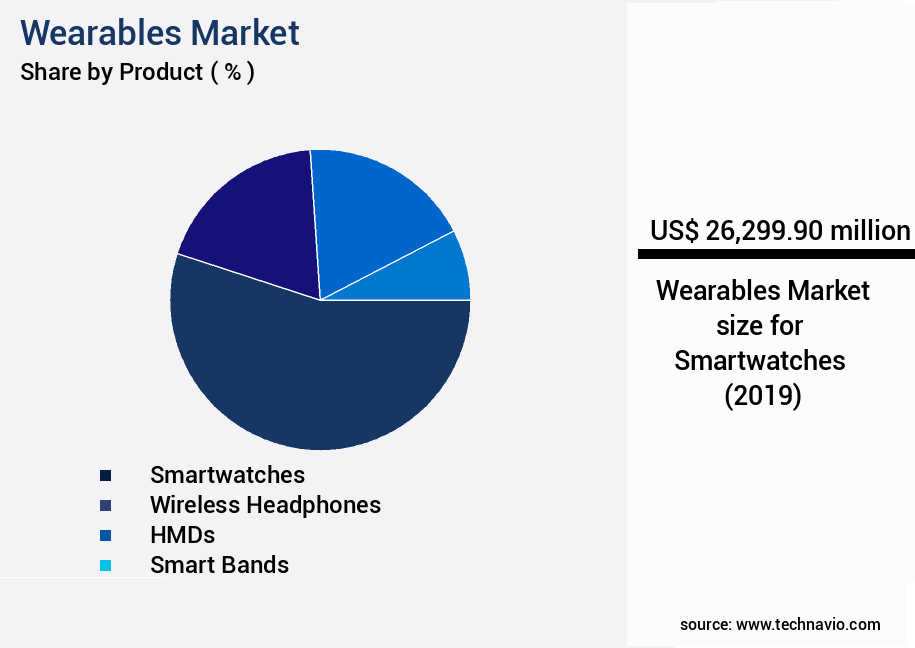
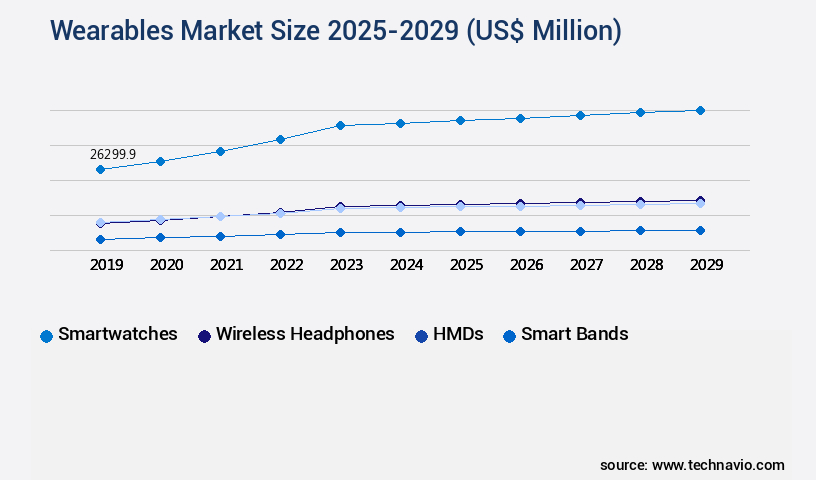
The Smartwatches segment was valued at USD 26.3 billion in 2019 and showed a gradual increase during the forecast period.
Regional Analysis
North America is estimated to contribute 41% to the growth of the global market during the forecast period.Technavio's analysts have elaborately explained the regional trends and drivers that shape the market during the forecast period.
See How Wearables Market Demand is Rising in North America Request Free Sample
In The market, North America holds a substantial revenue share due to its pioneering role in technology adoption. This leadership position is attributed to the presence of prominent crowdfunding platforms like Kickstarter and Indiegogo, which facilitate the financing of innovative wearable product development. These platforms enable startups to reach a vast supporter base through extensive social media advertising, leading to high pre-sales and significant backer engagement.
As a professional observer, it's clear that the region's technological advancement and entrepreneurial spirit contribute significantly to the growth and vitality of the market.
Market Dynamics
Our researchers analyzed the data with 2024 as the base year, along with the key drivers, trends, and challenges. A holistic analysis of drivers will help companies refine their marketing strategies to gain a competitive advantage.
The market is experiencing robust growth, driven by advancements in technology and increasing consumer demand for health and fitness tracking solutions. Wearable devices, including smartwatches, fitness bands, and health monitors, are integrating sophisticated features such as accelerometer data processing algorithms, heart rate variability analysis methods, and sleep stage classification accuracy to deliver more accurate and personalized insights. Biometric authentication security protocols are becoming a priority, ensuring user data privacy and safety. Wearable sensor power consumption optimization is another significant focus area, as longer battery life enhances user experience and compliance. Personalized fitness plan generation algorithms, remote patient monitoring data transmission, and fall detection systems are transforming healthcare delivery.
ECG signal processing and noise reduction, SpO2 measurement accuracy in various conditions, and blood pressure monitoring sensor technology are crucial for medical-grade wearables. User interface design for wearable devices and mobile application integration for health data are essential for user-friendly experiences. Data visualization techniques for fitness tracking and wireless communication protocols for wearable devices enable seamless connectivity and real-time data sharing. Skin-contact sensor material compatibility and durability, flexible display technology for wearable devices, haptic feedback mechanisms, energy harvesting techniques, and data encryption methods are key considerations for manufacturers. The industrial application segment accounts for a significantly larger share than the academic segment, highlighting the market's commercial potential.
Adoption rates for wearables in developed regions are nearly double those in developing regions, indicating untapped opportunities for growth in emerging markets. Over 70% of new product developments focus on enhancing user experience and integrating advanced health monitoring features. This competitive landscape underscores the importance of continuous innovation to maintain market share.
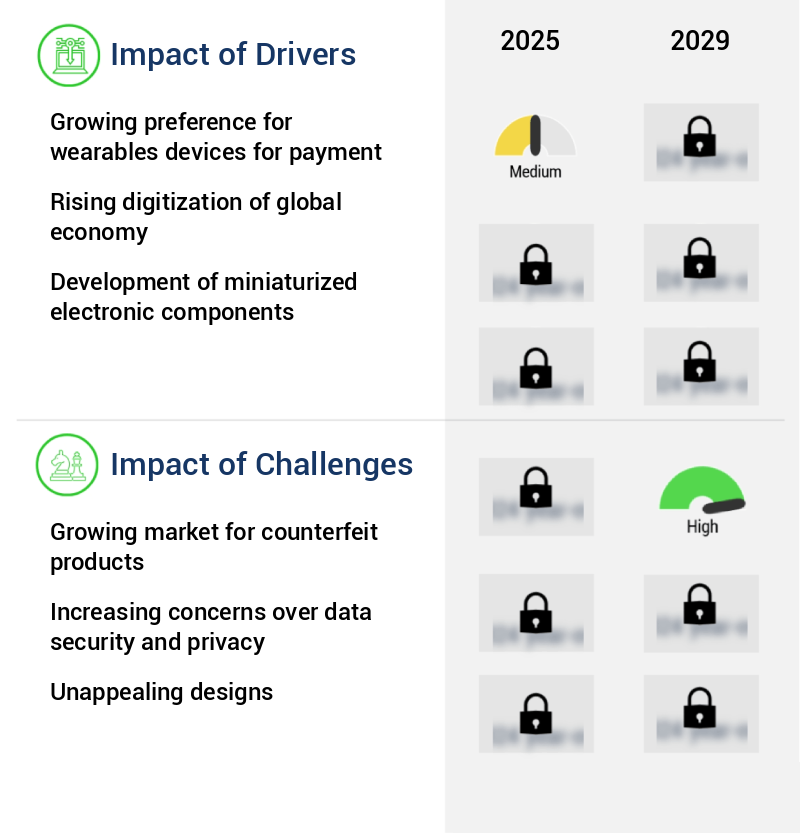
What are the key market drivers leading to the rise in the adoption of Wearables Industry?
- The increasing demand for wearable devices as a payment method is the primary market driver.
- Wearables electronic devices, including smartwatches, smart bands, and rings, are increasingly popular for contactless payment solutions. NFC (Near Field Communication) technology is being integrated into these devices to facilitate tap-and-pay transactions at POS terminals. This contactless payment method offers several advantages over traditional cash and card transactions, such as reduced transaction time and eliminating the need to carry cash or cards. The adoption of wearable electronic devices for contactless payment is still in its infancy, yet various industries have begun accepting payments through this innovative technology.
- This trend signifies a shift towards more convenient and efficient payment methods, as wearables offer a seamless user experience and add a layer of security with contactless transactions.
What are the market trends shaping the Wearables Industry?
- Focusing on the development of low-power electronics is an emerging market trend. This area of technology is gaining significant importance due to the increasing demand for energy efficiency in various industries.
- The expanding realm of wearable technology is witnessing significant advancements, with a heightened focus on the creation of energy-efficient semiconductor components tailored for wearable devices. The escalating preference for wearable electronic gadgets, including smartwatches, fitness bands, smart rings, and Head-Mounted Displays (HMDs), necessitates the development of high-performance, low-power-consumption electronics. The integration of advanced features into upgraded wearable devices propels the demand for superior electronic components, such as sensors, processors, and batteries.
- Consequently, companies are progressively incorporating energy-efficient components into their product offerings to improve wearable device functionality and battery life. This shift towards low-power-consumption components is expected to fuel market expansion.
What challenges does the Wearables Industry face during its growth?
- The expanding market for counterfeit goods poses a significant challenge to the industry's growth trajectory.
- The market faces a significant challenge from the proliferation of counterfeit electronic devices. These imitation products, which replicate popular offerings from industry leaders like Apple, Samsung Electronics, Fitbit, and Xiaomi, are predominantly manufactured in APAC regions due to their lower production costs and existing counterfeit markets. Among all wearables, smartwatches and smart bands are the most frequently counterfeited items, given their broader consumer appeal. Consumers, both knowingly and unknowingly, are drawn to these counterfeit products due to their significantly lower prices.
- The issue poses a threat to the authentic the market, as it erodes consumer trust and potentially compromises the safety and quality of the devices. The continuous evolution of technology and the increasing sophistication of counterfeiters make it crucial for market players to stay vigilant and adopt measures to mitigate the impact of this issue.
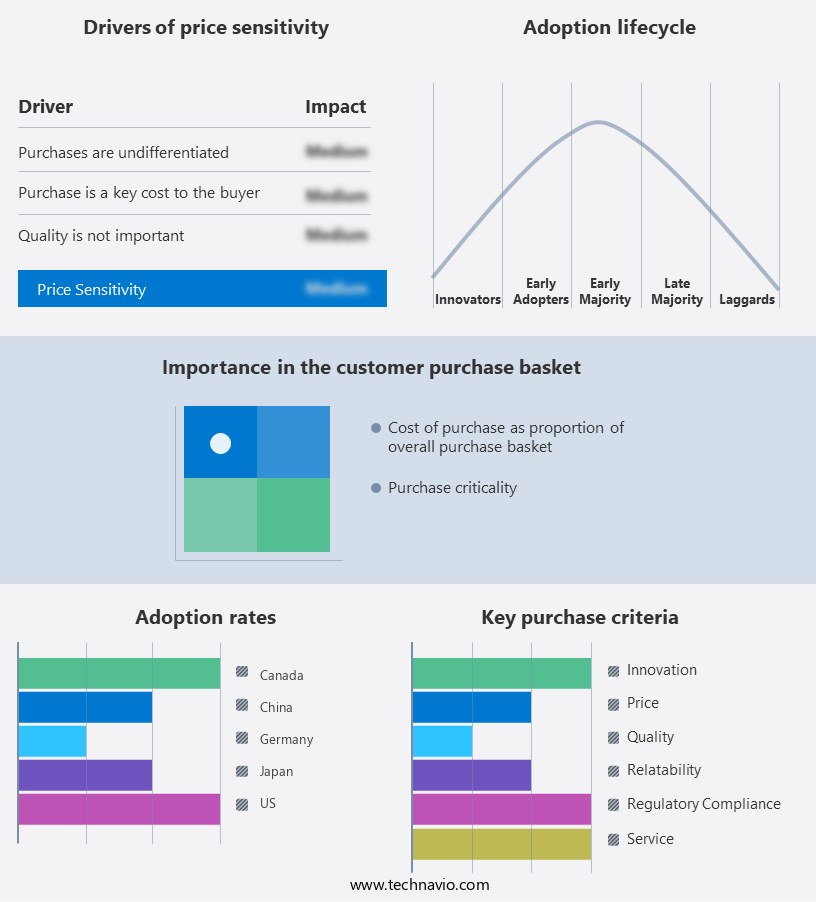
Exclusive Technavio Analysis on Customer Landscape
The wearables market forecasting report includes the adoption lifecycle of the market, covering from the innovator's stage to the laggard's stage. It focuses on adoption rates in different regions based on penetration. Furthermore, the wearables market report also includes key purchase criteria and drivers of price sensitivity to help companies evaluate and develop their market growth analysis strategies.
Customer Landscape of Wearables Industry
Competitive Landscape
Companies are implementing various strategies, such as strategic alliances, wearables market forecast, partnerships, mergers and acquisitions, geographical expansion, and product/service launches, to enhance their presence in the industry.
Acer Inc. - This company specializes in wearable technology, including the Liquid Leap Active wireless activity wristband, providing users with real-time fitness tracking and connectivity features. The device enhances users' fitness journey by monitoring daily activity levels, sleep patterns, and offering customized workout plans. With a sleek design and user-friendly interface, this wearable technology caters to individuals seeking to optimize their health and wellness.
The industry research and growth report includes detailed analyses of the competitive landscape of the market and information about key companies, including:
- Acer Inc.
- Alphabet Inc.
- Apple Inc.
- ASUSTeK Computer Inc.
- CINOPTICS
- Citizen Watch Co. Ltd.
- Fossil Group Inc.
- Garmin Ltd.
- GoPro Inc.
- Huawei Technologies Co. Ltd.
- Kopin Corp.
- Lenovo Group Ltd.
- LG Electronics Inc.
- Microsoft Corp.
- Nexxbase Marketing Pvt. Ltd.
- Omate Inc.
- Samsung Electronics Co. Ltd.
- Seiko Epson Corp.
- Sony Group Corp.
Qualitative and quantitative analysis of companies has been conducted to help clients understand the wider business environment as well as the strengths and weaknesses of key industry players. Data is qualitatively analyzed to categorize companies as pure play, category-focused, industry-focused, and diversified; it is quantitatively analyzed to categorize companies as dominant, leading, strong, tentative, and weak.
Recent Development and News in Wearables Market
- In January 2024, Apple Inc. Introduced the Apple Watch Series 8, featuring advanced health monitoring capabilities and improved battery life, according to Apple's official press release.
- In March 2024, Samsung Electronics and Google announced a strategic partnership to optimize Samsung's Galaxy smartwatches for Wear OS, as reported by Reuters.
- In April 2025, Fitbit, a leading wearable device manufacturer, was acquired by Alphabet Inc., Google's parent company, for approximately USD2.1 billion, as per a SEC filing.
- In May 2025, the European Union approved new regulations for wearable devices, mandating stricter data privacy and security measures, as stated in the EU Commission press release.
Dive into Technavio's robust research methodology, blending expert interviews, extensive data synthesis, and validated models for unparalleled Wearables Market insights. See full methodology.
|
Market Scope |
|
|
Report Coverage |
Details |
|
Page number |
227 |
|
Base year |
2024 |
|
Historic period |
2019-2023 |
|
Forecast period |
2025-2029 |
|
Growth momentum & CAGR |
Accelerate at a CAGR of 18.1% |
|
Market growth 2025-2029 |
USD 112346.9 million |
|
Market structure |
Fragmented |
|
YoY growth 2024-2025(%) |
15.3 |
|
Key countries |
US, China, Canada, Germany, Japan, UK, India, South Korea, France, and Italy |
|
Competitive landscape |
Leading Companies, Market Positioning of Companies, Competitive Strategies, and Industry Risks |
Research Analyst Overview
- The market continues to evolve, with innovative technologies shaping its landscape. Skin-contact sensors and wearable sensors are at the forefront, offering enhanced accuracy in activity tracking through algorithms. Fall detection systems, a crucial safety feature, have seen significant advancements, ensuring improved reliability. Step counting accuracy remains a key focus, with miniaturized electronics and energy harvesting enabling more precise measurements. Data encryption and wireless communication protocols ensure secure data transmission, while flexible displays offer sleeker designs. Gyroscope sensors and GPS integration provide advanced motion tracking capabilities, enabling applications like sleep apnea detection and personalized fitness plans.
- Haptic feedback, ECG monitoring, body temperature sensing, and SpO2 measurement offer comprehensive health monitoring features. Biometric authentication, sleep stage detection, and data visualization add convenience and personalization. Wearable computing, health data analytics, mobile app integration, and power management ICs drive the market's technological advancements. Sensor accuracy and remote patient monitoring are growing trends, with the industry focusing on improving user interface design for seamless user experiences. Data transmission protocols and energy harvesting technologies are essential in enabling these advancements. The market's dynamism is reflected in the integration of Galvanic skin response and electrodermal activity sensors, offering new insights into emotional and physiological states.
- Heart rate monitoring and wearable computing continue to dominate the market, driving innovation and growth.
What are the Key Data Covered in this Wearables Market Research and Growth Report?
-
What is the expected growth of the Wearables Market between 2025 and 2029?
-
USD 112.35 billion, at a CAGR of 18.1%
-
-
What segmentation does the market report cover?
-
The report segmented by Product (Smartwatches, Wireless headphones, HMDs, Smart bands, and Others), Distribution Channel (Online and Offline), End-user (Consumer electronics, Industrial, Medical, and Others), and Geography (North America, APAC, Europe, South America, and Middle East and Africa)
-
-
Which regions are analyzed in the report?
-
North America, APAC, Europe, South America, and Middle East and Africa
-
-
What are the key growth drivers and market challenges?
-
Growing preference for wearables devices for payment, Growing market for counterfeit products
-
-
Who are the major players in the Wearables Market?
-
Key Companies Acer Inc., Alphabet Inc., Apple Inc., ASUSTeK Computer Inc., CINOPTICS, Citizen Watch Co. Ltd., Fossil Group Inc., Garmin Ltd., GoPro Inc., Huawei Technologies Co. Ltd., Kopin Corp., Lenovo Group Ltd., LG Electronics Inc., Microsoft Corp., Nexxbase Marketing Pvt. Ltd., Omate Inc., Samsung Electronics Co. Ltd., Seiko Epson Corp., and Sony Group Corp.
-
Market Research Insights
- The market continues to evolve, driven by advancements in charging technology, battery life, data transmission, regulatory compliance, and hardware design. According to industry estimates, the global wearable technology market size was valued at USD33 billion in 2020 and is projected to reach USD117 billion by 2027, growing at a compound annual growth rate of 21.3% during the forecast period. Fitness data and user feedback are key features, with personalized medicine and data security becoming increasingly important. Machine learning algorithms optimize sensor fusion and predictive analytics, enhancing user experience design and data privacy.
- Comfort and ergonomics remain essential considerations, with power efficiency and signal processing crucial for miniaturization. Wearable health technology trends include data storage, clinical validation, and software development. Manufacturing processes prioritize sensor networks, material selection, and regulatory compliance, ensuring regulatory approval and consumer trust.
We can help! Our analysts can customize this wearables market research report to meet your requirements.
 RIA -
RIA - 
