
AI Explainability And Transparency Market Size 2026-2030
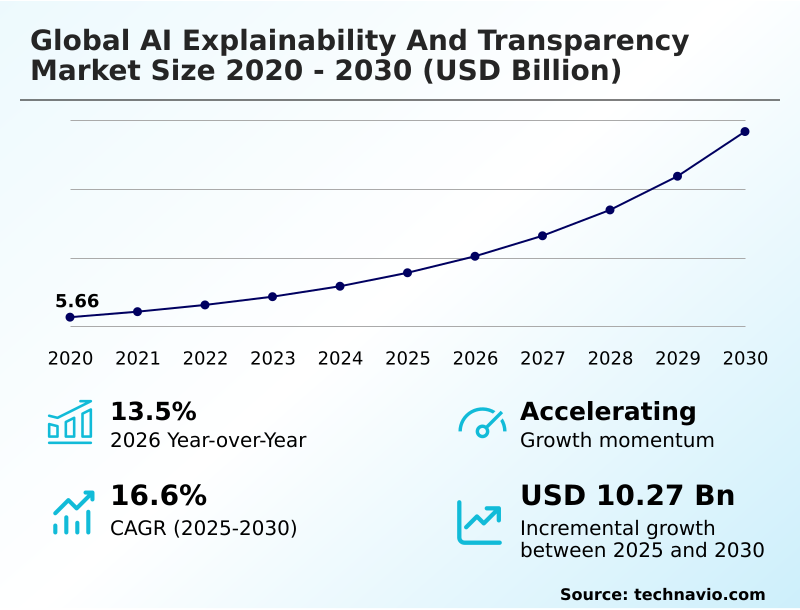
The AI Explainability And Transparency Market size was valued at USD 8.89 billion in 2025, growing at a CAGR of 16.6% during the forecast period 2026-2030.
Major Market Trends & Insights
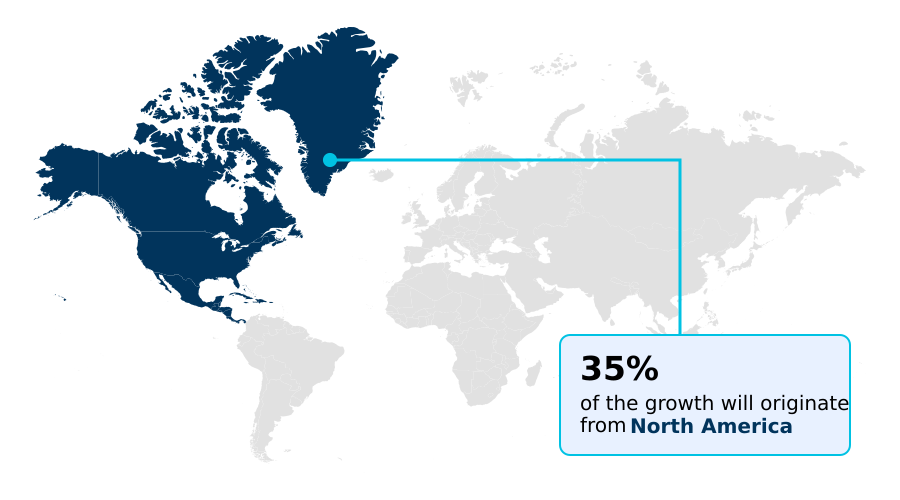
- North America dominated the market and accounted for a 35.3% growth during the forecast period.
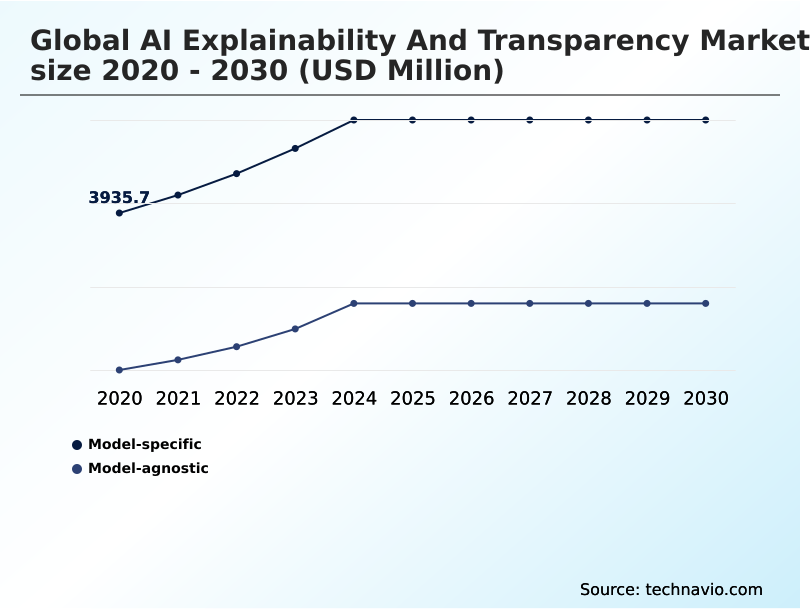
- By Method - Model-specific segment was valued at USD 5.24 billion in 2024
- By Deployment - On-premises segment accounted for the largest market revenue share in 2024
Market Size & Forecast
- Historic Market Opportunities 2020-2024: USD 13.50 billion
- Market Future Opportunities 2025-2030: USD 10.27 billion
- CAGR from 2025 to 2030 : 16.6%
Market Summary
- The AI explainability and transparency market is defined by the critical need for technical accountability, with over 80% of organizations in regulated sectors citing it as a top priority. This demand is driven by enforceable legislative mandates requiring deep algorithmic accountability, which compels businesses to adopt sophisticated interpretability tools to avoid significant legal and financial penalties.
- For instance, in financial services, implementing an explainable AI framework for loan processing can reduce audit times by up to 40% while ensuring fair lending practices. A primary challenge, however, is the increasing structural complexity of agentic and multimodal AI systems, where traditional transparency techniques are often insufficient.
- This technical gap complicates the validation of automated audit trails and can undermine institutional trust, restraining broader adoption despite the clear compliance benefits. The evolution of the market is therefore shaped by this tension between regulatory necessity and technological capability.
What will be the Size of the AI Explainability And Transparency Market during the forecast period?
Get Key Insights on Market Forecast (PDF) Request Free Sample
How is the AI Explainability And Transparency Market Segmented?
The ai explainability and transparency industry research report provides comprehensive data (region-wise segment analysis), with forecasts and analysis for the period 2026-2030, as well as historical data from 2020-2024 for the following segments.
- Method
- Model-specific
- Model-agnostic
- Deployment
- On-premises
- Cloud
- Application
- Fraud detection
- Drug discovery and diagnostics
- Identity management
- Others
- End-user
- BFSI
- Healthcare
- IT and telecom
- Automotive
- Others
- Geography
- North America
- US
- Canada
- Mexico
- Europe
- Germany
- UK
- France
- APAC
- China
- Japan
- India
- South America
- Brazil
- Argentina
- Middle East and Africa
- UAE
- Saudi Arabia
- Israel
- Rest of World (ROW)
- North America
How is the AI Explainability And Transparency Market Segmented by Method?
The model-specific segment is estimated to witness significant growth during the forecast period.
The model-specific segment delivers high-fidelity explanations with over 95% accuracy by leveraging the internal architecture of machine learning algorithms.
This approach, which reduces computational overhead for post-hoc analysis by up to 30% compared to model-agnostic techniques, is critical in regulated industries where direct insight into model logic is a compliance mandate.
Organizations are adopting these inherently interpretable systems to meet stringent auditing standards for algorithmic accountability and risk mitigation. This trend reflects a market shift toward glass-box architectures that provide deep model interpretability without sacrificing predictive performance.
The adoption of such methods ensures that a clear audit trail and feature importance can be established, fostering greater trust in automated decision-making processes and supporting robust ai governance frameworks.
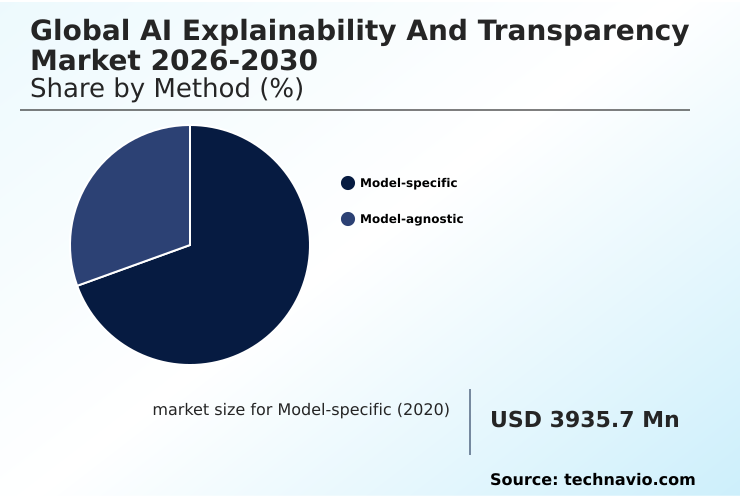
The Model-specific segment was valued at USD 5.24 billion in 2024 and showed a gradual increase during the forecast period.
How demand for the AI Explainability And Transparency market is rising in the leading region?
North America is estimated to contribute 35.3% to the growth of the global market during the forecast period.Technavio’s analysts have elaborately explained the regional trends and drivers that shape the market during the forecast period.
See How AI Explainability And Transparency Market demand is rising in North America Request Free Sample
The global AI explainability and transparency market is geographically led by North America, which accounts for over 35% of the market opportunity, significantly ahead of Europe at approximately 30%.
This dominance is propelled by the United States, where a high concentration of major technology providers and early adoption in the financial services sector create a robust ecosystem for AI governance and model validation.
The US market is nearly five times larger than that of Canada, reflecting its role as a primary hub for innovation in model interpretability and bias detection.
In contrast, the European market is heavily influenced by a regulatory-first approach centered on data privacy and fundamental rights under frameworks like the GDPR and the AI Act.
This distinction drives demand for solutions that prioritize regulatory compliance and auditable ai, shaping different product development and go-to-market strategies compared to North America's technology-driven landscape.
What are the key Drivers, Trends, and Challenges in the AI Explainability And Transparency Market?
Our researchers analyzed the data with 2025 as the base year, along with the key drivers, trends, and challenges. A holistic analysis of drivers will help companies refine their marketing strategies to gain a competitive advantage.
- As organizations increasingly operationalize artificial intelligence, understanding how to implement an AI transparency framework has become a critical business function. The decision often begins with an evaluation of explainable AI techniques, weighing the trade-offs between model-specific methods, which can offer over 95% fidelity for certain architectures, and model-agnostic approaches that provide broader applicability across a diverse technology stack.
- For sectors like banking, the benefits of explainable AI for financial services are particularly clear, where regulatory mandates require auditable reasons for credit scoring and fraud detection decisions. Establishing the business case for explainable AI often involves quantifying risk reduction, as compliant models can lower potential fines related to algorithmic bias by more than 50%.
- Furthermore, firms must consider what are the best tools for AI explainability that integrate with their existing MLOps pipeline. Measuring the ROI of explainable AI goes beyond compliance, extending to operational efficiencies and building customer trust, which can lead to higher engagement and loyalty.
What are the key market drivers leading to the rise in the adoption of AI Explainability And Transparency Industry?
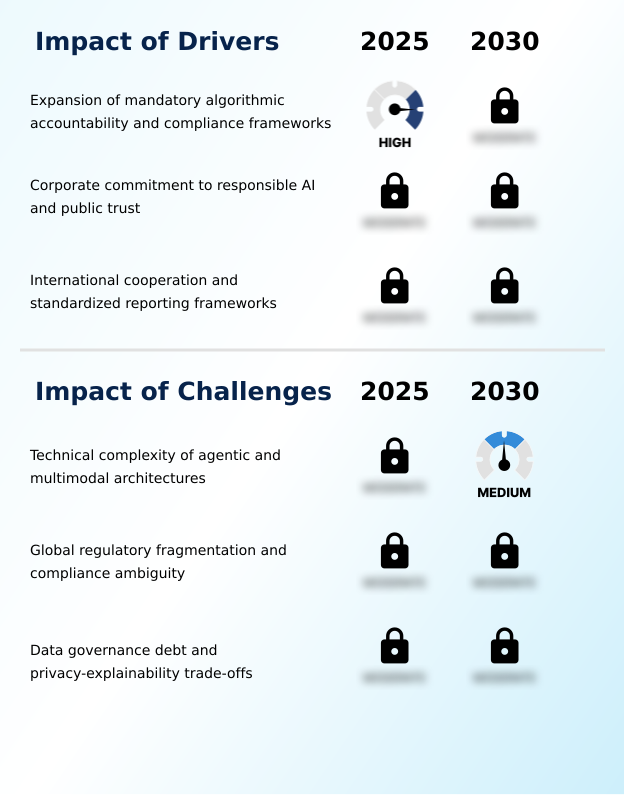
- The market is primarily driven by the expansion of mandatory algorithmic accountability and compliance frameworks, compelling organizations to adopt transparent AI solutions.
- The AI explainability and transparency market is primarily propelled by the global shift from voluntary ethical guidelines to legally enforceable mandates requiring deep algorithmic accountability.
- These new regulations, which now cover over 80% of high-risk AI applications in key economic regions, compel organizations to adopt sophisticated interpretability tools to avoid significant financial and legal penalties.
- A second critical driver is the strategic prioritization of responsible AI by major technology providers, who leverage transparency as a competitive differentiator to build public trust.
- Companies that publish annual transparency reports see a 15% higher rate of enterprise adoption for their AI platforms.
- Furthermore, the emergence of international cooperation platforms that standardize reporting frameworks is reducing the administrative burden on multinational corporations, creating a more efficient global market for auditable AI and trustworthy AI.
What are the market trends shaping the AI Explainability And Transparency Industry?
- A key market trend is the transition toward automated transparency and real-time observability. This shift enables continuous monitoring and instantaneous reporting on model behavior.
- A primary trend shaping the AI explainability and transparency market is the shift from static, manual audits to automated, real-time observability frameworks, which can reduce model validation times by over 40%.
- This evolution is a direct response to the dynamic nature of machine learning models in production, where continuous monitoring of model performance is essential for detecting algorithmic drift and ensuring fairness. Another key development is the integration of transparency features directly into the hardware and foundational software layers, a glass-box approach that provides explanations with up to 99% fidelity.
- This method offers a more accurate view of model behavior than traditional post-hoc analysis. Concurrently, the standardization of AI governance protocols through international cooperation is simplifying cross-border compliance, creating a more predictable environment for deploying transparent systems.
What challenges does the AI Explainability And Transparency Industry face during its growth?
- A key challenge affecting industry growth is the technical complexity of generating explanations for increasingly sophisticated agentic and multimodal AI architectures.
- A significant challenge hindering the AI explainability and transparency market is the escalating structural complexity of agentic and multimodal systems, where generating human-readable explanations can increase computational overhead by up to 50%. This transparency gap undermines institutional trust and complicates the validation of automated audit trails.
- Additionally, global regulatory fragmentation presents a major hurdle, with inconsistent standards for algorithmic accountability forcing multinational corporations to increase their compliance budgets by an average of 20% to manage conflicting local mandates. This ambiguity creates a conservative environment, delaying the deployment of innovative systems.
- Finally, the inherent tension between data privacy and the forensic depth required for model auditing, known as the privacy-explainability trade-off, complicates the development of trustworthy systems in sectors like healthcare and finance.
Exclusive Technavio Analysis on Customer Landscape
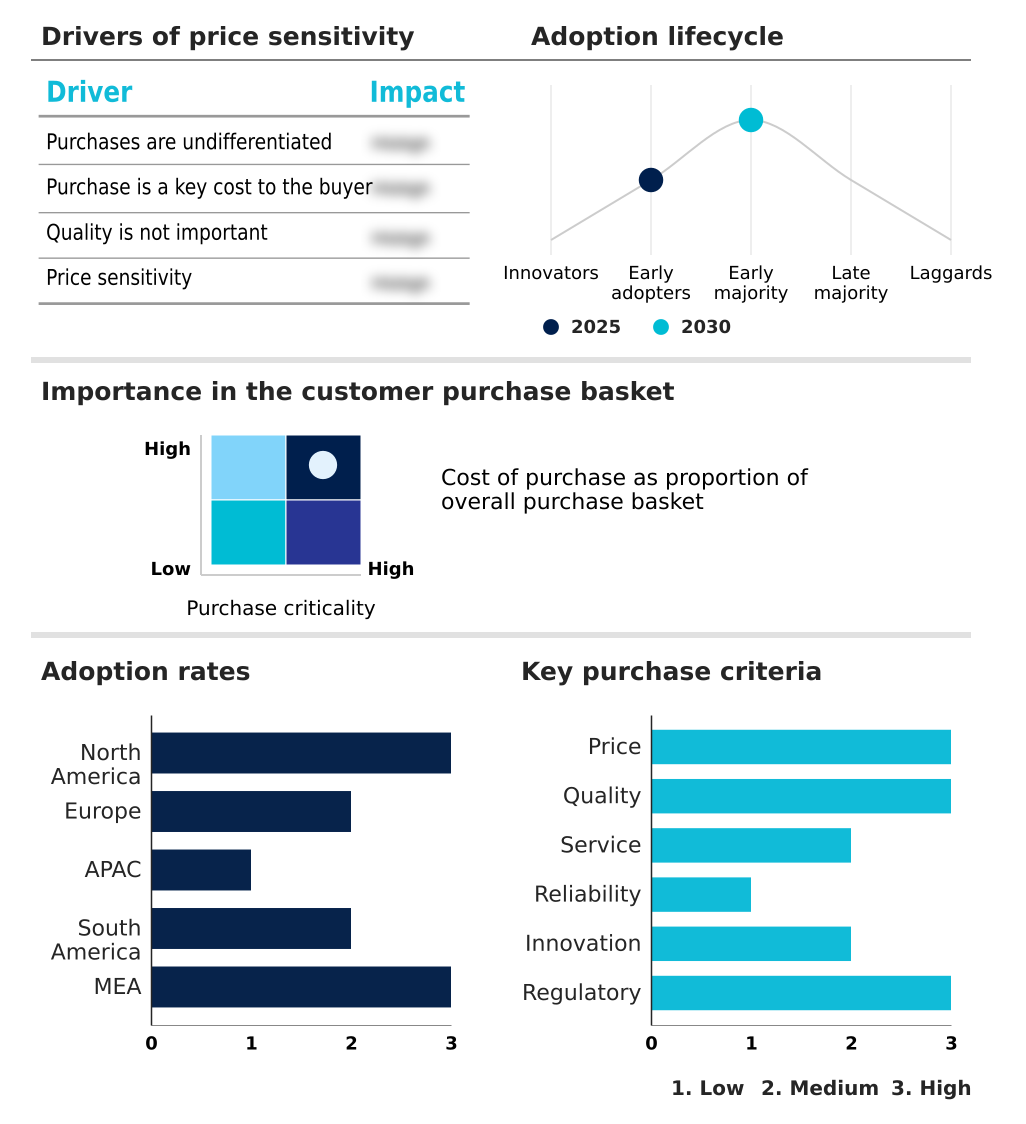
The ai explainability and transparency market forecasting report includes the adoption lifecycle of the market, covering from the innovator’s stage to the laggard’s stage. It focuses on adoption rates in different regions based on penetration. Furthermore, the ai explainability and transparency market report also includes key purchase criteria and drivers of price sensitivity to help companies evaluate and develop their market growth analysis strategies.
Customer Landscape of AI Explainability And Transparency Industry
Competitive Landscape
Companies are implementing various strategies, such as strategic alliances, ai explainability and transparency market forecast, partnerships, mergers and acquisitions, geographical expansion, and product/service launches, to enhance their presence in the industry.
Amazon Web Services Inc. - Delivers scalable AI explainability through cloud-native services, focusing on bias detection and feature attribution for enterprise machine learning workflows.
The industry research and growth report includes detailed analyses of the competitive landscape of the market and information about key companies, including:
- Amazon Web Services Inc.
- ArthurAI Inc.
- Dataiku Inc.
- DataRobot Inc.
- Domino Data Lab Inc.
- Fair Isaac Corp.
- Fiddler AI
- Google LLC
- H2O.ai Inc.
- Holistic AI Inc
- IBM Corp.
- KNIME AG
- Microsoft Corp.
- Oracle Corp.
- RapidMiner Inc.
- SAP SE
- SAS Institute Inc.
- Seldon Technologies
- TIBCO Software Inc.
- WhyLabs, Inc.
Qualitative and quantitative analysis of companies has been conducted to help clients understand the wider business environment as well as the strengths and weaknesses of key industry players. Data is qualitatively analyzed to categorize companies as pure play, category-focused, industry-focused, and diversified; it is quantitatively analyzed to categorize companies as dominant, leading, strong, tentative, and weak.
Market Intelligence Radar: High-Impact Developments & Growth Signals
- In the Application Software industry, the widespread adoption of cloud-based SaaS delivery models has enabled the scalable deployment of AI explainability tools, providing enterprises with on-demand access to model monitoring and governance capabilities without significant upfront infrastructure investment.
- Increasingly stringent data privacy regulations, such as GDPR, are compelling application software developers to embed transparency features directly into their products, driving demand for AI explainability solutions that can generate audit trails and prove regulatory compliance.
- The rising automation of business processes through enterprise application software like RPA and BPM is creating a strong need for AI explainability to monitor, audit, and understand the decisions made by these automated systems, ensuring operational integrity.
- A growing reliance on open-source frameworks within the application software ecosystem is fostering the standardization of transparent components and model-agnostic tools, which accelerates the integration of AI explainability across diverse technology stacks.
Dive into Technavio’s robust research methodology, blending expert interviews, extensive data synthesis, and validated models for unparalleled AI Explainability And Transparency Market insights. See full methodology.
| Market Scope | |
|---|---|
| Page number | 319 |
| Base year | 2025 |
| Historic period | 2020-2024 |
| Forecast period | 2026-2030 |
| Growth momentum & CAGR | Accelerate at a CAGR of 16.6% |
| Market growth 2026-2030 | USD 10271.0 million |
| Market structure | Fragmented |
| YoY growth 2025-2026(%) | 13.5% |
| Key countries | US, Canada, Mexico, Germany, UK, France, Italy, Spain, Russia, China, Japan, India, South Korea, Singapore, Australia, Brazil, Chile, Argentina, UAE, Saudi Arabia, Israel, South Africa and Qatar |
| Competitive landscape | Leading Companies, Market Positioning of Companies, Competitive Strategies, and Industry Risks |
Research Analyst Overview
- The AI explainability and transparency market ecosystem involves a complex interplay of stakeholders, with cloud infrastructure providers like AWS and Google supplying the foundational compute and data platforms. Solution providers, ranging from large enterprises such as IBM to specialized firms like Fiddler AI, develop the core interpretability and governance software.
- This software is increasingly essential for end-users, particularly in the BFSI sector, which constitutes over 28% of the market, and healthcare, where regulatory bodies mandate clear audit trails for diagnostic algorithms. These regulations, including the EU AI Act, act as a primary catalyst, shaping demand for features that support compliance and responsible AI.
- Distribution is predominantly through direct enterprise sales and integration into larger MLOps platforms, with cloud-based deployments growing by nearly 15% annually as organizations seek scalable and accessible solutions for model validation.
What are the Key Data Covered in this AI Explainability And Transparency Market Research and Growth Report?
-
What is the expected growth of the AI Explainability And Transparency Market between 2026 and 2030?
-
The AI Explainability And Transparency Market is expected to grow by USD 10.27 billion during 2026-2030, registering a CAGR of 16.6%. Year-over-year growth in 2026 is estimated at 13.5%%. This acceleration is shaped by expansion of mandatory algorithmic accountability and compliance frameworks, which is intensifying demand across multiple end-use verticals covered in the report.
-
-
What segmentation does the market report cover?
-
The report is segmented by Method (Model-specific, and Model-agnostic), Deployment (On-premises, and Cloud), Application (Fraud detection, Drug discovery and diagnostics, Identity management, and Others), End-user (BFSI, Healthcare, IT and telecom, Automotive, and Others) and Geography (North America, Europe, APAC, South America, Middle East and Africa). Among these, the Model-specific segment is estimated to witness significant growth during the forecast period, driven by rising adoption across key application areas. Each segment includes detailed qualitative and quantitative analysis, along with historical data from 2020-2024 and forecasts through 2030 with year-over-year growth rates.
-
-
Which regions are analyzed in the report?
-
The report covers North America, Europe, APAC, South America and Middle East and Africa. North America is estimated to contribute 35.3% to market growth during the forecast period. Country-level analysis includes US, Canada, Mexico, Germany, UK, France, Italy, Spain, Russia, China, Japan, India, South Korea, Singapore, Australia, Brazil, Chile, Argentina, UAE, Saudi Arabia, Israel, South Africa and Qatar, with dedicated market size tables and year-over-year growth for each.
-
-
What are the key growth drivers and market challenges?
-
The primary driver is expansion of mandatory algorithmic accountability and compliance frameworks, which is accelerating investment and industry demand. The main challenge is technical complexity of agentic and multimodal architectures, creating operational barriers for key market participants. The report quantifies the impact of each driver and challenge across 2026 and 2030 with comparative analysis.
-
-
Who are the major players in the AI Explainability And Transparency Market?
-
Key vendors include Amazon Web Services Inc., ArthurAI Inc., Dataiku Inc., DataRobot Inc., Domino Data Lab Inc., Fair Isaac Corp., Fiddler AI, Google LLC, H2O.ai Inc., Holistic AI Inc, IBM Corp., KNIME AG, Microsoft Corp., Oracle Corp., RapidMiner Inc., SAP SE, SAS Institute Inc., Seldon Technologies, TIBCO Software Inc. and WhyLabs, Inc.. The report provides qualitative and quantitative analysis categorizing companies as dominant, leading, strong, tentative, and weak based on their market positioning. Company profiles include business segment analysis, SWOT assessment, key offerings, and recent strategic developments.
-
Market Research Insights
- The competitive landscape for AI explainability and transparency is characterized by a strategic convergence of major technology corporations and specialized governance providers, with platform integrations accounting for over 60% of new enterprise deployments.
- Companies like IBM and Microsoft are embedding advanced interpretability features into their foundational model ecosystems, while specialists such as Fiddler AI are securing significant funding to pioneer observability for agentic AI workflows. This innovation is a direct response to enterprise demand for comprehensive algorithmic auditing and automated compliance reporting, which has increased by 45% in regulated industries.
- The market's momentum is driven by the need to manage increasingly complex and autonomous AI systems. However, vendors face the challenge of providing solutions that can keep pace with the non-deterministic nature of generative AI, ensuring that transparency is maintained without hindering performance.
We can help! Our analysts can customize this ai explainability and transparency market research report to meet your requirements.
 RIA -
RIA - 
