
Ai For Supply Chain Risk Intelligence Platforms Market Size and Growth Forecast 2026-2030
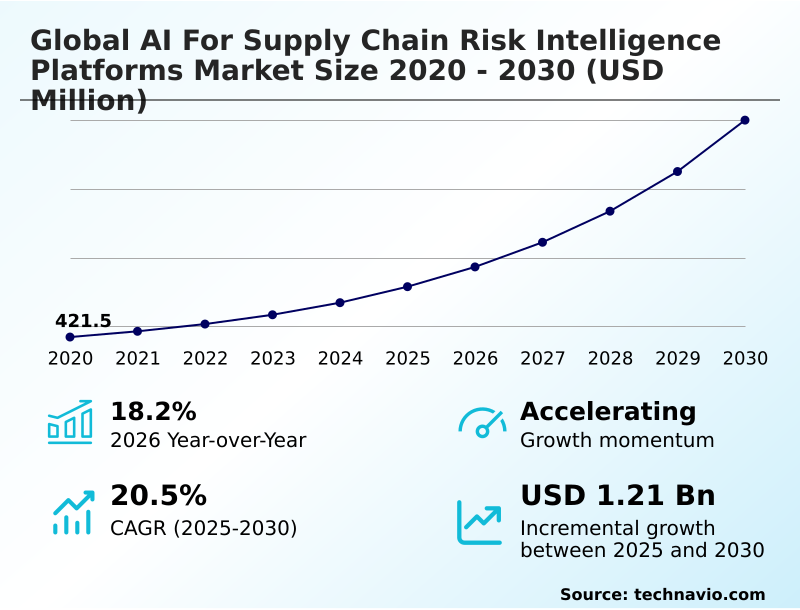
The Ai For Supply Chain Risk Intelligence Platforms Market size was valued at USD 787.8 million in 2025 growing at a CAGR of 20.5% during the forecast period 2026-2030.
North America accounts for 39.7% of incremental growth during the forecast period. The Software segment by Component was valued at USD 482.5 million in 2024, while the Machine learning segment holds the largest revenue share by Technology.
The market is projected to grow by USD 1.58 billion from 2020 to 2030, with USD 1.21 billion of the growth expected during the forecast period of 2025 to 2030.
Get Key Insights on Market Forecast (PDF) Request Free Sample
Ai For Supply Chain Risk Intelligence Platforms Market Overview
The AI for supply chain risk intelligence platforms market is defined by a fundamental shift from reactive to proactive resilience strategies, with the market showing an 18.2% year-over-year growth. Organizations are leveraging advanced technologies for a complete supplier stability assessment, moving beyond simple monitoring to predictive failure analysis. For instance, an automotive electronics manufacturer facing semiconductor shortages can deploy a platform using machine learning for demand forecasting to model the impact of a potential fab shutdown in a specific region, allowing it to pre-emptively secure alternative capacity. This level of real-time end-to-end visibility is critical. These platforms are not merely data aggregators; they function as a cognitive risk engine, essential for navigating an environment where geopolitical risk monitoring and identifying supply chain concentration risk are constant operational requirements. The market in North America is projected to account for 39.75% of the total growth, driven by early adoption in high-tech manufacturing and defense sectors.
Drivers, Trends, and Challenges in the Ai For Supply Chain Risk Intelligence Platforms Market
The increasing complexity of global value chains is compelling organizations to adopt advanced analytical tools, moving beyond generic enterprise resource planning systems. The demand for AI tools for ESG compliance auditing is accelerating, driven by regulations like the EU's Corporate Sustainability Due Diligence Directive, which holds companies accountable for their entire value chain.
In practice, this means a global pharmaceutical company must ensure the integrity of its temperature-sensitive shipments from end to end.
The adoption of AI platforms for pharma cold chain integrity allows for real-time monitoring and predictive alerts, a capability that represents a strategic investment far exceeding typical logistics software spending due to the high financial and reputational cost of a failed shipment. This is where machine learning models for port congestion and generative AI in procurement contingency planning become critical.
These systems use real-time graph databases for supplier mapping to identify hidden dependencies and simulate the impact of disruptions, offering a level of foresight that is now a competitive necessity. The ability to perform predictive analytics for commodity price volatility further solidifies the ROI for these sophisticated platforms, making them indispensable for strategic procurement.
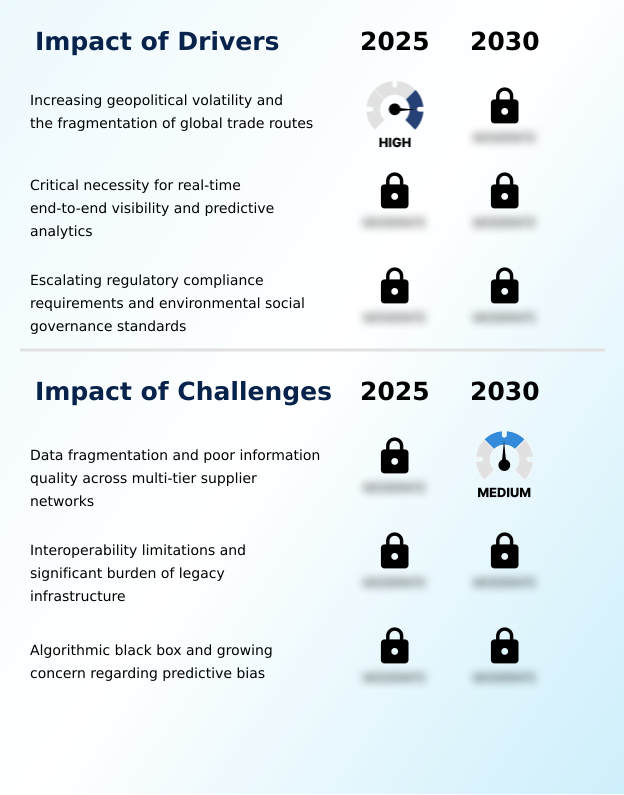
Primary Growth Driver: Increasing geopolitical volatility and the fragmentation of global trade routes are primary drivers, necessitating sophisticated platforms for real-time visibility and predictive analytics.
Key market drivers are rooted in the increasing complexity of the global trade environment. The critical necessity for real-time end-to-end visibility and predictive analytics is pushing organizations to abandon reactive, manual risk management processes.
Modern platforms leverage AI to create a comprehensive digital representation of the entire supply chain, identifying hidden vulnerabilities that could lead to major disruptions.
Another significant driver is the rise of stringent regulatory frameworks, such as the German Supply Chain Due Diligence Act. These mandates require firms to perform deep environmental social governance monitoring across their supplier networks.
The sheer scale of this task makes automated compliance verification through AI-powered platforms not just an advantage but a necessity for legal and reputational risk management.
Emerging Market Trend: The integration of generative AI is enabling a shift from predictive to prescriptive risk analytics. This allows platforms to provide specific, actionable recommendations in natural language.
The market is undergoing a significant transformation as it moves from predictive to prescriptive risk analytics. This shift is enabled by the integration of high-fidelity digital twins, which create a virtual replica of the entire supply network, allowing for comprehensive multi-tier supply chain mapping.
Such detailed visualization helps identify circular dependencies and geographic clusters where a single event could disable multiple suppliers. Furthermore, the trend is toward autonomous mitigation, creating self-healing supply networks that can automatically execute pre-defined protocols—like rebooking freight or shifting production orders—in response to a detected high-probability disruption.
This capability removes human latency, providing a crucial competitive advantage in securing limited alternative resources during a crisis.
Key Industry Challenge: Data fragmentation and poor information quality across multi-tier supplier networks remain a key challenge, compromising the accuracy of AI-driven risk assessments.
A primary challenge constraining market growth is the pervasive issue of data fragmentation and poor information quality, which undermines the efficacy of AI models. Many organizations lack sub-tier supplier visibility, creating a data vacuum that can lead to an algorithmic black box phenomenon where risk assessments are based on incomplete or inaccurate inferences.
This opacity significantly increases supply chain concentration risk, as hidden dependencies go undetected. Moreover, the significant burden of integrating modern AI platforms with rigid legacy IT systems and disparate software ecosystems presents a substantial hurdle.
This lack of interoperability prevents the AI from gaining a holistic view of organizational risk, thereby limiting the effectiveness of its predictive insights and hindering the modernization of risk management strategies.
Explore Full Market Dynamics Analysis Request Free Sample
Ai For Supply Chain Risk Intelligence Platforms Market Segmentation
The ai for supply chain risk intelligence platforms industry research report provides comprehensive data including region-wise segment analysis, with forecasts and analysis for the period 2026-2030, as well as historical data from 2020-2024 for the following segments.
Component Segment Analysis
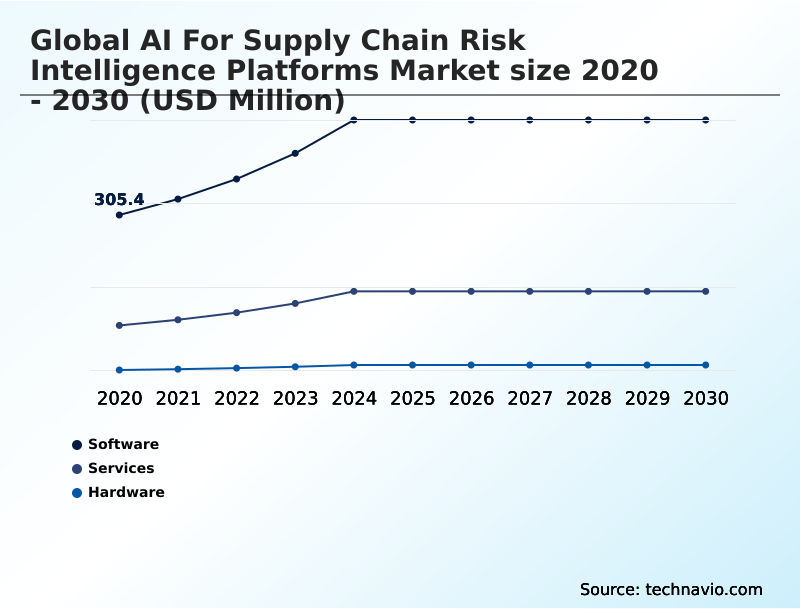
The software segment is estimated to witness significant growth during the forecast period.
The global AI for supply chain risk intelligence platforms market is segmented by component, technology, end-user, and geography. The software segment constitutes the primary technology layer where data processing and intelligence generation occur.
These platforms utilize machine learning algorithms for supplier stability assessment, with software as a service (SaaS) applications representing a significant portion of the market, which stood at USD 564.7 million in 2025.
This segment's evolution is increasingly focused on a cognitive risk engine and the use of natural language processing for risk to democratize access to critical insights.
The integration of prescriptive risk analytics allows for the transition from reactive problem-solving to a predictive posture, enhancing organizational resilience in a volatile global landscape.
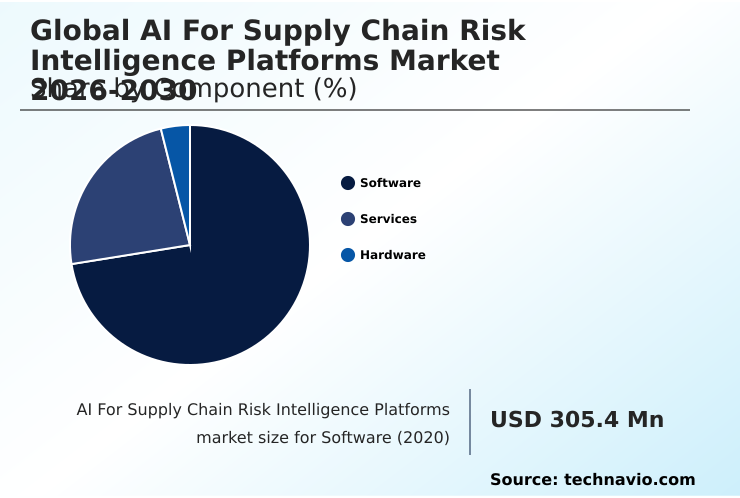
The Software segment was valued at USD 482.5 million in 2024 and showed a gradual increase during the forecast period.
Ai For Supply Chain Risk Intelligence Platforms Market by Region: North America Leads with 39.7% Growth Share
North America is estimated to contribute 39.7% to the growth of the global market during the forecast period.
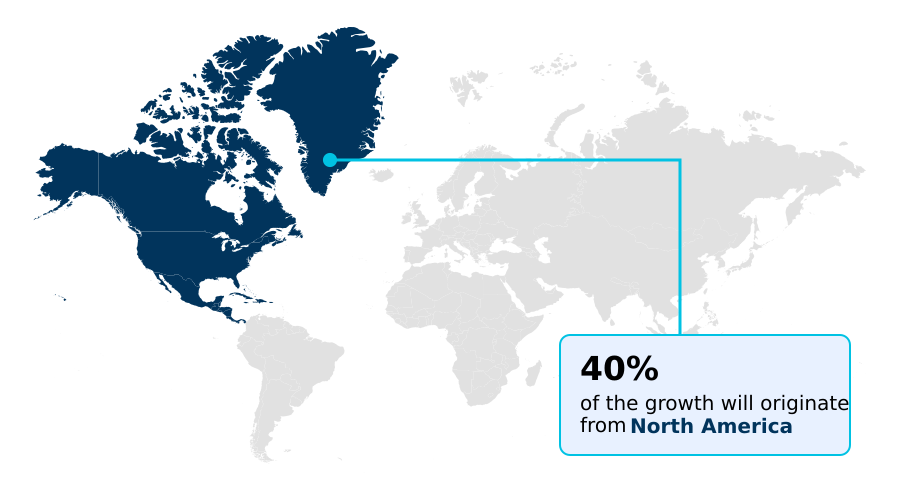
The geographic landscape of the global AI for supply chain risk intelligence platforms market is led by North America, which is poised to contribute approximately 39.7% of the market's incremental growth.
This dominance is fueled by a high concentration of technology firms and early adoption by industries in the US and Canada focused on mitigating geopolitical risk and ensuring robust cargo tracking and traceability.
However, the most rapid expansion is occurring in APAC, which exhibits a regional CAGR of 21.0%.
This growth is driven by the region's role as the world's manufacturing hub, where managing maritime trade disruption and achieving sub-tier supplier visibility are critical for operational continuity in countries like China and Japan.
Europe's growth is largely propelled by stringent regulations requiring deep ethical sourcing verification and environmental social governance monitoring.
Customer Landscape Analysis for the Ai For Supply Chain Risk Intelligence Platforms Market
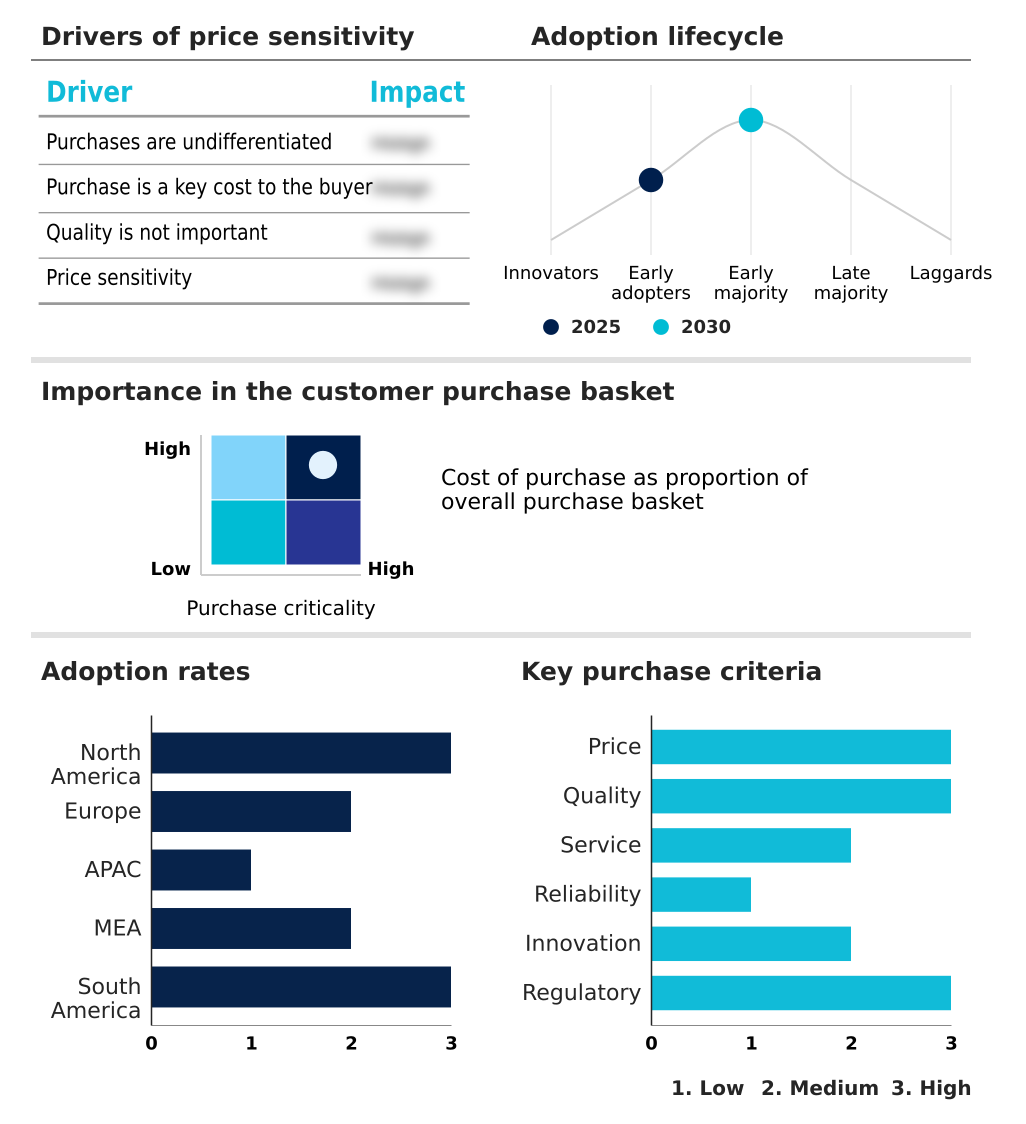
The ai for supply chain risk intelligence platforms market forecasting report includes the adoption lifecycle of the market, covering from the innovator’s stage to the laggard’s stage. It focuses on adoption rates in different regions based on penetration. Furthermore, the ai for supply chain risk intelligence platforms market report also includes key purchase criteria and drivers of price sensitivity to help companies evaluate and develop their market growth analysis strategies.
Competitive Landscape of the Ai For Supply Chain Risk Intelligence Platforms Market
Companies are implementing various strategies, such as strategic alliances, partnerships, mergers and acquisitions, geographical expansion, and product/service launches, to enhance their presence in the ai for supply chain risk intelligence platforms market industry.
Altana AI - Platforms provide AI-driven risk intelligence, delivering global value chain visibility, compliance monitoring, and multi-tier supplier risk assessment to enhance organizational resilience.
The industry research and growth report includes detailed analyses of the competitive landscape of the market and information about key companies, including:
- Altana AI
- Avetta LLC
- Blue Yonder Group Inc.
- Coupa Software Inc.
- Dun and Bradstreet Holdings Inc
- EcoVadis SAS
- Everstream Analytics
- Exiger
- IBM Corp.
- Interos Inc.
- Kinaxis Inc.
- Kodiak Hub
- Moodys Corp.
- Oracle Corp.
- project44
- Resilinc Corp.
- SAP SE
- Sayari Labs Inc
- Sphera Solutions Inc.
Qualitative and quantitative analysis of companies has been conducted to help clients understand the wider business environment as well as the strengths and weaknesses of key industry players. Data is qualitatively analyzed to categorize companies as pure play, category-focused, industry-focused, and diversified; it is quantitatively analyzed to categorize companies as dominant, leading, strong, tentative, and weak.
Recent Developments in the Ai For Supply Chain Risk Intelligence Platforms Market
- In May 2025, a prominent international trade consortium launched a digital monitoring framework that utilizes machine learning to assess the impact of regional security shifts on the flow of critical raw materials through Southeast Asian maritime routes.
- In April 2025, a major North American aerospace manufacturer integrated a real-time artificial intelligence risk assessment tool designed to monitor the global semiconductor supply chain for potential export control violations and logistical bottlenecks.
- In March 2025, a leading global pharmaceutical provider deployed a sophisticated risk intelligence platform to monitor real-time geopolitical tensions and their potential impact on the export of critical chemical precursors from specialized industrial zones.
- In February 2025, a leading enterprise software provider integrated a specialized large language model into its core procurement suite to allow users to conduct real-time stress tests on their supplier contracts using natural language queries regarding regional labor laws and environmental regulations.
Research Analyst Overview: Ai For Supply Chain Risk Intelligence Platforms Market
The market has moved past foundational risk identification toward autonomous mitigation and the creation of self-healing supply networks. This evolution is driven by the integration of high-fidelity digital twins, which allow procurement decision-makers to stress-test their networks against simulated disruptions.
Boardroom-level discussions now center on the CAPEX for these platforms versus the quantifiable risk of business interruption, a calculation heavily influenced by mandates like the German Supply Chain Due Diligence Act. The core technology, including graph database technology and natural language processing for risk, has matured, enabling granular, multi-tier supply chain mapping.
An organization's ability to conduct a comprehensive supplier stability assessment now depends on its prescriptive risk analytics capabilities. With market growth accelerating at 18.2% year-over-year, companies that delay adoption risk falling behind in operational resilience. The focus is on achieving a state where predictive failure analysis and automated compliance verification are standard, not exceptional, capabilities.
Dive into Technavio’s robust research methodology, blending expert interviews, extensive data synthesis, and validated models for unparalleled Ai For Supply Chain Risk Intelligence Platforms Market insights. See full methodology.
| Market Scope | |
|---|---|
| Page number | 307 |
| Base year | 2025 |
| Historic period | 2020-2024 |
| Forecast period | 2026-2030 |
| Growth momentum & CAGR | Accelerate at a CAGR of 20.5% |
| Market growth 2026-2030 | USD 1211.2 million |
| Market structure | Fragmented |
| YoY growth 2025-2026(%) | 18.2% |
| Key countries | US, Canada, Mexico, Germany, UK, France, Italy, Spain, The Netherlands, China, Japan, India, South Korea, Australia, Indonesia, UAE, Saudi Arabia, South Africa, Israel, Egypt, Brazil, Argentina and Colombia |
| Competitive landscape | Leading Companies, Market Positioning of Companies, Competitive Strategies, and Industry Risks |
Ai For Supply Chain Risk Intelligence Platforms Market: Key Questions Answered in This Report
-
What is the expected growth of the Ai For Supply Chain Risk Intelligence Platforms Market between 2026 and 2030?
-
The Ai For Supply Chain Risk Intelligence Platforms Market is expected to grow by USD 1.21 billion during 2026-2030, registering a CAGR of 20.5%. Year-over-year growth in 2026 is estimated at 18.2%%. This acceleration is shaped by increasing geopolitical volatility and the fragmentation of global trade routes, which is intensifying demand across multiple end-use verticals covered in the report.
-
-
What segmentation does the market report cover?
-
The report is segmented by Component (Software, Services, and Hardware), Technology (Machine learning, NLP, Computer vision, Context-aware computing, and Others), End-user (Manufacturing, Retail and e-commerce, Healthcare and pharma, and Others) and Geography (North America, Europe, APAC, Middle East and Africa, South America). Among these, the Software segment is estimated to witness significant growth during the forecast period, driven by rising adoption across key application areas. Each segment includes detailed qualitative and quantitative analysis, along with historical data from 2020-2024 and forecasts through 2030 with year-over-year growth rates.
-
-
Which regions are analyzed in the report?
-
The report covers North America, Europe, APAC, Middle East and Africa and South America. North America is estimated to contribute 39.7% to market growth during the forecast period. Country-level analysis includes US, Canada, Mexico, Germany, UK, France, Italy, Spain, The Netherlands, China, Japan, India, South Korea, Australia, Indonesia, UAE, Saudi Arabia, South Africa, Israel, Egypt, Brazil, Argentina and Colombia, with dedicated market size tables and year-over-year growth for each.
-
-
What are the key growth drivers and market challenges?
-
The primary driver is increasing geopolitical volatility and the fragmentation of global trade routes, which is accelerating investment and industry demand. The main challenge is data fragmentation and poor information quality across multi-tier supplier networks, creating operational barriers for key market participants. The report quantifies the impact of each driver and challenge across 2026 and 2030 with comparative analysis.
-
-
Who are the major players in the Ai For Supply Chain Risk Intelligence Platforms Market?
-
Key vendors include Altana AI, Avetta LLC, Blue Yonder Group Inc., Coupa Software Inc., Dun and Bradstreet Holdings Inc, EcoVadis SAS, Everstream Analytics, Exiger, IBM Corp., Interos Inc., Kinaxis Inc., Kodiak Hub, Moodys Corp., Oracle Corp., project44, Resilinc Corp., SAP SE, Sayari Labs Inc and Sphera Solutions Inc.. The report provides qualitative and quantitative analysis categorizing companies as dominant, leading, strong, tentative, and weak based on their market positioning. Company profiles include business segment analysis, SWOT assessment, key offerings, and recent strategic developments.
-
Ai For Supply Chain Risk Intelligence Platforms Market Research Insights
Market dynamics are increasingly shaped by the dual pressures of regulatory compliance and operational agility. The enforcement of mandates such as the German Supply Chain Due Diligence Act compels organizations to invest in regulatory compliance automation for environmental social governance monitoring. This is not merely a European phenomenon; it creates a global standard for ethical sourcing verification.
Consequently, platforms offering detailed sub-tier supplier visibility and supplier financial health analysis are gaining prominence. Geographically, while North America holds the largest market share, the growth momentum is shifting.
The market in APAC is expanding at a rate of 21.0%, slightly outpacing Europe's 20.7%, driven by the region's central role in global manufacturing and the urgent need to manage logistical bottleneck prediction and maritime trade disruption.
We can help! Our analysts can customize this ai for supply chain risk intelligence platforms market research report to meet your requirements.
 RIA -
RIA - 
