AI In ERP Market Analysis, Size, and Forecast 2025-2029: North America (US and Canada), Europe (Germany, UK, and France), APAC (China, India, and Japan), Middle East and Africa (Saudi Arabia and UAE), South America (Brazil and Argentina), and Rest of World (ROW)

AI In ERP Market Analysis, Size, and Forecast 2025-2029:
North America (US and Canada), Europe (Germany, UK, and France), APAC (China, India, and Japan), Middle East and Africa (Saudi Arabia and UAE), South America (Brazil and Argentina), and Rest of World (ROW)

Published: Dec 2025 261 Pages SKU: IRTNTR81003

Market Overview at a Glance

$13.08 B
Market Opportunity
27.3%
CAGR 2024 - 2029
41%
North America Growth
$2.98 B
Cloud based segment 2023

AI In ERP Market Size 2025-2029

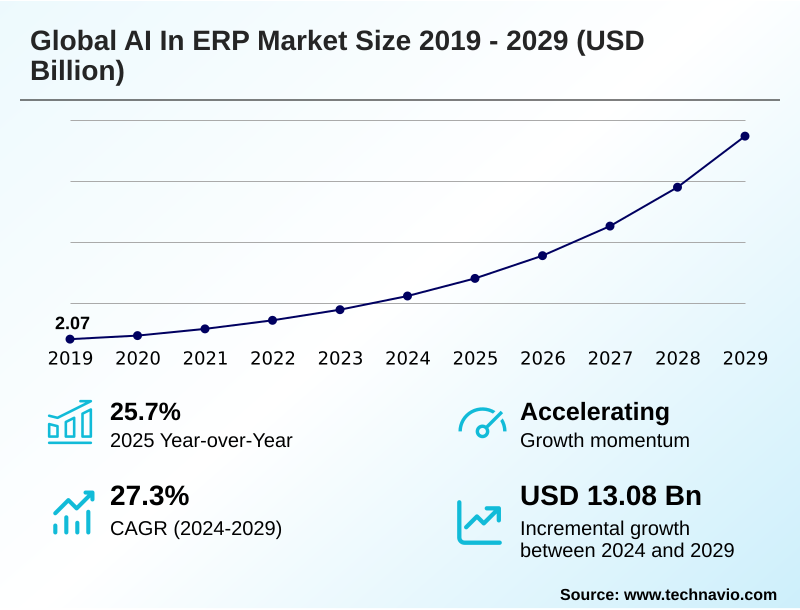
The ai in erp market size is valued to increase by USD 13.08 billion, at a CAGR of 27.3% from 2024 to 2029. Imperative for enhanced operational efficiency and automation will drive the ai in erp market.

Major Market Trends & Insights

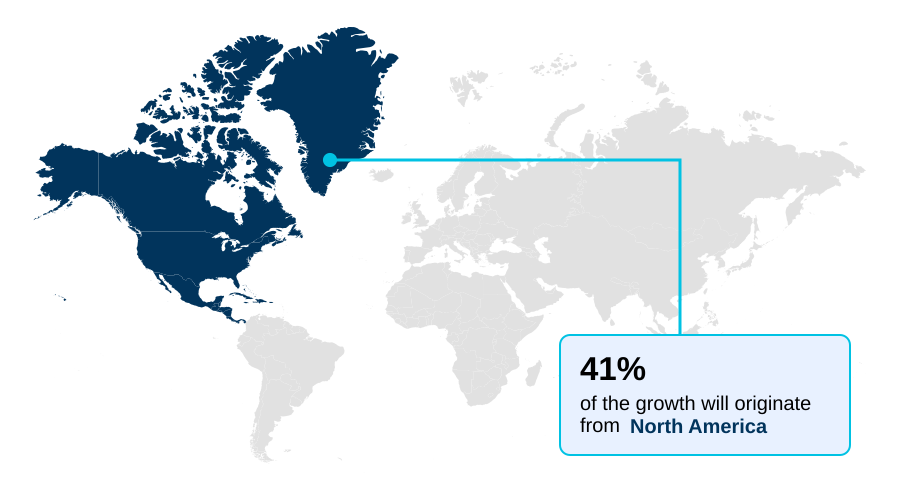
  • North America dominated the market and accounted for a 41% growth during the forecast period.
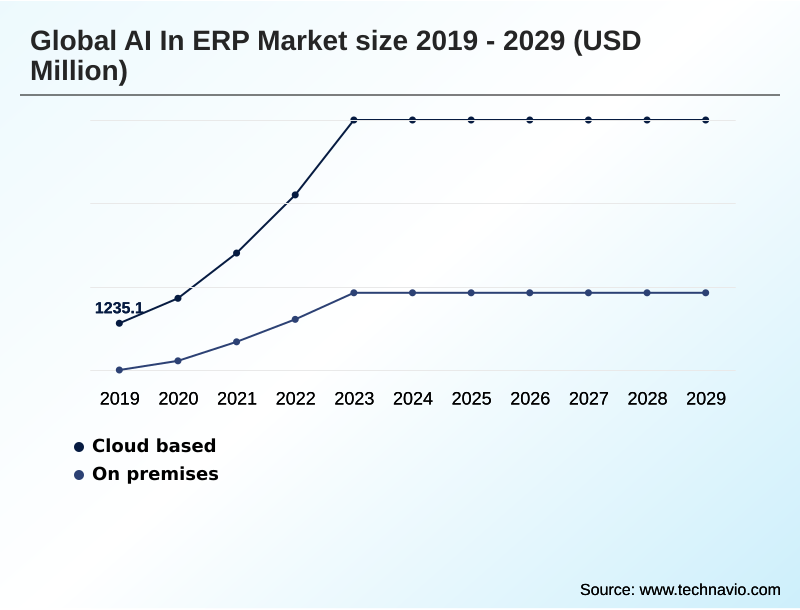
  • By Deployment - Cloud based segment was valued at USD 2.98 billion in 2023
  • By Component - Software segment accounted for the largest market revenue share in 2023

Market Size & Forecast

  • Market Opportunities: USD 16.62 billion
  • Market Future Opportunities: USD 13.08 billion
  • CAGR from 2024 to 2029 : 27.3%

Market Summary

  • The AI in ERP market is defined by the integration of intelligent technologies into core business management software. This infusion of capabilities like machine learning, intelligent automation, and natural language processing transforms traditional platforms into adaptive systems that learn from data.
  • The primary objective is to boost operational efficiency and streamline processes through smarter automation, deeper data analysis using AI-powered business intelligence, and improved forecasting. For instance, in a complex supply chain scenario, AI-powered supplier recommendations can analyze supplier performance data to suggest optimal partners, reducing risk and improving reliability by more than 15%.
  • This predictive sales forecasting and AI-enhanced financial planning capability is critical for strategic decision-making. By automating routine tasks such as AI-driven data entry and enabling predictive maintenance AI, organizations minimize human error and enhance productivity. The adoption of AI for fraud detection and computer vision for quality control is becoming integral for achieving a competitive advantage in a dynamic landscape.
  • Ultimately, the use of a conversational AI co-pilot and AI-powered workflow automation reshapes user interaction, making complex data more accessible and actionable. This shift enables organizations to achieve significant gains in both productivity and strategic insight across the enterprise.

What will be the Size of the AI In ERP Market during the forecast period?

Get Key Insights on Market Forecast (PDF) Request Free Sample

How is the AI In ERP Market Segmented?

The ai in erp industry research report provides comprehensive data (region-wise segment analysis), with forecasts and estimates in "USD million" for the period 2025-2029, as well as historical data from 2019-2023 for the following segments.

  • Deployment
    • Cloud based
    • On premises
  • Component
    • Software
    • Services
  • End-user
    • Manufacturing
    • Retail and e-commerce
    • BFSI
    • Healthcare
    • Others
  • Geography
    • North America
      • US
      • Canada
    • Europe
      • Germany
      • UK
      • France
    • APAC
      • China
      • India
      • Japan
    • Middle East and Africa
      • Saudi Arabia
      • UAE
    • South America
      • Brazil
      • Argentina
    • Rest of World (ROW)

By Deployment Insights

The cloud based segment is estimated to witness significant growth during the forecast period.

Cloud-based deployment models are central to the AI in ERP market, driven by the need for scalable and flexible infrastructure to support data-intensive applications.

These cloud-based AI ERP platforms facilitate the seamless integration of advanced capabilities like machine learning for predictive analytics and AI-powered workflow automation.

For enterprises, this model offers a more cost-effective pathway to leverage AI-driven customer insights and AI-powered procurement without significant capital expenditure on hardware.

The inherent agility of the cloud supports AI for supply chain resilience and allows for dynamic resource adjustment. As an example of improved functionality, a conversational AI co-pilot integrated within these systems can increase task completion efficiency by over 25%.

This approach supports a hybrid cloud AI ERP strategy and is foundational for real-time data analysis.

Request Free Sample

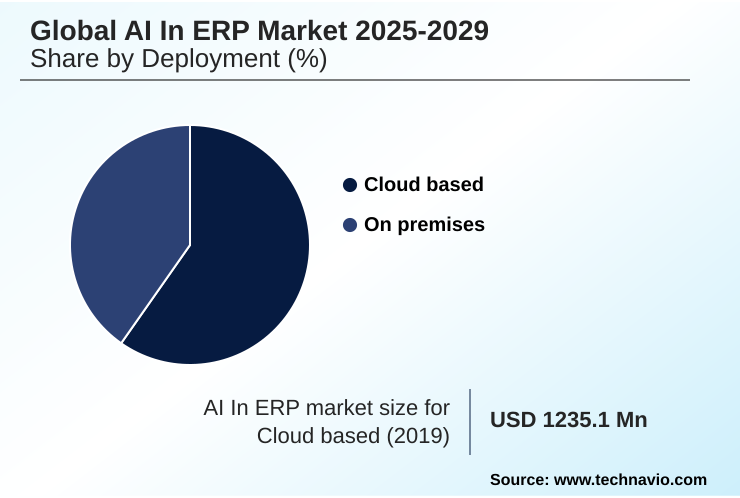
The Cloud based segment was valued at USD 2.98 billion in 2023 and showed a gradual increase during the forecast period.

Request Free Sample

Regional Analysis

North America is estimated to contribute 41% to the growth of the global market during the forecast period.Technavio’s analysts have elaborately explained the regional trends and drivers that shape the market during the forecast period.

See How AI In ERP Market Demand is Rising in North America Request Free Sample

North America leads the global AI in ERP market, commanding over 41% of incremental growth. This is driven by high enterprise adoption of AI for manufacturing ERP and AI for human capital management.

Europe follows, with a strong focus on smart factory automation and AI-driven compliance monitoring. However, the APAC region is the fastest-growing market, with its expanding industrial base rapidly adopting AI for logistics and transportation and intelligent document processing.

The use of AI in retail and e-commerce is also surging, supported by advancements in AI-enhanced customer relationship management.

Workflow orchestration AI is being deployed in government and public sector initiatives across regions to modernize legacy systems and improve service delivery.

Market Dynamics

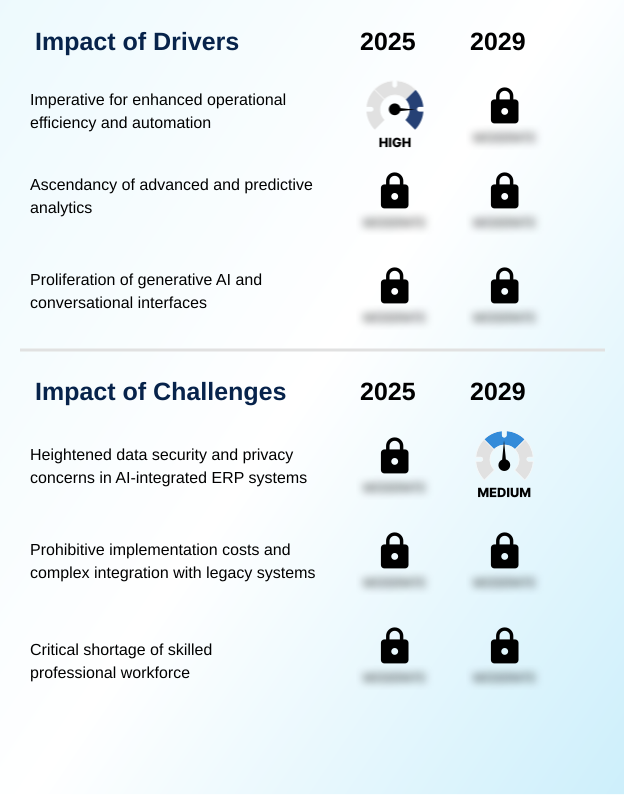
Our researchers analyzed the data with 2024 as the base year, along with the key drivers, trends, and challenges. A holistic analysis of drivers will help companies refine their marketing strategies to gain a competitive advantage.

  • The impact of generative AI on ERP is fundamentally reshaping enterprise software, moving beyond simple automation to create more intuitive and powerful systems. The benefits of cloud-based AI in ERP are clear, offering scalable and cost-effective access to advanced analytics and machine learning models.
  • However, the challenges of AI integration in ERP, including data security risks with AI ERP and the high cost of implementing AI in ERP, remain significant hurdles. Measuring ROI from AI in ERP is critical for justifying these investments.
  • A primary application showing clear value is how AI improves supply chain management, where AI-powered inventory optimization strategies have been shown to reduce carrying costs by over 20% compared to traditional methods. Similarly, AI-driven automation in financial processes, including compliance and risk management, streamlines operations and enhances accuracy.
  • The role of AI in predictive maintenance is transforming manufacturing by minimizing downtime. In other sectors, using AI for demand forecasting in retail and streamlining HR with AI in ERP delivers substantial efficiency gains. The AI talent gap in ERP implementation continues to be a bottleneck, even as using natural language in ERP systems improves the user experience.
  • Ultimately, comparing AI features in top ERPs reveals a market rapidly advancing toward improving business intelligence with AI, making industry-specific benefits of AI ERP increasingly accessible.

What are the key market drivers leading to the rise in the adoption of AI In ERP Industry?

  • The imperative for enhanced operational efficiency and automation is a key driver, pushing organizations toward intelligent workflows integrated within ERP systems.

  • The imperative for heightened operational efficiency is a primary driver, with organizations leveraging AI-powered chatbots and intelligent virtual agents to automate routine tasks and liberate employees for strategic activities.
  • The adoption of AI-driven data entry and robotic process automation can reduce manual processing errors by over 40% in finance departments.
  • This push for automation is evident in the demand for AI-driven decision making and intelligent process automation across the enterprise. Key technologies like AI-enhanced financial planning and AI-enhanced supply chain visibility are becoming standard.
  • This move is supported by the growing accessibility of AI for small business ERP and the focus on the ROI of AI in ERP.

What are the market trends shaping the AI In ERP Industry?

  • The proliferation of cloud-based ERP solutions is a primary trend, providing the scalable infrastructure necessary for advanced AI applications.

  • A primary trend in the AI in ERP market is the move toward industry-specific AI ERP solutions, which deliver more immediate value by addressing unique vertical challenges. In manufacturing, the use of predictive maintenance AI can reduce equipment downtime by up to 50%.
  • This is complemented by the emergence of AI for healthcare ERP and specialized AI for professional services automation. The adoption of AI-powered business intelligence and workflow orchestration AI is enabling a more proactive operational stance. For instance, new AI-driven personalization in ERP systems helps retailers improve customer engagement, while agentic AI for HR enhances talent management.
  • This focus on verticalization ensures AI's power is applied where it has the most impact.

What challenges does the AI In ERP Industry face during its growth?

  • Heightened data security and privacy concerns in AI-integrated ERP systems present a significant challenge, complicating regulatory compliance and slowing adoption.

  • Significant challenges persist, primarily around heightened data security and privacy, which complicate AI integration with legacy ERP systems. Organizations face concerns regarding data governance for AI in ERP and ensuring ethical AI in enterprise systems. A critical shortage of skilled professionals creates a bottleneck, as the AI talent for ERP implementation is scarce and highly competitive.
  • The complexity of these systems also poses a risk, with a lack of transparency in some AI models leading to a 60% citation rate of personnel shortages as a primary adoption obstacle. Prohibitive implementation costs and the complexities of on-premises ERP AI integration also limit adoption, particularly for smaller enterprises concerned with cybersecurity for AI-enabled ERP.

Exclusive Technavio Analysis on Customer Landscape

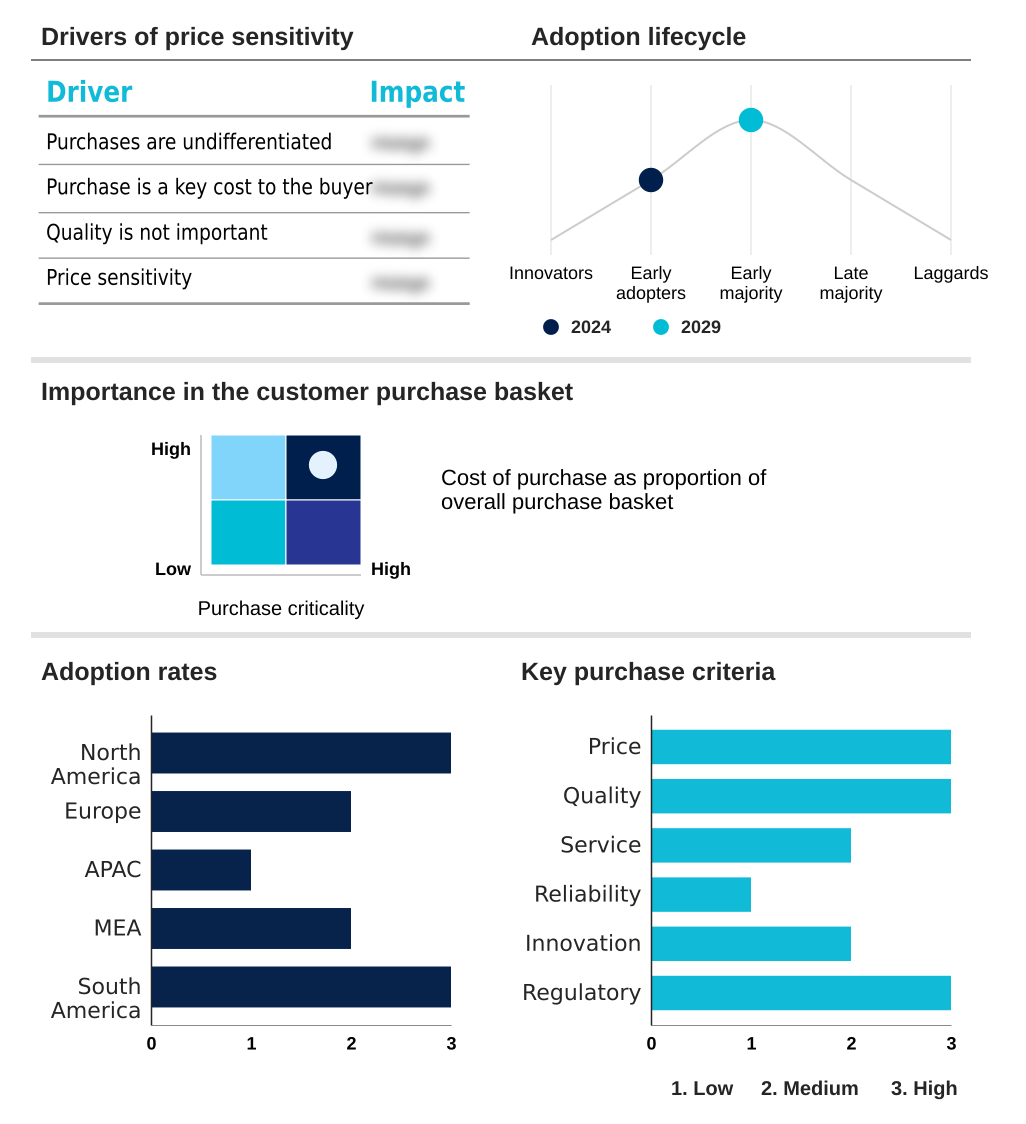
The ai in erp market forecasting report includes the adoption lifecycle of the market, covering from the innovator’s stage to the laggard’s stage. It focuses on adoption rates in different regions based on penetration. Furthermore, the ai in erp market report also includes key purchase criteria and drivers of price sensitivity to help companies evaluate and develop their market growth analysis strategies.

Customer Landscape of AI In ERP Industry

Competitive Landscape

Companies are implementing various strategies, such as strategic alliances, ai in erp market forecast, partnerships, mergers and acquisitions, geographical expansion, and product/service launches, to enhance their presence in the industry.

Acumatica Inc. - Solutions provide AI-driven document recognition and natural language search, automating invoicing and enhancing data access for manufacturing, distribution, and other industries.

The industry research and growth report includes detailed analyses of the competitive landscape of the market and information about key companies, including:

  • Acumatica Inc.
  • Aptean
  • Deltek Inc.
  • Epicor Software Corp.
  • IFS World Operations AB
  • Infor Inc.
  • Katana Technologies OU
  • Microsoft Corp.
  • Nominal Ltd.
  • Odoo SA
  • Oracle Corp.
  • QAD Inc.
  • Ramco Systems Ltd.
  • Rootstock Software
  • Sage Group Plc
  • SAP SE
  • ServiceNow Inc.
  • SYSPRO Pty. Ltd.
  • Unit4 Group Holding B.V.
  • Workday Inc.

Qualitative and quantitative analysis of companies has been conducted to help clients understand the wider business environment as well as the strengths and weaknesses of key industry players. Data is qualitatively analyzed to categorize companies as pure play, category-focused, industry-focused, and diversified; it is quantitatively analyzed to categorize companies as dominant, leading, strong, tentative, and weak.

Recent Development and News in Ai in erp market

  • In May 2025, IFS announced the general availability of its latest IFS Cloud release, featuring a new AI-powered copilot to help users understand and utilize data across the supply chain.
  • In April 2025, Lloyds Banking Group announced a collaboration with Google Cloud's Vertex AI to develop a new machine learning and generative AI platform for the financial services sector.
  • In March 2025, NatWest Group partnered with OpenAI to advance the application of AI in banking, with a stated focus on improving customer experiences.
  • In January 2025, Cognizant launched its Neuro AI platform, designed to streamline business processes and enhance operational efficiency in healthcare through multi-agent systems.

Dive into Technavio’s robust research methodology, blending expert interviews, extensive data synthesis, and validated models for unparalleled AI In ERP Market insights. See full methodology.

Market Scope
Page number 261
Base year 2024
Historic period 2019-2023
Forecast period 2025-2029
Growth momentum & CAGR Accelerate at a CAGR of 27.3%
Market growth 2025-2029 USD 13084.9 million
Market structure Fragmented
YoY growth 2024-2025(%) 25.7%
Key countries US, Canada, Germany, UK, France, Italy, China, India, Japan, South Korea, Saudi Arabia, UAE, Brazil and Argentina
Competitive landscape Leading Companies, Market Positioning of Companies, Competitive Strategies, and Industry Risks

Request Free Sample

Research Analyst Overview

  • The AI in ERP market is evolving rapidly, driven by the integration of sophisticated technologies such as machine learning for predictive analytics and natural language processing. These capabilities are no longer add-ons but core components that enable intelligent automation and AI-driven decision making.
  • The adoption of generative AI for content creation is transforming user interactions, while AI-powered workflow automation streamlines complex business processes. A key trend is the deployment of predictive maintenance AI in manufacturing, which can reduce machine downtime by over 30%, a critical factor in boardroom-level discussions on operational budgeting and asset lifecycle management.
  • As enterprises increasingly rely on AI-powered supplier recommendations and demand forecasting algorithms, the need for robust AI model management becomes paramount. This shift toward intelligent systems, featuring capabilities like automated financial close and AI-driven risk assessment, is redefining enterprise efficiency and strategic agility, moving well beyond traditional transactional platforms.

What are the Key Data Covered in this AI In ERP Market Research and Growth Report?

  • What is the expected growth of the AI In ERP Market between 2025 and 2029?

    • USD 13.08 billion, at a CAGR of 27.3%

  • What segmentation does the market report cover?

    • The report is segmented by Deployment (Cloud based, and On premises), Component (Software, and Service), End-user (Manufacturing, Retail and e-commerce, BFSI, Healthcare, and Others) and Geography (North America, Europe, APAC, Middle East and Africa, South America)

  • Which regions are analyzed in the report?

    • North America, Europe, APAC, Middle East and Africa and South America

  • What are the key growth drivers and market challenges?

    • Imperative for enhanced operational efficiency and automation, Heightened data security and privacy concerns in AI-integrated ERP systems

  • Who are the major players in the AI In ERP Market?

    • Acumatica Inc., Aptean, Deltek Inc., Epicor Software Corp., IFS World Operations AB, Infor Inc., Katana Technologies OU, Microsoft Corp., Nominal Ltd., Odoo SA, Oracle Corp., QAD Inc., Ramco Systems Ltd., Rootstock Software, Sage Group Plc, SAP SE, ServiceNow Inc., SYSPRO Pty. Ltd., Unit4 Group Holding B.V. and Workday Inc.

Market Research Insights

  • The AI in ERP market is driven by the strategic imperative for AI-driven operational efficiency, with enterprises adopting AI copilots for business processes to automate complex tasks. This push is reshaping the generative AI in ERP user experience, making systems more intuitive.
  • AI for supply chain resilience is a critical focus, with analytics improving forecasting accuracy by as much as 72% in certain retail applications. Furthermore, industry-specific AI ERP solutions are gaining traction, particularly in manufacturing, where they have demonstrated the ability to reduce machine downtime by up to 50%.
  • The integration of AI in financial ERP modules is another key area, where automated processes accelerate closing cycles and enhance reporting accuracy. This shift toward intelligent enterprise systems is a direct response to the need for more agile, data-driven decision-making across all business functions.

We can help! Our analysts can customize this ai in erp market research report to meet your requirements.

Get in touch

1. Executive Summary

1.1 Market overview

Executive Summary - Chart on Market Overview
Executive Summary - Data Table on Market Overview
Executive Summary - Chart on Global Market Characteristics
Executive Summary - Chart on Market by Geography
Executive Summary - Chart on Market Segmentation by Deployment
Executive Summary - Chart on Market Segmentation by Component
Executive Summary - Chart on Market Segmentation by End-user
Executive Summary - Chart on Incremental Growth
Executive Summary - Data Table on Incremental Growth
Executive Summary - Chart on Company Market Positioning

2. Technavio Analysis

2.1 Analysis of price sensitivity, lifecycle, customer purchase basket, adoption rates, and purchase criteria

2.2 Criticality of inputs and Factors of differentiation

Chart on Overview on criticality of inputs and factors of differentiation

2.3 Factors of disruption

Chart on Overview on factors of disruption

2.4 Impact of drivers and challenges

Chart on Impact of drivers and challenges in 2024 and 2029

3. Market Landscape

3.1 Market ecosystem

Chart on Parent Market
Data Table on - Parent Market

3.2 Market characteristics

Chart on Market characteristics analysis

3.3 Value chain analysis

Chart on Value chain analysis

4. Market Sizing

4.1 Market definition

Data Table on Offerings of companies included in the market definition

4.2 Market segment analysis

Market segments

4.3 Market size 2024

4.4 Market outlook: Forecast for 2024-2029

Chart on Global - Market size and forecast 2024-2029 ($ million)
Data Table on Global - Market size and forecast 2024-2029 ($ million)
Chart on Global Market: Year-over-year growth 2024-2029 (%)
Data Table on Global Market: Year-over-year growth 2024-2029 (%)

5. Historic Market Size

5.1 Global AI In ERP Market 2019 - 2023

Historic Market Size - Data Table on Global AI In ERP Market 2019 - 2023 ($ million)

5.2 Deployment segment analysis 2019 - 2023

Historic Market Size - Deployment Segment 2019 - 2023 ($ million)

5.3 Component segment analysis 2019 - 2023

Historic Market Size - Component Segment 2019 - 2023 ($ million)

5.4 End-user segment analysis 2019 - 2023

Historic Market Size - End-user Segment 2019 - 2023 ($ million)

5.5 Geography segment analysis 2019 - 2023

Historic Market Size - Geography Segment 2019 - 2023 ($ million)

5.6 Country segment analysis 2019 - 2023

Historic Market Size - Country Segment 2019 - 2023 ($ million)

6. Five Forces Analysis

6.1 Five forces summary

Five forces analysis - Comparison between 2024 and 2029

6.2 Bargaining power of buyers

Bargaining power of buyers - Impact of key factors 2024 and 2029

6.3 Bargaining power of suppliers

Bargaining power of suppliers - Impact of key factors in 2024 and 2029

6.4 Threat of new entrants

Threat of new entrants - Impact of key factors in 2024 and 2029

6.5 Threat of substitutes

Threat of substitutes - Impact of key factors in 2024 and 2029

6.6 Threat of rivalry

Threat of rivalry - Impact of key factors in 2024 and 2029

6.7 Market condition

Chart on Market condition - Five forces 2024 and 2029

7. Market Segmentation by Deployment

7.1 Market segments

Chart on Deployment - Market share 2024-2029 (%)
Data Table on Deployment - Market share 2024-2029 (%)

7.2 Comparison by Deployment

Chart on Comparison by Deployment
Data Table on Comparison by Deployment

7.3 Cloud based - Market size and forecast 2024-2029

Chart on Cloud based - Market size and forecast 2024-2029 ($ million)
Data Table on Cloud based - Market size and forecast 2024-2029 ($ million)
Chart on Cloud based - Year-over-year growth 2024-2029 (%)
Data Table on Cloud based - Year-over-year growth 2024-2029 (%)

7.4 On premises - Market size and forecast 2024-2029

Chart on On premises - Market size and forecast 2024-2029 ($ million)
Data Table on On premises - Market size and forecast 2024-2029 ($ million)
Chart on On premises - Year-over-year growth 2024-2029 (%)
Data Table on On premises - Year-over-year growth 2024-2029 (%)

7.5 Market opportunity by Deployment

Market opportunity by Deployment ($ million)
Data Table on Market opportunity by Deployment ($ million)

8. Market Segmentation by Component

8.1 Market segments

Chart on Component - Market share 2024-2029 (%)
Data Table on Component - Market share 2024-2029 (%)

8.2 Comparison by Component

Chart on Comparison by Component
Data Table on Comparison by Component

8.3 Software - Market size and forecast 2024-2029

Chart on Software - Market size and forecast 2024-2029 ($ million)
Data Table on Software - Market size and forecast 2024-2029 ($ million)
Chart on Software - Year-over-year growth 2024-2029 (%)
Data Table on Software - Year-over-year growth 2024-2029 (%)

8.4 Services - Market size and forecast 2024-2029

Chart on Services - Market size and forecast 2024-2029 ($ million)
Data Table on Services - Market size and forecast 2024-2029 ($ million)
Chart on Services - Year-over-year growth 2024-2029 (%)
Data Table on Services - Year-over-year growth 2024-2029 (%)

8.5 Market opportunity by Component

Market opportunity by Component ($ million)
Data Table on Market opportunity by Component ($ million)

9. Market Segmentation by End-user

9.1 Market segments

Chart on End-user - Market share 2024-2029 (%)
Data Table on End-user - Market share 2024-2029 (%)

9.2 Comparison by End-user

Chart on Comparison by End-user
Data Table on Comparison by End-user

9.3 Manufacturing - Market size and forecast 2024-2029

Chart on Manufacturing - Market size and forecast 2024-2029 ($ million)
Data Table on Manufacturing - Market size and forecast 2024-2029 ($ million)
Chart on Manufacturing - Year-over-year growth 2024-2029 (%)
Data Table on Manufacturing - Year-over-year growth 2024-2029 (%)

9.4 Retail and e-commerce - Market size and forecast 2024-2029

Chart on Retail and e-commerce - Market size and forecast 2024-2029 ($ million)
Data Table on Retail and e-commerce - Market size and forecast 2024-2029 ($ million)
Chart on Retail and e-commerce - Year-over-year growth 2024-2029 (%)
Data Table on Retail and e-commerce - Year-over-year growth 2024-2029 (%)

9.5 BFSI - Market size and forecast 2024-2029

Chart on BFSI - Market size and forecast 2024-2029 ($ million)
Data Table on BFSI - Market size and forecast 2024-2029 ($ million)
Chart on BFSI - Year-over-year growth 2024-2029 (%)
Data Table on BFSI - Year-over-year growth 2024-2029 (%)

9.6 Healthcare - Market size and forecast 2024-2029

Chart on Healthcare - Market size and forecast 2024-2029 ($ million)
Data Table on Healthcare - Market size and forecast 2024-2029 ($ million)
Chart on Healthcare - Year-over-year growth 2024-2029 (%)
Data Table on Healthcare - Year-over-year growth 2024-2029 (%)

9.7 Others - Market size and forecast 2024-2029

Chart on Others - Market size and forecast 2024-2029 ($ million)
Data Table on Others - Market size and forecast 2024-2029 ($ million)
Chart on Others - Year-over-year growth 2024-2029 (%)
Data Table on Others - Year-over-year growth 2024-2029 (%)

9.8 Market opportunity by End-user

Market opportunity by End-user ($ million)
Data Table on Market opportunity by End-user ($ million)

10. Customer Landscape

10.1 Customer landscape overview

Analysis of price sensitivity, lifecycle, customer purchase basket, adoption rates, and purchase criteria

11. Geographic Landscape

11.1 Geographic segmentation

Chart on Market share by geography 2024-2029 (%)
Data Table on Market share by geography 2024-2029 (%)

11.2 Geographic comparison

Chart on Geographic comparison
Data Table on Geographic comparison

11.3 North America - Market size and forecast 2024-2029

Chart on North America - Market size and forecast 2024-2029 ($ million)
Data Table on North America - Market size and forecast 2024-2029 ($ million)
Chart on North America - Year-over-year growth 2024-2029 (%)
Data Table on North America - Year-over-year growth 2024-2029 (%)
Chart on Regional Comparison - North America
Data Table on Regional Comparison - North America

11.3.1 US - Market size and forecast 2024-2029

Chart on US - Market size and forecast 2024-2029 ($ million)
Data Table on US - Market size and forecast 2024-2029 ($ million)
Chart on US - Year-over-year growth 2024-2029 (%)
Data Table on US - Year-over-year growth 2024-2029 (%)

11.3.2 Canada - Market size and forecast 2024-2029

Chart on Canada - Market size and forecast 2024-2029 ($ million)
Data Table on Canada - Market size and forecast 2024-2029 ($ million)
Chart on Canada - Year-over-year growth 2024-2029 (%)
Data Table on Canada - Year-over-year growth 2024-2029 (%)

11.4 Europe - Market size and forecast 2024-2029

Chart on Europe - Market size and forecast 2024-2029 ($ million)
Data Table on Europe - Market size and forecast 2024-2029 ($ million)
Chart on Europe - Year-over-year growth 2024-2029 (%)
Data Table on Europe - Year-over-year growth 2024-2029 (%)
Chart on Regional Comparison - Europe
Data Table on Regional Comparison - Europe

11.4.1 Germany - Market size and forecast 2024-2029

Chart on Germany - Market size and forecast 2024-2029 ($ million)
Data Table on Germany - Market size and forecast 2024-2029 ($ million)
Chart on Germany - Year-over-year growth 2024-2029 (%)
Data Table on Germany - Year-over-year growth 2024-2029 (%)

11.4.2 UK - Market size and forecast 2024-2029

Chart on UK - Market size and forecast 2024-2029 ($ million)
Data Table on UK - Market size and forecast 2024-2029 ($ million)
Chart on UK - Year-over-year growth 2024-2029 (%)
Data Table on UK - Year-over-year growth 2024-2029 (%)

11.4.3 France - Market size and forecast 2024-2029

Chart on France - Market size and forecast 2024-2029 ($ million)
Data Table on France - Market size and forecast 2024-2029 ($ million)
Chart on France - Year-over-year growth 2024-2029 (%)
Data Table on France - Year-over-year growth 2024-2029 (%)

11.4.4 Italy - Market size and forecast 2024-2029

Chart on Italy - Market size and forecast 2024-2029 ($ million)
Data Table on Italy - Market size and forecast 2024-2029 ($ million)
Chart on Italy - Year-over-year growth 2024-2029 (%)
Data Table on Italy - Year-over-year growth 2024-2029 (%)

11.5 APAC - Market size and forecast 2024-2029

Chart on APAC - Market size and forecast 2024-2029 ($ million)
Data Table on APAC - Market size and forecast 2024-2029 ($ million)
Chart on APAC - Year-over-year growth 2024-2029 (%)
Data Table on APAC - Year-over-year growth 2024-2029 (%)
Chart on Regional Comparison - APAC
Data Table on Regional Comparison - APAC

11.5.1 China - Market size and forecast 2024-2029

Chart on China - Market size and forecast 2024-2029 ($ million)
Data Table on China - Market size and forecast 2024-2029 ($ million)
Chart on China - Year-over-year growth 2024-2029 (%)
Data Table on China - Year-over-year growth 2024-2029 (%)

11.5.2 India - Market size and forecast 2024-2029

Chart on India - Market size and forecast 2024-2029 ($ million)
Data Table on India - Market size and forecast 2024-2029 ($ million)
Chart on India - Year-over-year growth 2024-2029 (%)
Data Table on India - Year-over-year growth 2024-2029 (%)

11.5.3 Japan - Market size and forecast 2024-2029

Chart on Japan - Market size and forecast 2024-2029 ($ million)
Data Table on Japan - Market size and forecast 2024-2029 ($ million)
Chart on Japan - Year-over-year growth 2024-2029 (%)
Data Table on Japan - Year-over-year growth 2024-2029 (%)

11.5.4 South Korea - Market size and forecast 2024-2029

Chart on South Korea - Market size and forecast 2024-2029 ($ million)
Data Table on South Korea - Market size and forecast 2024-2029 ($ million)
Chart on South Korea - Year-over-year growth 2024-2029 (%)
Data Table on South Korea - Year-over-year growth 2024-2029 (%)

11.6 Middle East and Africa - Market size and forecast 2024-2029

Chart on Middle East and Africa - Market size and forecast 2024-2029 ($ million)
Data Table on Middle East and Africa - Market size and forecast 2024-2029 ($ million)
Chart on Middle East and Africa - Year-over-year growth 2024-2029 (%)
Data Table on Middle East and Africa - Year-over-year growth 2024-2029 (%)
Chart on Regional Comparison - Middle East and Africa
Data Table on Regional Comparison - Middle East and Africa

11.6.1 Saudi Arabia - Market size and forecast 2024-2029

Chart on Saudi Arabia - Market size and forecast 2024-2029 ($ million)
Data Table on Saudi Arabia - Market size and forecast 2024-2029 ($ million)
Chart on Saudi Arabia - Year-over-year growth 2024-2029 (%)
Data Table on Saudi Arabia - Year-over-year growth 2024-2029 (%)

11.6.2 UAE - Market size and forecast 2024-2029

Chart on UAE - Market size and forecast 2024-2029 ($ million)
Data Table on UAE - Market size and forecast 2024-2029 ($ million)
Chart on UAE - Year-over-year growth 2024-2029 (%)
Data Table on UAE - Year-over-year growth 2024-2029 (%)

11.7 South America - Market size and forecast 2024-2029

Chart on South America - Market size and forecast 2024-2029 ($ million)
Data Table on South America - Market size and forecast 2024-2029 ($ million)
Chart on South America - Year-over-year growth 2024-2029 (%)
Data Table on South America - Year-over-year growth 2024-2029 (%)
Chart on Regional Comparison - South America
Data Table on Regional Comparison - South America

11.7.1 Brazil - Market size and forecast 2024-2029

Chart on Brazil - Market size and forecast 2024-2029 ($ million)
Data Table on Brazil - Market size and forecast 2024-2029 ($ million)
Chart on Brazil - Year-over-year growth 2024-2029 (%)
Data Table on Brazil - Year-over-year growth 2024-2029 (%)

11.7.2 Argentina - Market size and forecast 2024-2029

Chart on Argentina - Market size and forecast 2024-2029 ($ million)
Data Table on Argentina - Market size and forecast 2024-2029 ($ million)
Chart on Argentina - Year-over-year growth 2024-2029 (%)
Data Table on Argentina - Year-over-year growth 2024-2029 (%)

11.8 Market opportunity by geography

Market opportunity by geography ($ million)
Data Tables on Market opportunity by geography ($ million)

12. Drivers, Challenges, and Opportunity

12.1 Market drivers

Imperative for enhanced operational efficiency and automation
Ascendancy of advanced and predictive analytics
Proliferation of generative AI and conversational interfaces

12.2 Market challenges

Heightened data security and privacy concerns in AI-integrated ERP systems
Prohibitive implementation costs and complex integration with legacy systems
Critical shortage of skilled professional workforce

12.3 Impact of drivers and challenges

Impact of drivers and challenges in 2024 and 2029

12.4 Market opportunities

Proliferation of cloud-based ERP solutions
Concentrated focus on supply chain optimization and resilience
Emergence of industry-specific AI-powered ERP solutions

13. Competitive Landscape

13.1 Overview

13.2

Overview on criticality of inputs and factors of differentiation

13.3 Landscape disruption

Overview on factors of disruption

13.4 Industry risks

Impact of key risks on business

14. Competitive Analysis

14.1 Companies profiled

Companies covered

14.2 Company ranking index

14.3 Market positioning of companies

Matrix on companies position and classification

14.4 Acumatica Inc.

Acumatica Inc. - Overview
Acumatica Inc. - Product / Service
Acumatica Inc. - Key news
Acumatica Inc. - Key offerings
SWOT

14.5 Epicor Software Corp.

Epicor Software Corp. - Overview
Epicor Software Corp. - Product / Service
Epicor Software Corp. - Key news
Epicor Software Corp. - Key offerings
SWOT

14.6 IFS World Operations AB

IFS World Operations AB - Overview
IFS World Operations AB - Product / Service
IFS World Operations AB - Key offerings
SWOT

14.7 Infor Inc.

Infor Inc. - Overview
Infor Inc. - Product / Service
Infor Inc. - Key news
Infor Inc. - Key offerings
SWOT

14.8 Microsoft Corp.

Microsoft Corp. - Overview
Microsoft Corp. - Business segments
Microsoft Corp. - Key news
Microsoft Corp. - Key offerings
Microsoft Corp. - Segment focus
SWOT

14.9 Odoo SA

Odoo SA - Overview
Odoo SA - Product / Service
Odoo SA - Key offerings
SWOT

14.10 Oracle Corp.

Oracle Corp. - Overview
Oracle Corp. - Business segments
Oracle Corp. - Key news
Oracle Corp. - Key offerings
Oracle Corp. - Segment focus
SWOT

14.11 Ramco Systems Ltd.

Ramco Systems Ltd. - Overview
Ramco Systems Ltd. - Product / Service
Ramco Systems Ltd. - Key offerings
SWOT

14.12 Rootstock Software

Rootstock Software - Overview
Rootstock Software - Product / Service
Rootstock Software - Key offerings
SWOT

14.13 Sage Group Plc

Sage Group Plc - Overview
Sage Group Plc - Business segments
Sage Group Plc - Key news
Sage Group Plc - Key offerings
Sage Group Plc - Segment focus
SWOT

14.14 SAP SE

SAP SE - Overview
SAP SE - Business segments
SAP SE - Key news
SAP SE - Key offerings
SAP SE - Segment focus
SWOT

14.15 ServiceNow Inc.

ServiceNow Inc. - Overview
ServiceNow Inc. - Product / Service
ServiceNow Inc. - Key news
ServiceNow Inc. - Key offerings
SWOT

14.16 SYSPRO Pty. Ltd.

SYSPRO Pty. Ltd. - Overview
SYSPRO Pty. Ltd. - Product / Service
SYSPRO Pty. Ltd. - Key offerings
SWOT

14.17 Unit4 Group Holding B.V.

Unit4 Group Holding B.V. - Overview
Unit4 Group Holding B.V. - Product / Service
Unit4 Group Holding B.V. - Key offerings
SWOT

14.18 Workday Inc.

Workday Inc. - Overview
Workday Inc. - Product / Service
Workday Inc. - Key news
Workday Inc. - Key offerings
SWOT

15. Appendix

15.1 Scope of the report

Market definition
Objectives
Notes and caveats

15.2 Inclusions and exclusions checklist

Inclusions checklist
Exclusions checklist

15.3 Currency conversion rates for US$

15.4 Research methodology

15.5 Data procurement

Information sources

15.6 Data validation

15.7 Validation techniques employed for market sizing

15.8 Data synthesis

15.9 360 degree market analysis

15.10 List of abbreviations

Research Methodology

Technavio presents a detailed picture of the market by way of study, synthesis, and summation of data from multiple sources. The analysts have presented the various facets of the market with a particular focus on identifying the key industry influencers. The data thus presented is comprehensive, reliable, and the result of extensive research, both primary and secondary.

INFORMATION SOURCES

Primary sources

  • Manufacturers and suppliers
  • Channel partners
  • Industry experts
  • Strategic decision makers

Secondary sources

  • Industry journals and periodicals
  • Government data
  • Financial reports of key industry players
  • Historical data
  • Press releases

DATA ANALYSIS

Data Synthesis

  • Collation of data
  • Estimation of key figures
  • Analysis of derived insights

Data Validation

  • Triangulation with data models
  • Reference against proprietary databases
  • Corroboration with industry experts

REPORT WRITING

Qualitative

  • Market drivers
  • Market challenges
  • Market trends
  • Five forces analysis

Quantitative

  • Market size and forecast
  • Market segmentation
  • Geographical insights
  • Competitive landscape

Interested in this report?

Get your sample now to see our research methodology and insights!

Download Now

Frequently Asked Questions

AI In ERP market growth will increase by USD 13084.9 million during 2025-2029.

The AI In ERP market is expected to grow at a CAGR of 27.3% during 2025-2029.

AI In ERP market is segmented by Deployment (Cloud based, On premises) Component (Software, Services) End-user (Manufacturing, Retail and e-commerce, BFSI, Healthcare, Others)

Acumatica Inc., Aptean, Deltek Inc., Epicor Software Corp., IFS World Operations AB, Infor Inc., Katana Technologies OU, Microsoft Corp., Nominal Ltd., Odoo SA, Oracle Corp., QAD Inc., Ramco Systems Ltd., Rootstock Software, Sage Group Plc, SAP SE, ServiceNow Inc., SYSPRO Pty. Ltd., Unit4 Group Holding B.V., Workday Inc. are a few of the key vendors in the AI In ERP market.

North America will register the highest growth rate of 41% among the other regions. Therefore, the AI In ERP market in North America is expected to garner significant business opportunities for the vendors during the forecast period.

US, Canada, Germany, UK, France, Italy, China, India, Japan, South Korea, Saudi Arabia, UAE, Brazil, Argentina

  • Imperative for enhanced operational efficiency and automation is the driving factor this market.

The AI In ERP market vendors should focus on grabbing business opportunities from the Deployment segment as it accounted for the largest market share in the base year.