AI In Fashion Market Analysis, Size, and Forecast 2025-2029: North America (US), Europe (France, Germany, Italy, and UK), APAC (China, India, Japan, and South Korea), South America (Brazil), and Rest of World (ROW)

AI In Fashion Market Analysis, Size, and Forecast 2025-2029:
North America (US), Europe (France, Germany, Italy, and UK), APAC (China, India, Japan, and South Korea), South America (Brazil), and Rest of World (ROW)

Published: Jul 2025 263 Pages SKU: IRTNTR80778

Market Overview at a Glance

$10.81 B
Market Opportunity
36.9%
CAGR
30.3
YoY growth 2024-2025(%)

AI In Fashion Market Size 2025-2029

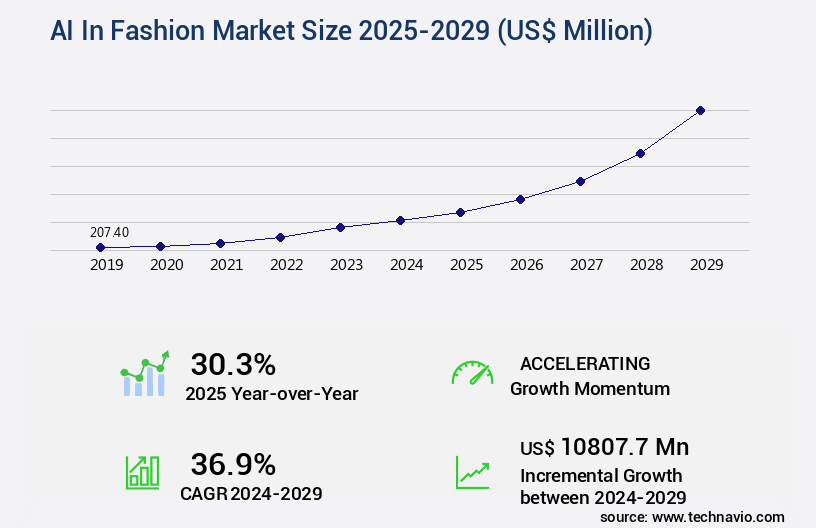
The AI in fashion market size is valued to increase USD 10.81 billion, at a CAGR of 36.9% from 2024 to 2029. Imperative for hyper-personalization and enhanced customer experience will drive the AI in fashion market.

Major Market Trends & Insights

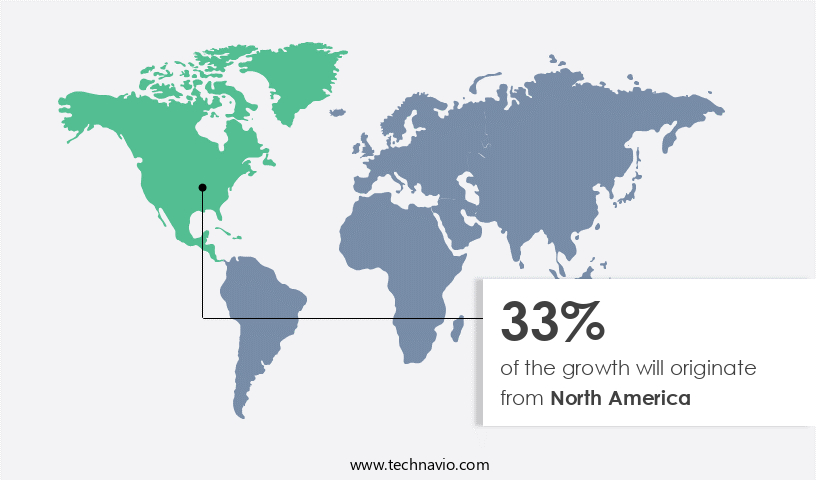
  • North America dominated the market and accounted for a 33% growth during the forecast period.
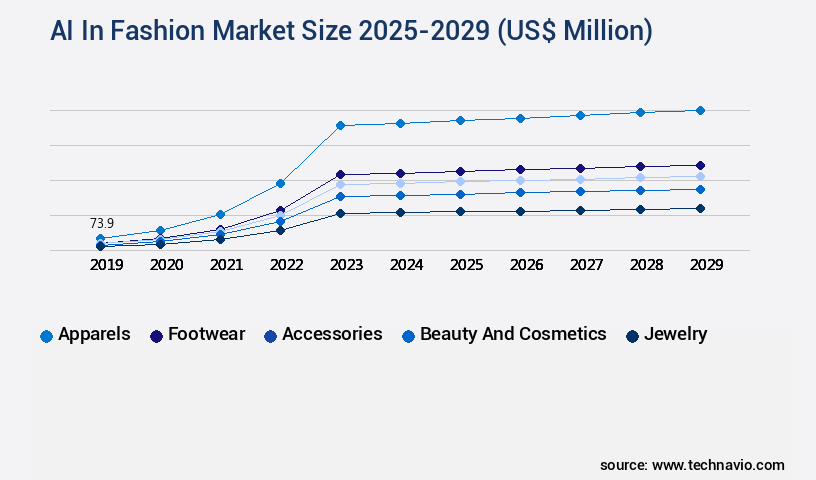
  • By Type - Apparels segment was valued at USD 73.90 billion in 2023
  • By Deployment - Cloud segment accounted for the largest market revenue share in 2023

Market Size & Forecast

  • Market Opportunities: USD 6.00 million
  • Market Future Opportunities: USD 10807.70 million
  • CAGR from 2024 to 2029 : 36.9%

Market Summary

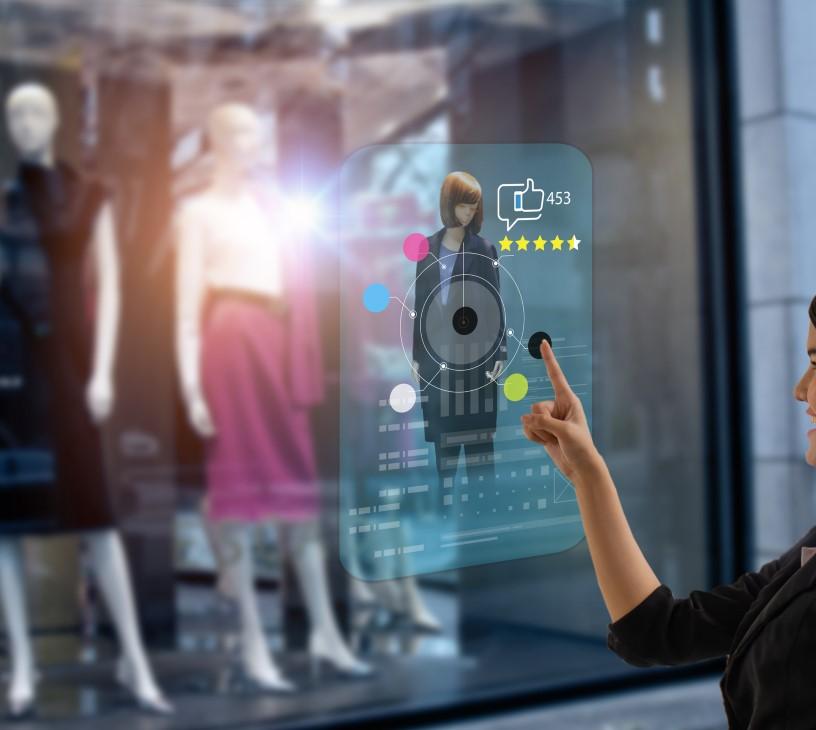
  • In the realm of business innovation, the market has emerged as a significant disruptor, revolutionizing the way apparel is designed, produced, and marketed. According to recent market intelligence, the global fashion tech industry is projected to reach a value of USD300 billion by 2025, underscoring its immense potential. AI's impact on the fashion sector is multifaceted. It enhances the customer experience by enabling hyper-personalization, tailoring recommendations based on individual preferences and purchasing histories. Moreover, generative AI is transforming creative design, producing innovative patterns and textures that challenge traditional fashion norms. However, the adoption of AI in fashion faces challenges.
  • Prohibitive implementation costs and complex systems integration hinder widespread adoption. Yet, the benefits far outweigh the obstacles. By automating repetitive tasks and streamlining production processes, AI contributes to increased efficiency and cost savings. The future of AI in fashion is bright, with endless possibilities for innovation. From virtual fitting rooms to AI-generated marketing campaigns, the potential applications are vast. As this technology continues to evolve, it will redefine the fashion industry, offering unprecedented opportunities for businesses to stay ahead of the curve.

What will be the Size of the AI In Fashion Market during the forecast period?

AI In Fashion Market Size

Get Key Insights on Market Forecast (PDF) Request Free Sample

How is the AI In Fashion Market Segmented ?

The AI in fashion industry research report provides comprehensive data (region-wise segment analysis), with forecasts and estimates in "USD million" for the period 2025-2029, as well as historical data from 2019-2023 for the following segments.

  • Type
    • Apparels
    • Footwear
    • Accessories
    • Beauty and cosmetics
    • Jewelry
  • Deployment
    • Cloud
    • On premise
  • Application
    • Product recommendation
    • Supply chain management and forecasting
    • Product search and discovery
    • Creative designing and trend forecasting
    • Customer relationship management
  • End-user
    • Fashion stores
    • Fashion designers
  • Geography
    • North America
      • US
    • Europe
      • France
      • Germany
      • Italy
      • UK
    • APAC
      • China
      • India
      • Japan
      • South Korea
    • South America
      • Brazil
    • Rest of World (ROW)

By Type Insights

The apparels segment is estimated to witness significant growth during the forecast period.

The fashion industry's apparel segment is witnessing a revolutionary transformation through the integration of artificial intelligence (AI). From haute couture to fast fashion, AI is reshaping every aspect of clothing production, addressing long-standing challenges of inefficiency, waste, and disconnected consumer demand. Driven by the pursuit of hyper-personalization, operational agility, and sustainability, AI applications span various stages of the product lifecycle. In the realm of design and trend forecasting, AI algorithms analyze vast datasets, including social media imagery, runway shows, street style photography, and real-time sales data, to predict emerging trends and their trajectory. AI-driven inventory management systems optimize stock levels based on predictive analytics, reducing excess inventory by 30%.

AI-based sizing systems ensure accurate measurements, minimizing returns. AI-powered clothing customization offers personalized fit recommendations, while 3D garment simulations enable virtual try-on experiences. Style transfer algorithms and AI-driven textile design create unique, innovative fabrics. AI-enhanced pattern grading and AI-powered customer segmentation cater to diverse consumer needs. Ethical fashion AI ensures sustainable production processes, while AI-driven fabric selection and smart textile integration promote eco-friendly materials. AI-powered design tools, sales forecasting, and trend forecasting streamline operations and boost profitability. Virtual fashion models and predictive analytics fashion further enhance the consumer experience. The future of fashion is AI-driven, offering endless possibilities for innovation and growth.

AI In Fashion Market Size

Request Free Sample

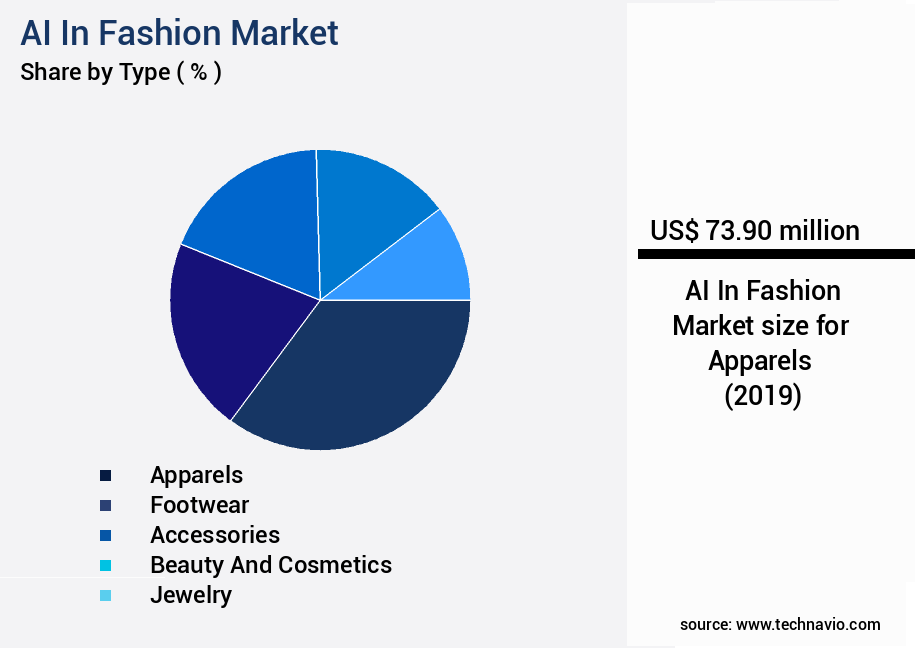
The Apparels segment was valued at USD 73.90 billion in 2019 and showed a gradual increase during the forecast period.

AI In Fashion Market Size

Request Free Sample

Regional Analysis

North America is estimated to contribute 33% to the growth of the global market during the forecast period.Technavio's analysts have elaborately explained the regional trends and drivers that shape the market during the forecast period.

AI In Fashion Market Share by Geography

See How AI In Fashion Market Demand is Rising in North America Request Free Sample

The artificial intelligence (AI) market in the fashion industry is experiencing significant growth and transformation, with North America leading the charge. This region, primarily driven by the United States and Canada, represents the largest and most mature market due to the presence of technology innovators, a robust venture capital ecosystem, influential fashion brands, and digitally savvy consumers. AI's primary applications in this sector focus on addressing commercial complexities and enhancing the customer journey. Retailers are increasingly utilizing AI for large-scale hyper-personalization, advanced demand forecasting, and the creation of seamless omnichannel experiences.

The market is projected to reach a value of over USD3.5 billion by 2027, growing at a compound annual growth rate (CAGR) of approximately 20%. These figures underscore the market's potential and the increasing importance of AI in the fashion industry.

Market Dynamics

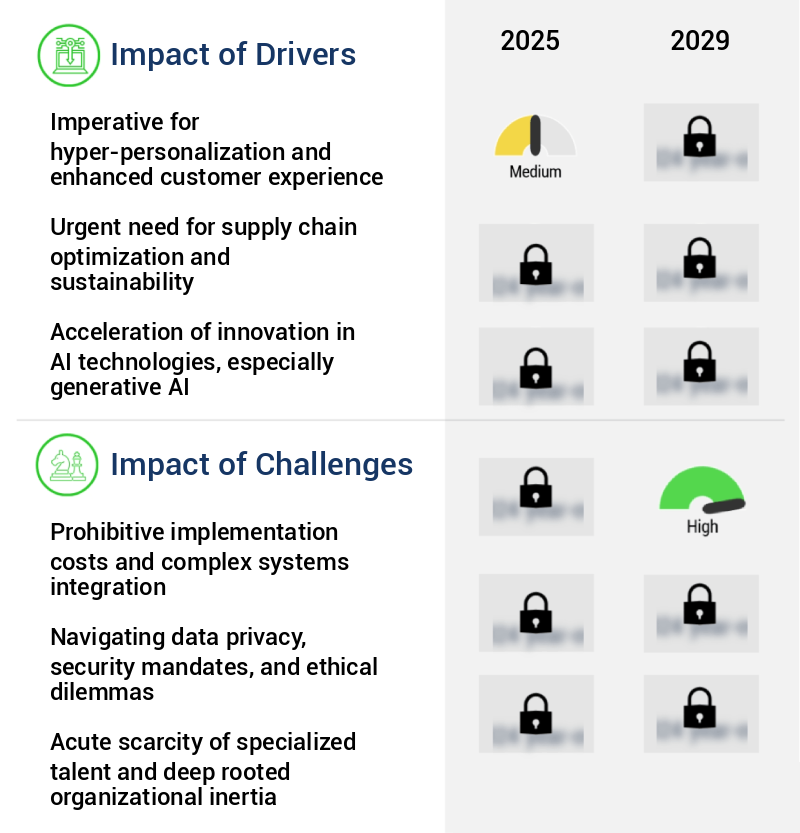
Our researchers analyzed the data with 2024 as the base year, along with the key drivers, trends, and challenges. A holistic analysis of drivers will help companies refine their marketing strategies to gain a competitive advantage.

The market is experiencing rapid growth as fashion brands and retailers seek to leverage advanced technologies to enhance their operations and better serve customers. AI algorithms for fashion trend prediction are being used to analyze vast amounts of data and identify emerging styles, allowing brands to stay ahead of the curve. Deep learning models for garment design are revolutionizing the way new products are created, enabling more accurate and efficient design processes. Computer vision applications in textile inspection ensure the highest quality standards are met, while machine learning for personalized style recommendations helps retailers provide tailored suggestions to individual customers. Generative adversarial networks for virtual fashion are transforming the industry by enabling the creation of realistic virtual models and outfits.

AI-powered supply chain optimization for apparel streamlines logistics and reduces lead times, while ai-driven demand forecasting for fashion retailers helps manage inventory levels and prevent stockouts. The use of AI in automated quality control for garments ensures consistent product quality, and its application for sustainable fashion practices reduces waste and promotes ethical sourcing. The integration of AI in fashion e-commerce platforms enhances the shopping experience by providing personalized recommendations and improving search functionality. AI-driven solutions for improving customer experience also include chatbots for customer service and virtual try-on features. Implementation of AI for optimizing fashion production ensures efficient use of resources, while ai-powered tools for enhancing fashion retail operations include analytics for consumer data and sales trends. AI-driven analysis of consumer preferences in fashion provides valuable insights for marketing strategies, and the implementation of AI for optimizing fashion production and reducing textile waste is a key focus for many brands. Overall, the role of AI in the fashion industry is transformative, touching every aspect of the value chain from design to retail.

AI In Fashion Market Size

What are the key market drivers leading to the rise in the adoption of AI In Fashion Industry?

  • The imperative factors driving market growth are hyper-personalization and the enhancement of customer experience. 
  • The fashion industry's digital transformation is marked by the increasing integration of artificial intelligence (AI). Consumers' growing preference for personalized experiences, a trend established in media streaming and e-commerce sectors, necessitates this shift. Traditional retail models no longer suffice in fostering customer loyalty or driving conversions. AI serves as the catalyst, enabling fashion brands and retailers to deliver customized interactions and product recommendations at scale. This transition elevates transactions into ongoing, engaging dialogues. According to recent studies, The market is projected to expand at a significant pace.
  • For instance, it's estimated that the market value will reach approximately 3.5 billion USD by 2027, representing a substantial growth from its current state. Another report suggests that AI-driven personalization in retail could boost sales by up to 15%, underscoring its transformative potential. 

What are the market trends shaping the AI In Fashion Industry?

  • The trend in the market involves an increasing use of generative AI in creative design and content generation. Proliferation of this technology is mandated in the upcoming industry developments.
  • The integration of generative artificial intelligence (AI) in the fashion industry signifies a significant shift in creative processes, transcending the realms of initial concept design to marketing content creation. Text-to-image and text-to-text AI models are no longer novelties but indispensable tools that amplify human creativity. Fashion designers leverage these platforms as collaborative partners, exploring an expansive design landscape at unprecedented speeds.
  • By inputting descriptive prompts, such as themes, materials, silhouettes, and historical influences, designers generate a myriad of unique visual concepts in minutes, acting as an effective brainstorming and mood boarding solution. This technology's adoption underscores the evolving nature of AI in fashion, with applications extending beyond design and into marketing, production, and consumer engagement.

What challenges does the AI In Fashion Industry face during its growth?

  • The high implementation costs and intricate systems integration represent significant challenges that hinder industry growth. 
  • The integration of artificial intelligence (AI) in the fashion market is a dynamic and evolving process, presenting significant opportunities across various sectors. The financial investment required for AI implementation goes beyond software licensing, encompassing the acquisition of high-performance computing hardware, particularly graphic processing units (GPUs), which are crucial for training and executing intricate machine learning models. This demand for advanced components has led to a competitive and expensive market. For instance, in March 2024, NVIDIA introduced its next-generation Blackwell architecture GPUs, promising a substantial performance increase for AI model training and inference.
  • Despite the substantial investment, the benefits of AI in fashion are substantial. AI applications in fashion include personalized shopping recommendations, inventory management, and quality control, offering increased efficiency and improved customer experiences.

Exclusive Technavio Analysis on Customer Landscape

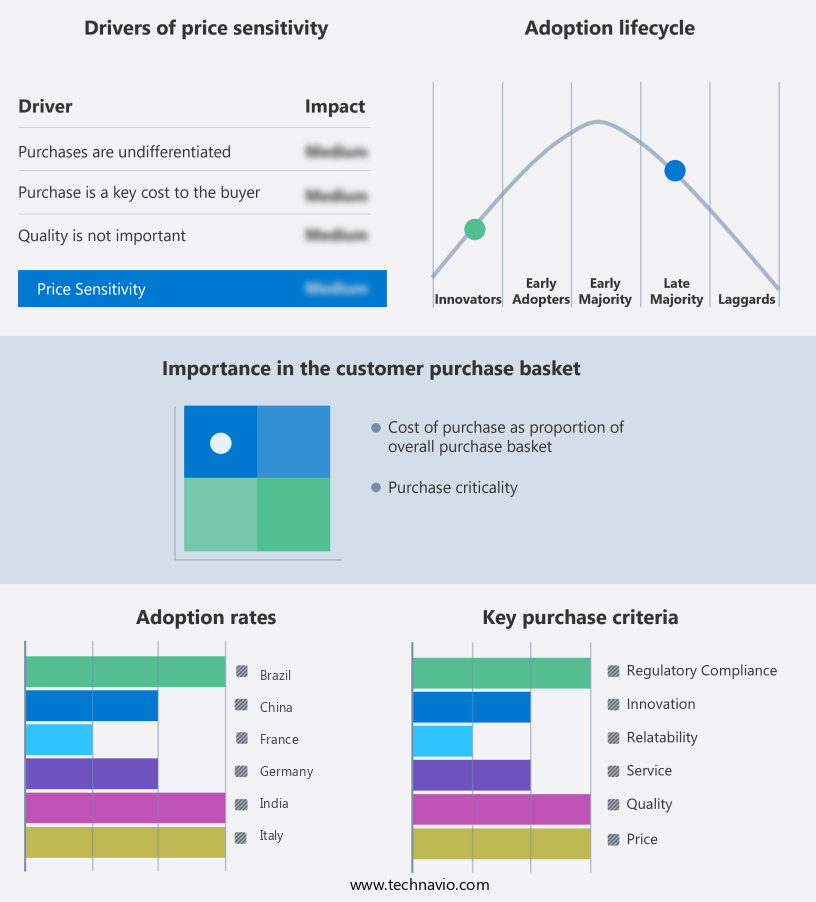
The ai in fashion market forecasting report includes the adoption lifecycle of the market, covering from the innovator's stage to the laggard's stage. It focuses on adoption rates in different regions based on penetration. Furthermore, the ai in fashion market report also includes key purchase criteria and drivers of price sensitivity to help companies evaluate and develop their market growth analysis strategies.

AI In Fashion Market Share by Geography

 Customer Landscape of AI In Fashion Industry

Competitive Landscape

Companies are implementing various strategies, such as strategic alliances, ai in fashion market forecast, partnerships, mergers and acquisitions, geographical expansion, and product/service launches, to enhance their presence in the industry.

A Mad Street Den - The company revolutionizes the fashion industry with Vue.Ai, an advanced AI solution. It delivers personalized styling, visual search, inclusive model generation, and outfit recommendations, utilizing computer vision and deep learning technologies.

The industry research and growth report includes detailed analyses of the competitive landscape of the market and information about key companies, including:

  • A Mad Street Den
  • Adobe Inc.
  • Amazon Web Services Inc.
  • athena studio
  • Botika
  • Doji
  • Google Cloud
  • International Business Machines Corp.
  • LiquiDonate.
  • Microsoft Corp.
  • Oracle Corp.
  • Raspberry AI
  • Revieve Inc.
  • Salesforce Inc.
  • SAP SE
  • SpangleAI
  • Stylumia Intelligence Technology Pvt Ltd
  • Veesual AI
  • vody

Qualitative and quantitative analysis of companies has been conducted to help clients understand the wider business environment as well as the strengths and weaknesses of key industry players. Data is qualitatively analyzed to categorize companies as pure play, category-focused, industry-focused, and diversified; it is quantitatively analyzed to categorize companies as dominant, leading, strong, tentative, and weak.

Recent Development and News in AI In Fashion Market

  • In January 2024, H&M Group, a leading fashion retailer, announced the launch of its AI-powered virtual stylist named "Ivyrevel," which offers personalized fashion recommendations to customers based on their style preferences and previous purchases (H&M Press Release, 2024).
  • In March 2024, Zara, another fashion industry giant, partnered with IBM to implement AI and machine learning technologies in their supply chain and inventory management systems, aiming to improve product availability and reduce stockouts (IBM Press Release, 2024).
  • In May 2024, The North Face, an outdoor apparel brand, raised USD20 million in a Series B funding round led by Intel Capital to further develop its AI-driven product design and development process (Crunchbase News, 2024).
  • In April 2025, Adidas and Microsoft Corporation unveiled their strategic partnership to integrate Microsoft Azure's AI capabilities into Adidas' digital products and services, enhancing personalization and customer experience (Microsoft News Center, 2025).

Dive into Technavio's robust research methodology, blending expert interviews, extensive data synthesis, and validated models for unparalleled AI In Fashion Market insights. See full methodology.

Market Scope

Report Coverage

Details

Page number

263

Base year

2024

Historic period

2019-2023

Forecast period

2025-2029

Growth momentum & CAGR

Accelerate at a CAGR of 36.9%

Market growth 2025-2029

USD 10807.7 million

Market structure

Fragmented

YoY growth 2024-2025(%)

30.3

Key countries

US, China, UK, South Korea, Germany, Japan, India, France, Italy, and Brazil

Competitive landscape

Leading Companies, Market Positioning of Companies, Competitive Strategies, and Industry Risks

Request Free Sample

Research Analyst Overview

  • The AI market in fashion continues to evolve, revolutionizing various sectors with its advanced capabilities. Deep learning algorithms are transforming fashion industries, enabling AI-driven inventory management and optimizing stock levels based on consumer demand. AI-based sizing systems streamline production processes, ensuring accurate measurements and reducing returns. AI-powered clothing customization offers personalized fashion recommendations, allowing consumers to create unique, tailor-made outfits. Virtual try-on technology, fueled by computer vision fashion, lets customers preview garments on a 3D model of themselves before making a purchase. Machine learning apparel designs innovative textiles and patterns, while AI-enhanced pattern grading automates the process, saving time and resources.
  • AI-powered fashion marketing delivers targeted promotions and personalized offers, increasing customer engagement and sales. Predictive analytics fashion uses data to forecast trends and demand, helping brands stay ahead of the curve. Ethical fashion AI ensures sustainable practices and ethical labor conditions, addressing growing consumer concerns. Virtual fashion models showcase designs in realistic, diverse ways, while AI fabric analysis ensures the quality and sustainability of materials. Generative AI fashion creates unique, original designs, and automated pattern creation streamlines the design process. AI-driven sales and trend forecasting, smart textile integration, and AI-powered styling apps further enhance the fashion industry's digital transformation.
  • According to recent industry reports, the global AI market in fashion is expected to grow by 25% annually, underscoring the immense potential and continuous dynamism of this sector. For instance, a leading fashion brand reported a 30% increase in sales after implementing an AI-powered inventory management system. The future of fashion is undeniably AI-driven.

What are the Key Data Covered in this AI In Fashion Market Research and Growth Report?

  • What is the expected growth of the AI In Fashion Market between 2025 and 2029?

    • USD 10.81 billion, at a CAGR of 36.9%

  • What segmentation does the market report cover?

    • The report is segmented by Type (Apparels, Footwear, Accessories, Beauty and cosmetics, and Jewelry), Deployment (Cloud and On premise), Application (Product recommendation, Supply chain management and forecasting, Product search and discovery, Creative designing and trend forecasting, and Customer relationship management), End-user (Fashion stores and Fashion designers), and Geography (North America, Europe, APAC, South America, and Middle East and Africa)

  • Which regions are analyzed in the report?

    • North America, Europe, APAC, South America, and Middle East and Africa

  • What are the key growth drivers and market challenges?

    • Imperative for hyper-personalization and enhanced customer experience, Prohibitive implementation costs and complex systems integration

  • Who are the major players in the AI In Fashion Market?

    • A Mad Street Den, Adobe Inc., Amazon Web Services Inc., athena studio, Botika, Doji, Google Cloud, International Business Machines Corp., LiquiDonate., Microsoft Corp., Oracle Corp., Raspberry AI, Revieve Inc., Salesforce Inc., SAP SE, SpangleAI, Stylumia Intelligence Technology Pvt Ltd, Veesual AI, and vody

Market Research Insights

  • The market for AI in fashion is a dynamic and ever-evolving space, encompassing various applications such as visual merchandising, photography, garment fitting, retail analytics, consumer insights, customization, e-commerce, design collaboration, brand building, design iteration, textile printing, pattern making, clothing manufacturing, fabric sourcing, virtual styling, fashion storytelling, styling advice, and visual search. Two significant data points illustrate the market's growth and impact. First, AI-driven fashion retailers have reported a sales increase of up to 30% due to personalized recommendations based on consumer preferences and shopping history.
  • This outcome highlights the potential of AI to enhance the shopping experience and drive sales growth. Second, industry analysts predict that The market will expand at a compound annual growth rate of 25% over the next five years, reflecting the increasing adoption of AI technologies across the fashion value chain.

We can help! Our analysts can customize this AI in fashion market research report to meet your requirements.

Get in touch

1 Executive Summary

  • 1.1 Market overview
    • Executive Summary - Chart on Market Overview
    • Executive Summary - Data Table on Market Overview
    • Executive Summary - Chart on Global Market Characteristics
    • Executive Summary - Chart on Market by Geography
    • Executive Summary - Chart on Market Segmentation by Type
    • Executive Summary - Chart on Market Segmentation by Deployment
    • Executive Summary - Chart on Market Segmentation by Application
    • Executive Summary - Chart on Market Segmentation by End-user
    • Executive Summary - Chart on Incremental Growth
    • Executive Summary - Data Table on Incremental Growth
    • Executive Summary - Chart on Company Market Positioning

2 Technavio Analysis

  • 2.1 Analysis of price sensitivity, lifecycle, customer purchase basket, adoption rates, and purchase criteria
    • Analysis of price sensitivity, lifecycle, customer purchase basket, adoption rates, and purchase criteria
  • 2.2 Criticality of inputs and Factors of differentiation
    • Overview on criticality of inputs and factors of differentiation
  • 2.3 Factors of disruption
    • Overview on factors of disruption
  • 2.4 Impact of drivers and challenges
    • Impact of drivers and challenges in 2024 and 2029

3 Market Landscape

  • 3.1 Market ecosystem
    • Parent Market
    • Data Table on - Parent Market
  • 3.2 Market characteristics
    • Market characteristics analysis
  • 3.3 Value chain analysis
    • Value chain analysis

4 Market Sizing

  • 4.1 Market definition
    • Offerings of companies included in the market definition
  • 4.2 Market segment analysis
    • Market segments
  • 4.3 Market size 2024
    • 4.4 Market outlook: Forecast for 2024-2029
      • Chart on Global - Market size and forecast 2024-2029 ($ million)
      • Data Table on Global - Market size and forecast 2024-2029 ($ million)
      • Chart on Global Market: Year-over-year growth 2024-2029 (%)
      • Data Table on Global Market: Year-over-year growth 2024-2029 (%)

    5 Historic Market Size

    • 5.1 Global AI In Fashion Market 2019 - 2023
      • Historic Market Size - Data Table on Global AI In Fashion Market 2019 - 2023 ($ million)
    • 5.2 Type segment analysis 2019 - 2023
      • Historic Market Size - Type Segment 2019 - 2023 ($ million)
    • 5.3 Deployment segment analysis 2019 - 2023
      • Historic Market Size - Deployment Segment 2019 - 2023 ($ million)
    • 5.4 Application segment analysis 2019 - 2023
      • Historic Market Size - Application Segment 2019 - 2023 ($ million)
    • 5.5 End-user segment analysis 2019 - 2023
      • Historic Market Size - End-user Segment 2019 - 2023 ($ million)
    • 5.6 Geography segment analysis 2019 - 2023
      • Historic Market Size - Geography Segment 2019 - 2023 ($ million)
    • 5.7 Country segment analysis 2019 - 2023
      • Historic Market Size - Country Segment 2019 - 2023 ($ million)

    6 Five Forces Analysis

    • 6.1 Five forces summary
      • Five forces analysis - Comparison between 2024 and 2029
    • 6.2 Bargaining power of buyers
      • Bargaining power of buyers - Impact of key factors 2024 and 2029
    • 6.3 Bargaining power of suppliers
      • Bargaining power of suppliers - Impact of key factors in 2024 and 2029
    • 6.4 Threat of new entrants
      • Threat of new entrants - Impact of key factors in 2024 and 2029
    • 6.5 Threat of substitutes
      • Threat of substitutes - Impact of key factors in 2024 and 2029
    • 6.6 Threat of rivalry
      • Threat of rivalry - Impact of key factors in 2024 and 2029
    • 6.7 Market condition
      • Chart on Market condition - Five forces 2024 and 2029

    7 Market Segmentation by Type

    • 7.1 Market segments
      • Chart on Type - Market share 2024-2029 (%)
      • Data Table on Type - Market share 2024-2029 (%)
    • 7.2 Comparison by Type
      • Chart on Comparison by Type
      • Data Table on Comparison by Type
    • 7.3 Apparels - Market size and forecast 2024-2029
      • Chart on Apparels - Market size and forecast 2024-2029 ($ million)
      • Data Table on Apparels - Market size and forecast 2024-2029 ($ million)
      • Chart on Apparels - Year-over-year growth 2024-2029 (%)
      • Data Table on Apparels - Year-over-year growth 2024-2029 (%)
    • 7.4 Footwear - Market size and forecast 2024-2029
      • Chart on Footwear - Market size and forecast 2024-2029 ($ million)
      • Data Table on Footwear - Market size and forecast 2024-2029 ($ million)
      • Chart on Footwear - Year-over-year growth 2024-2029 (%)
      • Data Table on Footwear - Year-over-year growth 2024-2029 (%)
    • 7.5 Accessories - Market size and forecast 2024-2029
      • Chart on Accessories - Market size and forecast 2024-2029 ($ million)
      • Data Table on Accessories - Market size and forecast 2024-2029 ($ million)
      • Chart on Accessories - Year-over-year growth 2024-2029 (%)
      • Data Table on Accessories - Year-over-year growth 2024-2029 (%)
    • 7.6 Beauty and cosmetics - Market size and forecast 2024-2029
      • Chart on Beauty and cosmetics - Market size and forecast 2024-2029 ($ million)
      • Data Table on Beauty and cosmetics - Market size and forecast 2024-2029 ($ million)
      • Chart on Beauty and cosmetics - Year-over-year growth 2024-2029 (%)
      • Data Table on Beauty and cosmetics - Year-over-year growth 2024-2029 (%)
    • 7.7 Jewelry - Market size and forecast 2024-2029
      • Chart on Jewelry - Market size and forecast 2024-2029 ($ million)
      • Data Table on Jewelry - Market size and forecast 2024-2029 ($ million)
      • Chart on Jewelry - Year-over-year growth 2024-2029 (%)
      • Data Table on Jewelry - Year-over-year growth 2024-2029 (%)
    • 7.8 Market opportunity by Type
      • Market opportunity by Type ($ million)
      • Data Table on Market opportunity by Type ($ million)

    8 Market Segmentation by Deployment

    • 8.1 Market segments
      • Chart on Deployment - Market share 2024-2029 (%)
      • Data Table on Deployment - Market share 2024-2029 (%)
    • 8.2 Comparison by Deployment
      • Chart on Comparison by Deployment
      • Data Table on Comparison by Deployment
    • 8.3 Cloud - Market size and forecast 2024-2029
      • Chart on Cloud - Market size and forecast 2024-2029 ($ million)
      • Data Table on Cloud - Market size and forecast 2024-2029 ($ million)
      • Chart on Cloud - Year-over-year growth 2024-2029 (%)
      • Data Table on Cloud - Year-over-year growth 2024-2029 (%)
    • 8.4 On premise - Market size and forecast 2024-2029
      • Chart on On premise - Market size and forecast 2024-2029 ($ million)
      • Data Table on On premise - Market size and forecast 2024-2029 ($ million)
      • Chart on On premise - Year-over-year growth 2024-2029 (%)
      • Data Table on On premise - Year-over-year growth 2024-2029 (%)
    • 8.5 Market opportunity by Deployment
      • Market opportunity by Deployment ($ million)
      • Data Table on Market opportunity by Deployment ($ million)

    9 Market Segmentation by Application

    • 9.1 Market segments
      • Chart on Application - Market share 2024-2029 (%)
      • Data Table on Application - Market share 2024-2029 (%)
    • 9.2 Comparison by Application
      • Chart on Comparison by Application
      • Data Table on Comparison by Application
    • 9.3 Product recommendation - Market size and forecast 2024-2029
      • Chart on Product recommendation - Market size and forecast 2024-2029 ($ million)
      • Data Table on Product recommendation - Market size and forecast 2024-2029 ($ million)
      • Chart on Product recommendation - Year-over-year growth 2024-2029 (%)
      • Data Table on Product recommendation - Year-over-year growth 2024-2029 (%)
    • 9.4 Supply chain management and forecasting - Market size and forecast 2024-2029
      • Chart on Supply chain management and forecasting - Market size and forecast 2024-2029 ($ million)
      • Data Table on Supply chain management and forecasting - Market size and forecast 2024-2029 ($ million)
      • Chart on Supply chain management and forecasting - Year-over-year growth 2024-2029 (%)
      • Data Table on Supply chain management and forecasting - Year-over-year growth 2024-2029 (%)
    • 9.5 Product search and discovery - Market size and forecast 2024-2029
      • Chart on Product search and discovery - Market size and forecast 2024-2029 ($ million)
      • Data Table on Product search and discovery - Market size and forecast 2024-2029 ($ million)
      • Chart on Product search and discovery - Year-over-year growth 2024-2029 (%)
      • Data Table on Product search and discovery - Year-over-year growth 2024-2029 (%)
    • 9.6 Creative designing and trend forecasting - Market size and forecast 2024-2029
      • Chart on Creative designing and trend forecasting - Market size and forecast 2024-2029 ($ million)
      • Data Table on Creative designing and trend forecasting - Market size and forecast 2024-2029 ($ million)
      • Chart on Creative designing and trend forecasting - Year-over-year growth 2024-2029 (%)
      • Data Table on Creative designing and trend forecasting - Year-over-year growth 2024-2029 (%)
    • 9.7 Customer relationship management - Market size and forecast 2024-2029
      • Chart on Customer relationship management - Market size and forecast 2024-2029 ($ million)
      • Data Table on Customer relationship management - Market size and forecast 2024-2029 ($ million)
      • Chart on Customer relationship management - Year-over-year growth 2024-2029 (%)
      • Data Table on Customer relationship management - Year-over-year growth 2024-2029 (%)
    • 9.8 Market opportunity by Application
      • Market opportunity by Application ($ million)
      • Data Table on Market opportunity by Application ($ million)

    10 Market Segmentation by End-user

    • 10.1 Market segments
      • Chart on End-user - Market share 2024-2029 (%)
      • Data Table on End-user - Market share 2024-2029 (%)
    • 10.2 Comparison by End-user
      • Chart on Comparison by End-user
      • Data Table on Comparison by End-user
    • 10.3 Fashion stores - Market size and forecast 2024-2029
      • Chart on Fashion stores - Market size and forecast 2024-2029 ($ million)
      • Data Table on Fashion stores - Market size and forecast 2024-2029 ($ million)
      • Chart on Fashion stores - Year-over-year growth 2024-2029 (%)
      • Data Table on Fashion stores - Year-over-year growth 2024-2029 (%)
    • 10.4 Fashion designers - Market size and forecast 2024-2029
      • Chart on Fashion designers - Market size and forecast 2024-2029 ($ million)
      • Data Table on Fashion designers - Market size and forecast 2024-2029 ($ million)
      • Chart on Fashion designers - Year-over-year growth 2024-2029 (%)
      • Data Table on Fashion designers - Year-over-year growth 2024-2029 (%)
    • 10.5 Market opportunity by End-user
      • Market opportunity by End-user ($ million)
      • Data Table on Market opportunity by End-user ($ million)

    11 Customer Landscape

    • 11.1 Customer landscape overview
      • Analysis of price sensitivity, lifecycle, customer purchase basket, adoption rates, and purchase criteria

    12 Geographic Landscape

    • 12.1 Geographic segmentation
      • Chart on Market share by geography 2024-2029 (%)
      • Data Table on Market share by geography 2024-2029 (%)
    • 12.2 Geographic comparison
      • Chart on Geographic comparison
      • Data Table on Geographic comparison
    • 12.3 North America - Market size and forecast 2024-2029
      • Chart on North America - Market size and forecast 2024-2029 ($ million)
      • Data Table on North America - Market size and forecast 2024-2029 ($ million)
      • Chart on North America - Year-over-year growth 2024-2029 (%)
      • Data Table on North America - Year-over-year growth 2024-2029 (%)
    • 12.4 Europe - Market size and forecast 2024-2029
      • Chart on Europe - Market size and forecast 2024-2029 ($ million)
      • Data Table on Europe - Market size and forecast 2024-2029 ($ million)
      • Chart on Europe - Year-over-year growth 2024-2029 (%)
      • Data Table on Europe - Year-over-year growth 2024-2029 (%)
    • 12.5 APAC - Market size and forecast 2024-2029
      • Chart on APAC - Market size and forecast 2024-2029 ($ million)
      • Data Table on APAC - Market size and forecast 2024-2029 ($ million)
      • Chart on APAC - Year-over-year growth 2024-2029 (%)
      • Data Table on APAC - Year-over-year growth 2024-2029 (%)
    • 12.6 South America - Market size and forecast 2024-2029
      • Chart on South America - Market size and forecast 2024-2029 ($ million)
      • Data Table on South America - Market size and forecast 2024-2029 ($ million)
      • Chart on South America - Year-over-year growth 2024-2029 (%)
      • Data Table on South America - Year-over-year growth 2024-2029 (%)
    • 12.7 Middle East and Africa - Market size and forecast 2024-2029
      • Chart on Middle East and Africa - Market size and forecast 2024-2029 ($ million)
      • Data Table on Middle East and Africa - Market size and forecast 2024-2029 ($ million)
      • Chart on Middle East and Africa - Year-over-year growth 2024-2029 (%)
      • Data Table on Middle East and Africa - Year-over-year growth 2024-2029 (%)
    • 12.8 US - Market size and forecast 2024-2029
      • Chart on US - Market size and forecast 2024-2029 ($ million)
      • Data Table on US - Market size and forecast 2024-2029 ($ million)
      • Chart on US - Year-over-year growth 2024-2029 (%)
      • Data Table on US - Year-over-year growth 2024-2029 (%)
    • 12.9 China - Market size and forecast 2024-2029
      • Chart on China - Market size and forecast 2024-2029 ($ million)
      • Data Table on China - Market size and forecast 2024-2029 ($ million)
      • Chart on China - Year-over-year growth 2024-2029 (%)
      • Data Table on China - Year-over-year growth 2024-2029 (%)
    • 12.10 UK - Market size and forecast 2024-2029
      • Chart on UK - Market size and forecast 2024-2029 ($ million)
      • Data Table on UK - Market size and forecast 2024-2029 ($ million)
      • Chart on UK - Year-over-year growth 2024-2029 (%)
      • Data Table on UK - Year-over-year growth 2024-2029 (%)
    • 12.11 Germany - Market size and forecast 2024-2029
      • Chart on Germany - Market size and forecast 2024-2029 ($ million)
      • Data Table on Germany - Market size and forecast 2024-2029 ($ million)
      • Chart on Germany - Year-over-year growth 2024-2029 (%)
      • Data Table on Germany - Year-over-year growth 2024-2029 (%)
    • 12.12 South Korea - Market size and forecast 2024-2029
      • Chart on South Korea - Market size and forecast 2024-2029 ($ million)
      • Data Table on South Korea - Market size and forecast 2024-2029 ($ million)
      • Chart on South Korea - Year-over-year growth 2024-2029 (%)
      • Data Table on South Korea - Year-over-year growth 2024-2029 (%)
    • 12.13 Japan - Market size and forecast 2024-2029
      • Chart on Japan - Market size and forecast 2024-2029 ($ million)
      • Data Table on Japan - Market size and forecast 2024-2029 ($ million)
      • Chart on Japan - Year-over-year growth 2024-2029 (%)
      • Data Table on Japan - Year-over-year growth 2024-2029 (%)
    • 12.14 France - Market size and forecast 2024-2029
      • Chart on France - Market size and forecast 2024-2029 ($ million)
      • Data Table on France - Market size and forecast 2024-2029 ($ million)
      • Chart on France - Year-over-year growth 2024-2029 (%)
      • Data Table on France - Year-over-year growth 2024-2029 (%)
    • 12.15 India - Market size and forecast 2024-2029
      • Chart on India - Market size and forecast 2024-2029 ($ million)
      • Data Table on India - Market size and forecast 2024-2029 ($ million)
      • Chart on India - Year-over-year growth 2024-2029 (%)
      • Data Table on India - Year-over-year growth 2024-2029 (%)
    • 12.16 Brazil - Market size and forecast 2024-2029
      • Chart on Brazil - Market size and forecast 2024-2029 ($ million)
      • Data Table on Brazil - Market size and forecast 2024-2029 ($ million)
      • Chart on Brazil - Year-over-year growth 2024-2029 (%)
      • Data Table on Brazil - Year-over-year growth 2024-2029 (%)
    • 12.17 Italy - Market size and forecast 2024-2029
      • Chart on Italy - Market size and forecast 2024-2029 ($ million)
      • Data Table on Italy - Market size and forecast 2024-2029 ($ million)
      • Chart on Italy - Year-over-year growth 2024-2029 (%)
      • Data Table on Italy - Year-over-year growth 2024-2029 (%)
    • 12.18 Market opportunity by geography
      • Market opportunity by geography ($ million)
      • Data Tables on Market opportunity by geography ($ million)

    13 Drivers, Challenges, and Opportunity/Restraints

    • 13.1 Market drivers
      • 13.2 Market challenges
        • 13.3 Impact of drivers and challenges
          • Impact of drivers and challenges in 2024 and 2029
        • 13.4 Market opportunities/restraints

          14 Competitive Landscape

          • 14.1 Overview
            • 14.2 Competitive Landscape
              • Overview on criticality of inputs and factors of differentiation
            • 14.3 Landscape disruption
              • Overview on factors of disruption
            • 14.4 Industry risks
              • Impact of key risks on business

            15 Competitive Analysis

            • 15.1 Companies profiled
              • Companies covered
            • 15.2 Company ranking index
              • Company ranking index
            • 15.3 Market positioning of companies
              • Matrix on companies position and classification
            • 15.4 A Mad Street Den
              • A Mad Street Den - Overview
              • A Mad Street Den - Product / Service
              • A Mad Street Den - Key offerings
              • SWOT
            • 15.5 Adobe Inc.
              • Adobe Inc. - Overview
              • Adobe Inc. - Business segments
              • Adobe Inc. - Key news
              • Adobe Inc. - Key offerings
              • Adobe Inc. - Segment focus
              • SWOT
            • 15.6 Amazon Web Services Inc.
              • Amazon Web Services Inc. - Overview
              • Amazon Web Services Inc. - Product / Service
              • Amazon Web Services Inc. - Key news
              • Amazon Web Services Inc. - Key offerings
              • SWOT
            • 15.7 Botika
              • Botika - Overview
              • Botika - Product / Service
              • Botika - Key offerings
              • SWOT
            • 15.8 Doji
              • Doji - Overview
              • Doji - Product / Service
              • Doji - Key offerings
              • SWOT
            • 15.9 Google Cloud
              • Google Cloud - Overview
              • Google Cloud - Product / Service
              • Google Cloud - Key offerings
              • SWOT
            • 15.10 International Business Machines Corp.
              • International Business Machines Corp. - Overview
              • International Business Machines Corp. - Business segments
              • International Business Machines Corp. - Key news
              • International Business Machines Corp. - Key offerings
              • International Business Machines Corp. - Segment focus
              • SWOT
            • 15.11 Microsoft Corp.
              • Microsoft Corp. - Overview
              • Microsoft Corp. - Business segments
              • Microsoft Corp. - Key news
              • Microsoft Corp. - Key offerings
              • Microsoft Corp. - Segment focus
              • SWOT
            • 15.12 Oracle Corp.
              • Oracle Corp. - Overview
              • Oracle Corp. - Business segments
              • Oracle Corp. - Key news
              • Oracle Corp. - Key offerings
              • Oracle Corp. - Segment focus
              • SWOT
            • 15.13 Raspberry AI
              • Raspberry AI - Overview
              • Raspberry AI - Product / Service
              • Raspberry AI - Key offerings
              • SWOT
            • 15.14 Salesforce Inc.
              • Salesforce Inc. - Overview
              • Salesforce Inc. - Product / Service
              • Salesforce Inc. - Key news
              • Salesforce Inc. - Key offerings
              • SWOT
            • 15.15 SAP SE
              • SAP SE - Overview
              • SAP SE - Business segments
              • SAP SE - Key news
              • SAP SE - Key offerings
              • SAP SE - Segment focus
              • SWOT
            • 15.16 SpangleAI
              • SpangleAI - Overview
              • SpangleAI - Product / Service
              • SpangleAI - Key offerings
              • SWOT
            • 15.17 Stylumia Intelligence Technology Pvt Ltd
              • Stylumia Intelligence Technology Pvt Ltd - Overview
              • Stylumia Intelligence Technology Pvt Ltd - Product / Service
              • Stylumia Intelligence Technology Pvt Ltd - Key offerings
              • SWOT
            • 15.18 Veesual AI
              • Veesual AI - Overview
              • Veesual AI - Product / Service
              • Veesual AI - Key offerings
              • SWOT

            16 Appendix

            • 16.1 Scope of the report
              • 16.2 Inclusions and exclusions checklist
                • Inclusions checklist
                • Exclusions checklist
              • 16.3 Currency conversion rates for US$
                • Currency conversion rates for US$
              • 16.4 Research methodology
                • Research methodology
              • 16.5 Data procurement
                • Information sources
              • 16.6 Data validation
                • Data validation
              • 16.7 Validation techniques employed for market sizing
                • Validation techniques employed for market sizing
              • 16.8 Data synthesis
                • Data synthesis
              • 16.9 360 degree market analysis
                • 360 degree market analysis
              • 16.10 List of abbreviations
                • List of abbreviations

              Research Methodology

              Technavio presents a detailed picture of the market by way of study, synthesis, and summation of data from multiple sources. The analysts have presented the various facets of the market with a particular focus on identifying the key industry influencers. The data thus presented is comprehensive, reliable, and the result of extensive research, both primary and secondary.

              INFORMATION SOURCES

              Primary sources

              • Manufacturers and suppliers
              • Channel partners
              • Industry experts
              • Strategic decision makers

              Secondary sources

              • Industry journals and periodicals
              • Government data
              • Financial reports of key industry players
              • Historical data
              • Press releases

              DATA ANALYSIS

              Data Synthesis

              • Collation of data
              • Estimation of key figures
              • Analysis of derived insights

              Data Validation

              • Triangulation with data models
              • Reference against proprietary databases
              • Corroboration with industry experts

              REPORT WRITING

              Qualitative

              • Market drivers
              • Market challenges
              • Market trends
              • Five forces analysis

              Quantitative

              • Market size and forecast
              • Market segmentation
              • Geographical insights
              • Competitive landscape

              Interested in this report?

              Get your sample now to see our research methodology and insights!

              Download Now

              Frequently Asked Questions

              Ai In Fashion market growth will increase by $ 10807.7 mn during 2025-2029.

              The Ai In Fashion market is expected to grow at a CAGR of 36.9% during 2025-2029.

              Ai In Fashion market is segmented by Type( Apparels, Footwear, Accessories, Beauty and cosmetics, Jewelry) Deployment( Cloud, On premise) Application( Product recommendation, Supply chain management and forecasting, Product search and discovery, Creative designing and trend forecasting, Customer relationship management)

              A Mad Street Den, Adobe Inc., Amazon Web Services Inc., athena studio, Botika, Doji, Google Cloud, International Business Machines Corp., LiquiDonate., Microsoft Corp., Oracle Corp., Raspberry AI, Revieve Inc., Salesforce Inc., SAP SE, SpangleAI, Stylumia Intelligence Technology Pvt Ltd, Veesual AI, vody are a few of the key vendors in the Ai In Fashion market.

              North America will register the highest growth rate of 33% among the other regions. Therefore, the Ai In Fashion market in North America is expected to garner significant business opportunities for the vendors during the forecast period.

              US, China, UK, South Korea, Germany, Japan, India, France, Italy, Brazil

              • Imperative for hyper-personalization and enhanced customer experienceA primary and powerful driver propelling the adoption of artificial intelligence in the fashion industry is the escalating consumer demand for hyper-personalized experiences. In the contemporary digital marketplace is the driving factor this market.
              • shoppers have been conditioned by other sectors is the driving factor this market.
              • such as media streaming and e-commerce giants is the driving factor this market.
              • to expect interactions and product offerings that are tailored specifically to their individual tastes is the driving factor this market.
              • behaviors is the driving factor this market.
              • and needs. The one-size-fits-all approach to retail is no longer viable for fostering customer loyalty or driving conversions. AI is the core enabling technology that allows fashion brands and retailers to deliver this personalization at scale is the driving factor this market.
              • transforming a transactional relationship into an engaging and continuous dialogue. This is achieved through a suite of sophisticated AI applications. Machine learning-powered recommendation engines are the most prominent example is the driving factor this market.
              • analyzing vast datasets including a user browsing history is the driving factor this market.
              • past purchases is the driving factor this market.
              • items added to a cart is the driving factor this market.
              • and even dwell time on specific products to present a curated selection of relevant items. These systems move beyond simple customers who bought this also bought logic to understand nuanced stylistic affinities and predict future interests. Furthermore is the driving factor this market.
              • AI facilitates personalized marketing communications is the driving factor this market.
              • from emails with dynamically inserted products to social media advertisements targeted based on deep behavioral analytics. A critical innovation in this domain is the advancement of virtual try-on (VTO) technology. Powered by computer vision and augmented reality is the driving factor this market.
              • VTO solutions allow consumers to visualize how clothing is the driving factor this market.
              • accessories is the driving factor this market.
              • or cosmetics will look on their own body or face is the driving factor this market.
              • directly addressing the largest barrier to online fashion sales: uncertainty about fit and appearance. By providing a more confident and interactive shopping experience is the driving factor this market.
              • VTO not only increases conversion rates but also significantly reduces the high operational costs and environmental impact associated with product returns. In a fiercely competitive and saturated market is the driving factor this market.
              • the ability to deliver a superior is the driving factor this market.
              • personalized journey is a key differentiator. AI provides the tools to understand and cater to the individual customer is the driving factor this market.
              • fostering a sense of brand affinity and loyalty that is crucial for long-term growth and profitability. is the driving factor this market.

              The Ai In Fashion market vendors should focus on grabbing business opportunities from the Apparels segment as it accounted for the largest market share in the base year.