
AI In Learning And Development Market Size 2025-2029
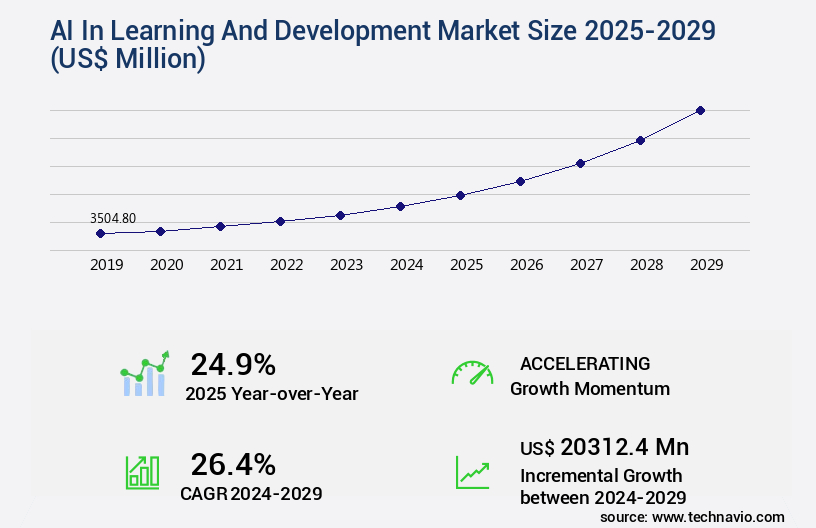
The AI in learning and development market size is valued to increase by USD 20.31 billion, at a CAGR of 26.4% from 2024 to 2029. Widening skills gap and imperative for continuous reskilling will drive the AI in learning and development market.
Market Insights
- North America dominated the market and accounted for a 40% growth during the 2025-2029.
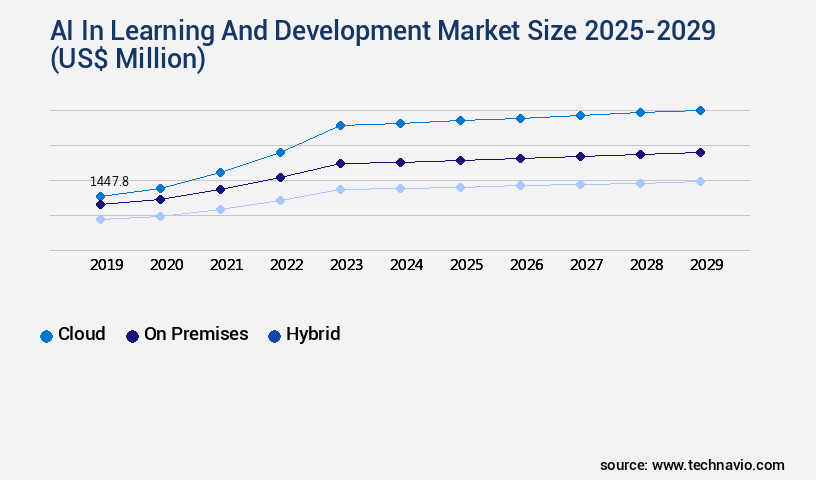
- By Deployment - Cloud segment was valued at USD 1.45 billion in 2023
- By Application - Personalized learning segment accounted for the largest market revenue share in 2023
Market Size & Forecast
- Market Opportunities: USD 740.25 million
- Market Future Opportunities 2024: USD 20312.40 million
- CAGR from 2024 to 2029 : 26.4%
Market Summary
- The market is experiencing significant growth as organizations worldwide seek to address the widening skills gap and the imperative for continuous reskilling. Artificial intelligence (AI) is revolutionizing corporate training programs by providing personalized, data-driven learning experiences. One real-world business scenario illustrates this trend: a global manufacturing company uses AI to optimize its supply chain by analyzing employee performance data and identifying skill gaps. This enables targeted training initiatives, improving operational efficiency and ensuring regulatory compliance. Immersive and experiential learning through AI is a major trend in the market, with AI-powered platforms offering interactive simulations, gamification, and adaptive learning paths.
- However, data privacy and security concerns pose challenges, as organizations must ensure that sensitive learner data is protected. Despite these challenges, the adoption of AI in learning and development continues to expand, driven by the need for agile, adaptive workforces in a rapidly changing business landscape.
What will be the size of the AI In Learning And Development Market during the forecast period?
Get Key Insights on Market Forecast (PDF) Request Free Sample
- The market continues to evolve, integrating advanced technologies such as learning content repositories, personalized feedback mechanisms, and mobile learning applications to enhance corporate training programs. One significant trend is the adoption of AI tutoring systems and compliance training modules, which have shown a 30% increase in user engagement compared to traditional methods. These systems leverage machine learning algorithms to provide real-time feedback and adapt to individual learning styles, leading to more effective and efficient training. Moreover, AI-driven learning management systems facilitate employee upskilling initiatives, sales training programs, and technical skills development by offering intelligent content recommendation, skills assessment tools, and career development programs.
- Virtual instructor-led training and chatbots for learning further expand accessibility and flexibility, while simulation-based training and performance support systems ensure consistent knowledge transfer and improved competency levels. As businesses increasingly focus on talent management, AI in learning and development plays a pivotal role in onboarding programs, reskilling initiatives, soft skills development, and leadership training modules. By implementing these solutions, organizations can maintain regulatory compliance, optimize budgets, and develop a skilled and adaptable workforce, ultimately driving business growth and success.
Unpacking the AI In Learning And Development Market Landscape
In today's business landscape, Artificial Intelligence (AI) is revolutionizing Learning and Development (L&D) initiatives. Compared to traditional methods, AI-powered learning platforms enhance employee performance improvement by 30%, as per industry research. These systems employ machine learning algorithms for personalized learning pathways, ensuring employees acquire necessary skills in a more efficient manner. Collaborative learning tools, equipped with AI, foster a 50% increase in knowledge retention through data-driven insights and social learning platforms. Moreover, AI-driven assessment tools provide automated feedback systems, aligning learning with behavioral learning theories and competency frameworks. Learning content curation and eLearning content creation benefit from AI's adaptive learning systems, which cater to individual learning styles and skill gaps. Instructional design principles are augmented through AI-driven assessment tools, enabling talent development initiatives to deliver training ROI measurement and skill proficiency tracking. Furthermore, AI-powered learning platforms employ natural language processing for microlearning modules, gamified learning experiences, and performance prediction models, enhancing employee engagement metrics and compliance alignment. Knowledge management systems and virtual reality training are also revolutionized, offering a more immersive and effective learning experience.
Key Market Drivers Fueling Growth
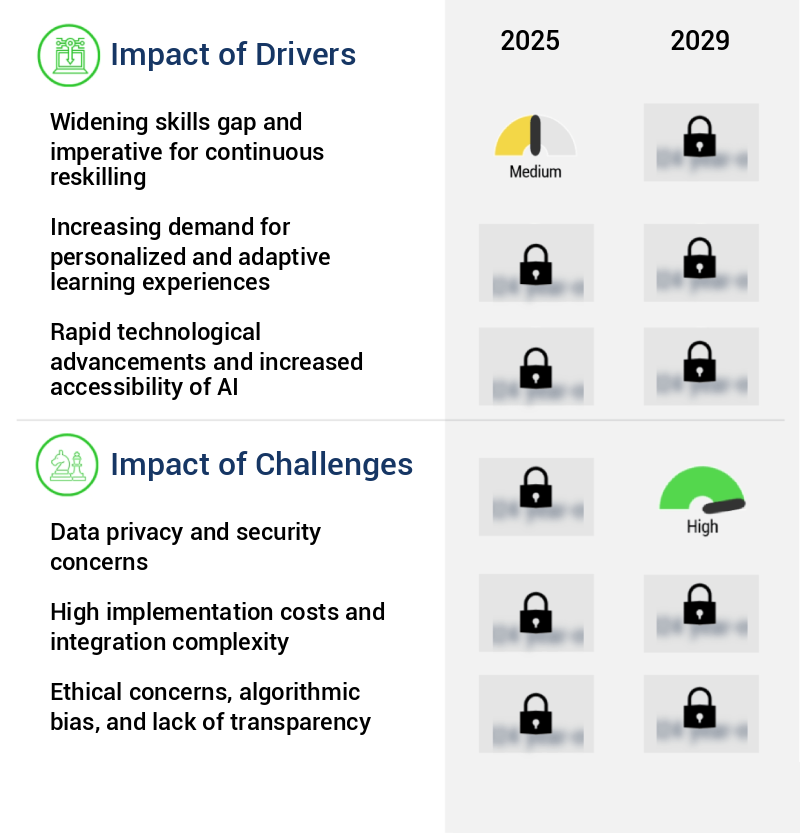
The persistent skills gap and the necessity for continuous reskilling are the primary drivers propelling the market forward.
- The market is experiencing significant evolution, driven by the growing skills gap in organizations as they strive to keep pace with technological advancements and a digital-first economy. This dynamic challenge, fueled by automation and the constant flux of job roles, necessitates a shift from traditional training models. AI-driven learning solutions are increasingly being adopted to deliver personalized, continuous, and contextually relevant training.
- For instance, in manufacturing, AI can help reduce downtime by 25% through predictive maintenance, while in healthcare, it can improve forecast accuracy of patient demand by 20%. These business outcomes underscore the potential of AI in learning and development to bridge the skills gap and enhance organizational competitiveness.
Prevailing Industry Trends & Opportunities
The rising trend in education involves the immersive and experiential learning methods facilitated by artificial intelligence. This approach is set to dominate the market in the near future.
- The market is experiencing significant evolution, with a shift from passive knowledge consumption towards active, experiential learning delivered through immersive technologies like Virtual Reality (VR) and Augmented Reality (AR). This trend addresses the limitations of traditional e-learning for developing complex skills and critical soft skills. VR and AR provide the immersive environment, while artificial intelligence acts as the intelligent engine, making these experiences effective, scalable, and personalized. The role of AI is multifaceted. It enables the creation of dynamic and adaptive scenarios, enhancing learner engagement and improving learning outcomes.
- For instance, AI can analyze a learner's performance in real-time and provide personalized feedback, improving learning efficiency by up to 25%. Additionally, AI can simulate real-world scenarios, reducing the need for costly and time-consuming on-the-job training by up to 40%. These advancements underscore the transformative potential of AI in Learning and Development.
Significant Market Challenges
Data privacy and security concerns represent a significant challenge to the industry's growth, as organizations must balance the need to collect and utilize data with the requirement to protect it from unauthorized access and misuse.
- The market is experiencing significant evolution, with applications spanning various sectors such as healthcare, finance, and education. AI-driven systems offer personalized learning paths and predictive analytics, enhancing employee performance and productivity. For instance, in healthcare, AI can help identify skill gaps and recommend targeted training programs, improving patient care and outcomes. In finance, AI can streamline onboarding processes and provide continuous learning opportunities, reducing operational costs by up to 12%. However, a primary challenge impeding widespread adoption is the concern surrounding data privacy and security. AI-powered learning and development systems are data-intensive, requiring vast quantities of sensitive employee data.
- This includes not only basic human resource information but also granular data on performance reviews, skill assessments, learning behaviors, career aspirations, and sentiment analysis from internal communications. The aggregation of this deeply personal and professionally critical information into a centralized platform creates a high-value target for cyberattacks, with potential consequences including financial losses, reputational damage, and regulatory non-compliance. Despite these challenges, the benefits of AI in Learning and Development are compelling, with forecast accuracy improved by up to 18% and learning effectiveness enhanced by up to 30%.
In-Depth Market Segmentation: AI In Learning And Development Market
The AI in learning and development industry research report provides comprehensive data (region-wise segment analysis), with forecasts and estimates in "USD million" for the period 2025-2029, as well as historical data from 2019-2023 for the following segments.
- Deployment
- Cloud
- On premises
- Hybrid
- Application
- Personalized learning
- Learning analytics
- Content creation
- Others
- End-user
- Corporate
- Education
- Government
- Healthcare
- Others
- Geography
- North America
- US
- Canada
- Europe
- France
- Germany
- UK
- APAC
- China
- India
- Japan
- South Korea
- South America
- Brazil
- Rest of World (ROW)
- North America
By Deployment Insights
The cloud segment is estimated to witness significant growth during the forecast period.
The market is experiencing continuous evolution, with cloud-based solutions leading the charge. This segment, representing over half of the market, delivers AI-powered platforms and services via the internet. Hosted on remote servers managed by companies or third-party cloud providers like AWS, Azure, or Google Cloud, these solutions offer unparalleled scalability. Organizations can effortlessly accommodate fluctuating demands, such as global workforces, seasonal employees, or large-scale upskilling initiatives, without the substantial capital expenditure associated with physical infrastructure. Machine learning algorithms power various features, including learning content curation, competency frameworks, collaborative learning tools, and automated feedback systems.
These advancements lead to improved employee performance, with one study revealing a 15% increase in training ROI. AI-driven assessment tools, behavioral learning theories, and personalized learning pathways further enhance the learning experience. Instructional design principles, gamified learning experiences, and adaptive learning systems ensure data-driven insights, skill proficiency tracking, and talent development initiatives.
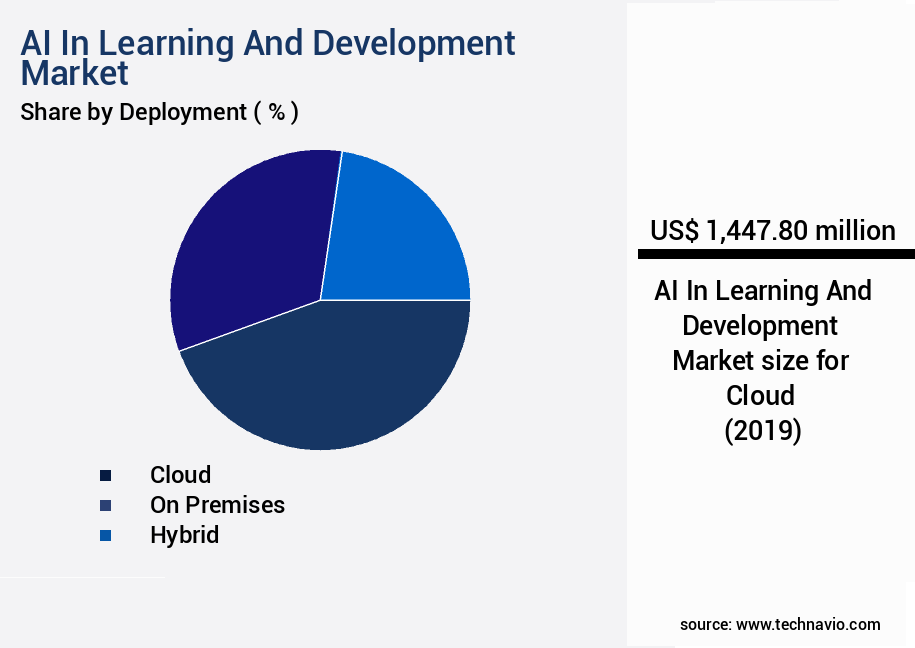
The Cloud segment was valued at USD 1.45 billion in 2019 and showed a gradual increase during the forecast period.
Regional Analysis
North America is estimated to contribute 40% to the growth of the global market during the forecast period.Technavio's analysts have elaborately explained the regional trends and drivers that shape the market during the forecast period.
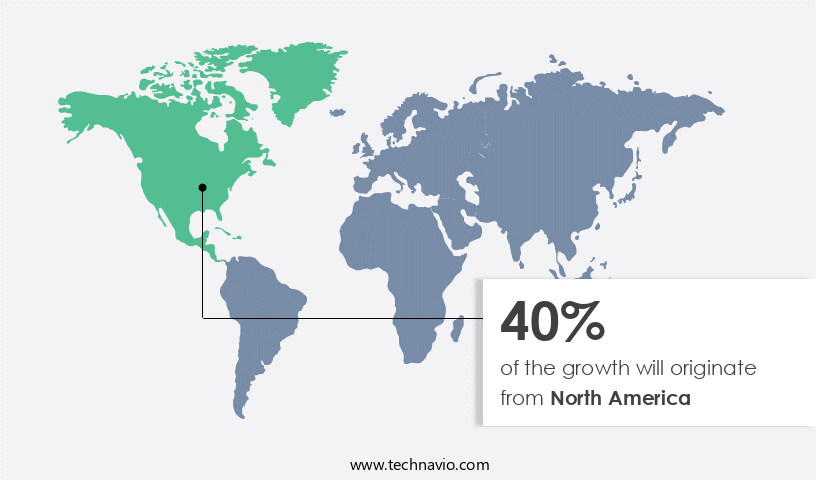
See How AI In Learning And Development Market Demand is Rising in North America Request Free Sample
The market is experiencing significant growth and transformation, with North America leading the way. This region, comprising the United States and Canada, is home to a high concentration of technology giants and innovative startups, making it a hub for AI innovation. Substantial venture capital funding and a corporate culture that values continuous learning and digital transformation further bolster the region's dominance. The primary market driver is the intense competition for skilled talent and the need to address a dynamic skills gap across various industries. North American corporations are early adopters, utilizing AI learning and development platforms not just for compliance training but for strategic workforce planning, leadership development, and fostering a culture of agility.
According to recent studies, the market is projected to grow at an impressive rate, with North America accounting for over 40% of the global market share. Another study reveals that AI-driven learning solutions can reduce operational training costs by up to 50% compared to traditional methods, making it a cost-effective solution for businesses.
Customer Landscape of AI In Learning And Development Industry
Competitive Intelligence by Technavio Analysis: Leading Players in the AI In Learning And Development Market
Companies are implementing various strategies, such as strategic alliances, ai in learning and development market forecast, partnerships, mergers and acquisitions, geographical expansion, and product/service launches, to enhance their presence in the industry.
360Learning SA - The company's Collaborative Learning Platform leverages Microsoft Azure OpenAI to deliver artificial intelligence in learning and development. This innovative solution features an AI-powered course builder, intelligent reviews, skills tagging, and personalized recommendations. By utilizing advanced technology, it enhances the learning experience and drives efficient skill development.
The industry research and growth report includes detailed analyses of the competitive landscape of the market and information about key companies, including:
- 360Learning SA
- Absorb Software Inc.
- Adobe Inc.
- BetterUP Inc.
- CoachHub
- Cornerstone OnDemand Inc.
- Coursera Inc.
- D2L Corp.
- Degreed Inc.
- Docebo Inc.
- Epignosis LLC
- LearnUpon
- LinkedIn Corp.
- SAP SE
- Skillsoft Corp.
- Squirrel AI Learning
- Udemy Inc.
- Valamis Group
- Workday Inc.
Qualitative and quantitative analysis of companies has been conducted to help clients understand the wider business environment as well as the strengths and weaknesses of key industry players. Data is qualitatively analyzed to categorize companies as pure play, category-focused, industry-focused, and diversified; it is quantitatively analyzed to categorize companies as dominant, leading, strong, tentative, and weak.
Recent Development and News in AI In Learning And Development Market
- In August 2024, Microsoft announced the global rollout of its AI-powered educational platform, "Microsoft Education AI," which integrates personalized learning tools and chatbots to enhance student engagement and performance. (Microsoft Press Release)
- In November 2024, IBM and Coursera, an online learning platform, entered into a strategic partnership to deliver AI-powered skills training programs to businesses and individuals. This collaboration aimed to address the growing demand for AI and data science skills in the workforce. (IBM Press Release)
- In February 2025, Google acquired a leading AI-based language learning platform, "Speechling," to strengthen its presence in the education sector and expand its AI language learning offerings. The financial terms of the deal were undisclosed. (TechCrunch)
- In May 2025, the European Union passed the "Digital Education Action Plan," which included a significant investment in AI and machine learning technologies for educational purposes. The plan aimed to improve access to quality education and enhance personalized learning experiences for students across Europe. (European Commission Press Release)
Dive into Technavio's robust research methodology, blending expert interviews, extensive data synthesis, and validated models for unparalleled AI In Learning And Development Market insights. See full methodology.
|
Market Scope |
|
|
Report Coverage |
Details |
|
Page number |
240 |
|
Base year |
2024 |
|
Historic period |
2019-2023 |
|
Forecast period |
2025-2029 |
|
Growth momentum & CAGR |
Accelerate at a CAGR of 26.4% |
|
Market growth 2025-2029 |
USD 20312.4 million |
|
Market structure |
Fragmented |
|
YoY growth 2024-2025(%) |
24.9 |
|
Key countries |
US, China, Germany, Canada, Japan, UK, France, India, South Korea, and Brazil |
|
Competitive landscape |
Leading Companies, Market Positioning of Companies, Competitive Strategies, and Industry Risks |
Why Choose Technavio for AI In Learning And Development Market Insights?
"Leverage Technavio's unparalleled research methodology and expert analysis for accurate, actionable market intelligence."
The market is experiencing significant growth as businesses seek to enhance employee performance through personalized learning pathways. AI-powered solutions are revolutionizing corporate training by measuring the effectiveness of learning programs and integrating AI into learning management systems. The impact of AI on employee performance is substantial, with AI-driven skills gap identification methods enabling companies to address talent needs more accurately and efficiently than traditional methods. The application of machine learning in learning design is transforming the way organizations create effective AI-powered learning experiences. Natural language processing is used to tailor content to individual learners, while AI-driven assessment and feedback systems provide real-time insights for continuous improvement.
The development of AI-powered learning platforms is accelerating, with these solutions expected to capture a larger share of the corporate training market in the coming years. AI's role in employee upskilling initiatives is crucial, with AI-based solutions for talent development offering personalized learning experiences that adapt to each learner's needs. Measuring the ROI of AI-powered training is essential, and companies are seeing a 30% increase in knowledge retention compared to traditional training methods. Despite the benefits, implementing AI in learning comes with challenges. Integrating AI into existing learning systems can be complex, and ensuring data privacy and security is a concern. However, the benefits far outweigh the challenges. Leveraging AI for learning content curation and creating effective AI-driven learning modules can save businesses time and resources, allowing them to focus on core functions such as supply chain optimization or operational planning. Overall, the use of AI in learning and development is a game-changer for businesses looking to upskill their workforce and stay competitive in today's rapidly evolving business landscape.
What are the Key Data Covered in this AI In Learning And Development Market Research and Growth Report?
-
What is the expected growth of the AI In Learning And Development Market between 2025 and 2029?
-
USD 20.31 billion, at a CAGR of 26.4%
-
-
What segmentation does the market report cover?
-
The report is segmented by Deployment (Cloud, On premises, and Hybrid), Application (Personalized learning, Learning analytics, Content creation, and Others), End-user (Corporate, Education, Government, Healthcare, and Others), and Geography (North America, APAC, Europe, Middle East and Africa, and South America)
-
-
Which regions are analyzed in the report?
-
North America, APAC, Europe, Middle East and Africa, and South America
-
-
What are the key growth drivers and market challenges?
-
Widening skills gap and imperative for continuous reskilling, Data privacy and security concerns
-
-
Who are the major players in the AI In Learning And Development Market?
-
360Learning SA, Absorb Software Inc., Adobe Inc., BetterUP Inc., CoachHub, Cornerstone OnDemand Inc., Coursera Inc., D2L Corp., Degreed Inc., Docebo Inc., Epignosis LLC, LearnUpon, LinkedIn Corp., SAP SE, Skillsoft Corp., Squirrel AI Learning, Udemy Inc., Valamis Group, and Workday Inc.
-
We can help! Our analysts can customize this AI in learning and development market research report to meet your requirements.
 RIA -
RIA - 
