
Learning Management System (LMS) Market Size 2025-2029
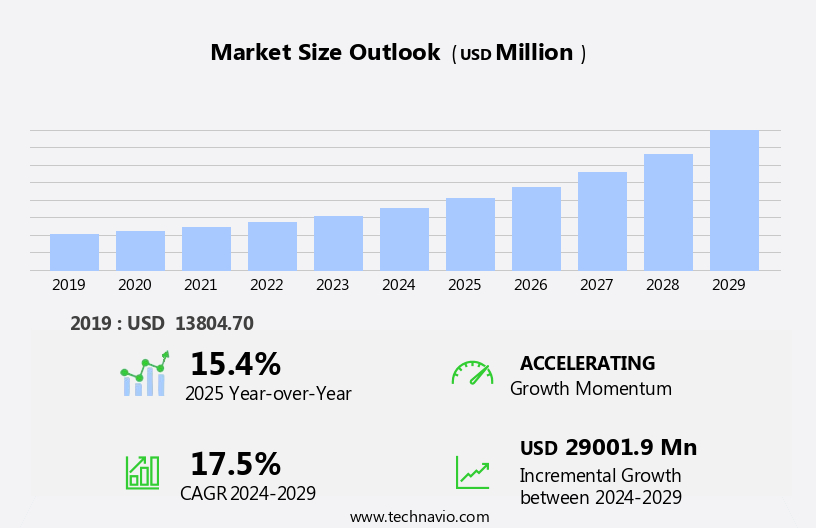
The learning management system (LMS) market size is forecast to increase by USD 29 billion, at a CAGR of 17.5% between 2024 and 2029.
- The market is witnessing significant growth, driven by the increasing adoption of Next-Generation Digital Learning Environments (NGDLE) in the academic sector. This shift towards more interactive and personalized learning experiences is transforming the education landscape and fueling the demand for advanced LMS solutions. E-learning platforms and gamification platforms offer engaging experiences, while performance support tools enhance productivity. Furthermore, the popularity of cloud-based LMS continues to rise, enabling easier access to learning materials and resources from anywhere, at any time. However, the market also faces challenges, primarily interoperability issues.
- To capitalize on market opportunities and navigate these challenges effectively, companies must focus on developing interoperable solutions and collaborating with key stakeholders to create a more unified and integrated digital learning ecosystem. With the proliferation of various LMS platforms and content formats, ensuring seamless integration and data exchange between systems remains a significant hurdle. Competency management, learning analytics, and attendance tracking ensure effective talent development and personalized learning experiences.
What will be the Size of the Learning Management System (LMS) Market during the forecast period?
Explore in-depth regional segment analysis with market size data - historical 2019-2023 and forecasts 2025-2029 - in the full report.
Request Free Sample
The market continues to evolve, with dynamic market activities shaping its applications across various sectors. K-12 education and higher education institutions are leveraging LMSs to deliver blended learning experiences, integrating interactive exercises, assessment tools, and learning objects into their curriculum design. In the corporate realm, employee training programs utilize LMSs for progress tracking, mobile learning, and API integrations to streamline operations. Cloud-based LMSs are increasingly popular due to their flexibility and scalability, enabling knowledge management and learning paths for diverse learners. Course authoring tools and content management systems facilitate the creation and delivery of e-learning content.
Open source LMSs provide cost-effective solutions, while single sign-on (SSO) and communication tools foster collaboration and social learning. Multimedia content and content aggregation cater to diverse learning styles, while user interface (UI) and content reusability enhance user experience (UX). Market trends include the integration of adaptive learning and compliance training, as well as the development of training content and instructional design to meet evolving industry demands. The ongoing unfolding of these patterns underscores the continuous evolution of the LMS market.
How is this Learning Management System (LMS) Industry segmented?
The learning management system (LMS) industry research report provides comprehensive data (region-wise segment analysis), with forecasts and estimates in "USD million" for the period 2025-2029, as well as historical data from 2019-2023 for the following segments.
- End-user
- Academic
- Corporate
- Deployment
- Cloud-based
- On-premises
- Component
- Solutions
- Services
- Geography
- North America
- US
- Canada
- Europe
- France
- Germany
- Italy
- Spain
- UK
- APAC
- China
- India
- Japan
- Rest of World (ROW)
- North America
By End-user Insights
The academic segment is estimated to witness significant growth during the forecast period. The market is experiencing significant growth due to the increasing adoption of online learning in various sectors. In corporate training, LMS solutions enable efficient curriculum design, progress tracking, and interactive exercises. On-premise LMS and cloud-based LMS cater to different organizational needs, while partner training and single sign-on (SSO) enhance collaboration and convenience. Knowledge management, learning paths, and content management are essential features for effective training programs. Gamification platforms, performance support, and course authoring tools facilitate engaging and personalized learning experiences. Open source LMS offers cost-effective solutions, while compliance training ensures regulatory adherence. In the education sector, higher education and K-12 institutions dominate the market.
Universities are investing in e-learning content, instructional design, and talent development to expand their online offerings. Blended learning and adaptive learning cater to diverse learning styles and paces. Mobile learning is gaining popularity, necessitating LMS solutions compatible with various mobile devices. However, challenges include ensuring accessibility and compatibility across different architectures and operating systems. Collaboration tools, reporting & analytics, and feedback mechanisms further enhance the learning experience. Employee training, customer training, and channel training are other applications of LMS. Learning analytics and content aggregation provide valuable insights for continuous improvement. User experience (UX) and multimedia content contribute to engaging and effective learning environments.
The LMS market is driven by the evolving needs of corporate training, education, and various industries. Its ability to deliver personalized, interactive, and effective learning experiences makes it an indispensable tool for talent development and knowledge dissemination. The market is experiencing significant growth, driven by the increasing adoption of Next-Generation Digital Learning Environments (NGDLE) in the academic sector.
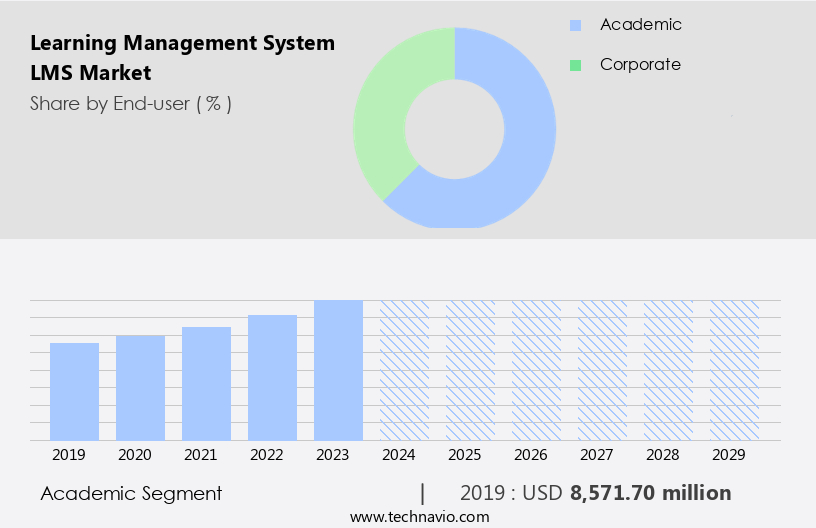
The Academic segment was valued at USD 8.57 billion in 2019 and showed a gradual increase during the forecast period.
The Learning Management System (LMS) Market is rapidly expanding as education and corporate sectors embrace digital training solutions. Platforms offering virtual classroom capabilities are transforming remote learning with real-time interaction. The rise of AI-powered learning enables personalized content delivery and adaptive assessments, enhancing learner outcomes. Organizations are leveraging training needs analysis to tailor programs effectively. Strong learning communities foster collaboration and peer support, enriching the learning experience. High-quality customer service remains vital for ongoing user satisfaction. The market spans from scalable enterprise LMS platforms to agile small business LMS solutions. Careful vendor selection ensures alignment with organizational goals, while integrated knowledge base systems support on-demand learning.
Regional Analysis
North America is estimated to contribute 33% to the growth of the global market during the forecast period. Technavio's analysts have elaborately explained the regional trends and drivers that shape the market during the forecast period.
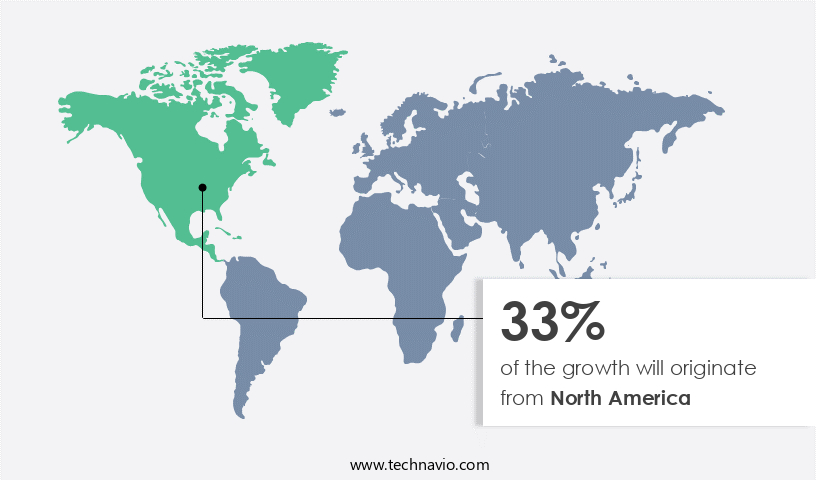
The North American market is experiencing steady growth, driven by the increasing demand from corporate organizations. Centralized learning through LMS has become essential for Small and Medium-sized Businesses (SMBs) in the region, particularly those in the US, Canada, and Mexico. The need for effective and quality education in developed economies further fuels the market's expansion. Modern technologies, such as cloud-based LMS, mobile learning, interactive exercises, and gamification platforms, are increasingly popular, enabling educators to deliver and access content from anywhere. LMS solutions facilitate personalized learning, content reusability, and user experience (UX) enhancements. Additionally, the integration of features like single sign-on (SSO), collaboration tools, and reporting & analytics caters to the evolving needs of corporate training, partner training, and customer training.
The LMS market in North America also supports the adoption of blended learning, compliance training, and talent development through adaptive learning, learning paths, and content aggregation. Corporate training benefits from single sign-on (SSO), learning analytics, and authoring tools. Higher education and K-12 institutions are investing in LMS to provide students with a unique learning experience and enable instructors to deliver multimedia content effectively. The market's growth is further boosted by the integration of APIs, learning analytics, and assessment tools to improve learning outcomes and enhance the overall learning experience.
Market Dynamics
Our researchers analyzed the data with 2024 as the base year, along with the key drivers, trends, and challenges. A holistic analysis of drivers will help companies refine their marketing strategies to gain a competitive advantage.
What are the key market drivers leading to the rise in the adoption of Learning Management System (LMS) Industry?
- The adoption of Next-Generation Digital Learning Environments (NGDLE) in the academic sector is a significant market trend, driving innovation and growth within education technology. The market is experiencing significant growth due to the adoption of cost-effective learning and development programs by educational institutions and corporate organizations. Next-generation digital learning environments (NGDLEs), which include LMS as a component, are becoming increasingly popular. NGDLEs facilitate the development of efficient learning programs, leading to improved task execution and enhanced employee retention.
- Corporate organizations also benefit from LMS by streamlining training processes, ensuring content consistency, and tracking employee progress. Open source LMS solutions offer additional cost savings and flexibility for customization. With a user-friendly interface (UI) and focus on channel training, LMS continues to be a valuable investment for organizations seeking to enhance their learning and development initiatives. In the education sector, LMS is transforming traditional teaching methods by promoting active learning, personalization, and hybrid course designs. Furthermore, LMS offers course authoring tools, content management, single sign-on (SSO), communication tools, and content reusability, making it an indispensable tool for e-learning content delivery.
What are the market trends shaping the Learning Management System (LMS) Industry?
- The rising preference for cloud-based Learning Management Systems (LMS) represents a significant market trend. This shift towards cloud-based solutions is driven by their flexibility, cost-effectiveness, and ease of use. The market has witnessed significant growth due to the increasing adoption of cloud-based solutions. Traditional LMS providers are transitioning to cloud-based systems, which are generally hosted on the LMS provider's servers, eliminating the need for on-premises The market is experiencing significant growth due to the increasing adoption of online learning in various sectors, particularly in k-12 education and higher education.
- These systems offer assessment tools, learning objects, reporting & analytics, feedback mechanisms, course management, and collaboration tools to facilitate effective learning. In the corporate sector, employee training programs are leveraging LMS to streamline processes, set learning objectives, and track progress. API integrations enable seamless data exchange between various applications, enhancing the functionality of LMS. Regardless of the sector, LMS continues to be a valuable tool for achieving learning objectives and improving overall performance. Cloud-based LMS offers several advantages, including low initial costs as it is subscription-based, and minimal implementation costs since there is no need for installation of programs or devotion of time and human resources. Furthermore, cloud-based e-learning is quicker to set up and deploy compared to traditional LMS. In education, both K-12 and higher education sectors are embracing LMS for blended learning environments.
What challenges does the Learning Management System (LMS) Industry face during its growth?
- Interoperability issues represent a significant challenge to the industry's growth, limiting the seamless exchange and integration of data and processes between different systems and organizations. The integration of Learning Management Systems (LMS) into customer training programs has become a crucial aspect of talent development. However, the lack of standardization in eLearning content can pose challenges during LMS integration. Although LMS enables integration, it is not always a seamless process due to the disparity between eLearning standards and LMS capabilities.
- Multimedia content, content aggregation, and user experience (UX) are also crucial elements that contribute to the success of an LMS. Compliance training is another area where LMS plays a significant role in ensuring regulatory adherence. Despite these benefits, the interoperability issues arising from the lack of standardization can hinder the full potential of LMS in customer training. For instance, schools or organizations may find it challenging to use a course developed by one company with an LMS from a different provider. The difference in content structure and supported features can hinder the reusability of such courses. Adaptive learning, attendance tracking, learning analytics, training content development, instructional design, and personalized learning are essential features of an effective LMS.
Exclusive Customer Landscape
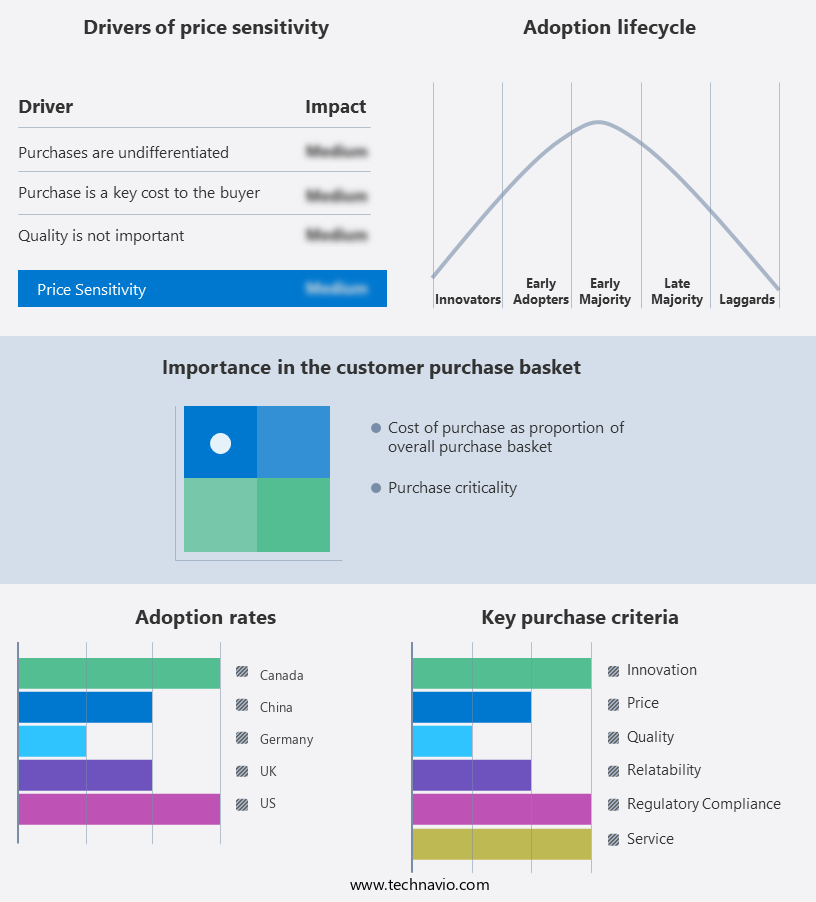
The learning management system (LMS) market forecasting report includes the adoption lifecycle of the market, covering from the innovator's stage to the laggard's stage. It focuses on adoption rates in different regions based on penetration. Furthermore, the learning management system (LMS) market report also includes key purchase criteria and drivers of price sensitivity to help companies evaluate and develop their market growth analysis strategies.
Customer Landscape
Key Companies & Market Insights
Companies are implementing various strategies, such as strategic alliances, learning management system (LMS) market forecast, partnerships, mergers and acquisitions, geographical expansion, and product/service launches, to enhance their presence in the industry.
360Learning SA - The company specializes in Learning Management Systems (LMS), delivering innovative, cloud-based platforms specifically tailored for corporate training and higher education institutions.
The industry research and growth report includes detailed analyses of the competitive landscape of the market and information about key companies, including:
- 360Learning SA
- Absorb Software Inc.
- Adrenalin eSystems Ltd.
- Anthology Inc.
- Cornerstone OnDemand Inc.
- Cross Knowledge
- D2L Corp.
- Degreed Inc.
- Docebo Inc.
- Epignosis LLC
- Instructure Holdings Inc.
- Oracle Corp.
- PowerSchool Holdings Inc.
- SAP SE
- Skillsoft Corp.
- Sprout On Web Pty. Ltd.
- Tovuti Inc.
- Violet InfoSystems Pvt. Ltd.
- Workday Inc.
- Xperiencify
Qualitative and quantitative analysis of companies has been conducted to help clients understand the wider business environment as well as the strengths and weaknesses of key industry players. Data is qualitatively analyzed to categorize companies as pure play, category-focused, industry-focused, and diversified; it is quantitatively analyzed to categorize companies as dominant, leading, strong, tentative, and weak.
Recent Development and News in Learning Management System (LMS) Market
- In January 2024, Coursera, a leading online learning platform, announced the launch of a new LMS solution for businesses, Coursera for Teams, designed to help organizations upskill their workforce (Coursera Press Release, 2024). This new offering includes features such as customized learning paths, progress tracking, and integration with HR systems.
- In March 2024, Blackboard, a prominent LMS provider, entered into a strategic partnership with Microsoft to integrate Microsoft Teams and Blackboard Learn Ultra, allowing for seamless communication and collaboration between educators and students (Blackboard Press Release, 2024).
- In May 2024, Moodle, an open-source LMS, raised USD30 million in a funding round led by New Venture Partners, to accelerate product development and expand its market presence (Moodle Press Release, 2024).
- In February 2025, Google announced the acquisition of JetBrains' Upsource and TeamCity, two popular developer tools, which are expected to enhance Google Classroom and Google Workspace's educational offerings, further solidifying their position in the LMS market (Google Press Release, 2025).
Research Analyst Overview
The market is witnessing significant trends and dynamics, with a focus on enhancing training effectiveness and knowledge retention. Company selection is a critical process for businesses, considering the importance of implementation services and user adoption rate. Subscription plans cater to various business sizes, from small businesses to enterprises, offering flexibility in pricing models. Compliance regulations drive the need for robust data security and accessibility standards. Live online training and mobile-first learning are gaining traction, enabling instructor-led training and self-paced learning in a flexible format. Knowledge sharing and collaboration platforms foster a learning community, while blended learning models combine the benefits of both instructor-led and self-paced training.
Training & support and customer success are essential components of an LMS, ensuring a positive user experience. Pricing models vary, with some offering a freemium model for basic features and premium plans for advanced functionality. Content updates and personalized learning paths, powered by AI, enhance the learning experience. Data analytics dashboards provide valuable insights into learning outcomes and user behavior, enabling informed decisions. Technical support and community forums offer assistance and knowledge exchange opportunities. Asynchronous learning and branding options cater to diverse learning styles and business needs. Blended learning, assignment management, and content creation tools are becoming increasingly popular, allowing for a more interactive and engaging learning experience.
Dive into Technavio's robust research methodology, blending expert interviews, extensive data synthesis, and validated models for unparalleled Learning Management System (LMS) Market insights. See full methodology.
|
Market Scope |
|
|
Report Coverage |
Details |
|
Page number |
210 |
|
Base year |
2024 |
|
Historic period |
2019-2023 |
|
Forecast period |
2025-2029 |
|
Growth momentum & CAGR |
Accelerate at a CAGR of 17.5% |
|
Market growth 2025-2029 |
USD 29 billion |
|
Market structure |
Fragmented |
|
YoY growth 2024-2025(%) |
15.4 |
|
Key countries |
US, Germany, UK, France, China, Canada, Italy, Spain, India, and Japan |
|
Competitive landscape |
Leading Companies, Market Positioning of Companies, Competitive Strategies, and Industry Risks |
What are the Key Data Covered in this Learning Management System (LMS) Market Research and Growth Report?
- CAGR of the Learning Management System (LMS) industry during the forecast period
- Detailed information on factors that will drive the growth and forecasting between 2025 and 2029
- Precise estimation of the size of the market and its contribution of the industry in focus to the parent market
- Accurate predictions about upcoming growth and trends and changes in consumer behaviour
- Growth of the market across North America, Europe, APAC, South America, and Middle East and Africa
- Thorough analysis of the market's competitive landscape and detailed information about companies
- Comprehensive analysis of factors that will challenge the learning management system (lms) market growth of industry companies
We can help! Our analysts can customize this learning management system (lms) market research report to meet your requirements.
 RIA -
RIA - 
