AI In Luxury Brands Market Analysis, Size, and Forecast 2025-2029: North America (US and Canada), Europe (UK, Germany, and France), APAC (China, Japan, and South Korea), South America (Brazil and Argentina), Middle East and Africa (Saudi Arabia and UAE), and Rest of World (ROW)

AI In Luxury Brands Market Analysis, Size, and Forecast 2025-2029:
North America (US and Canada), Europe (UK, Germany, and France), APAC (China, Japan, and South Korea), South America (Brazil and Argentina), Middle East and Africa (Saudi Arabia and UAE), and Rest of World (ROW)

Published: Dec 2025 297 Pages SKU: IRTNTR80999

Market Overview at a Glance

$1.60 B
Market Opportunity
19.1%
CAGR 2024 - 2029
32.2%
North America Growth
$465.6 Mn
Machine learning segment 2023

AI In Luxury Brands Market Size 2025-2029

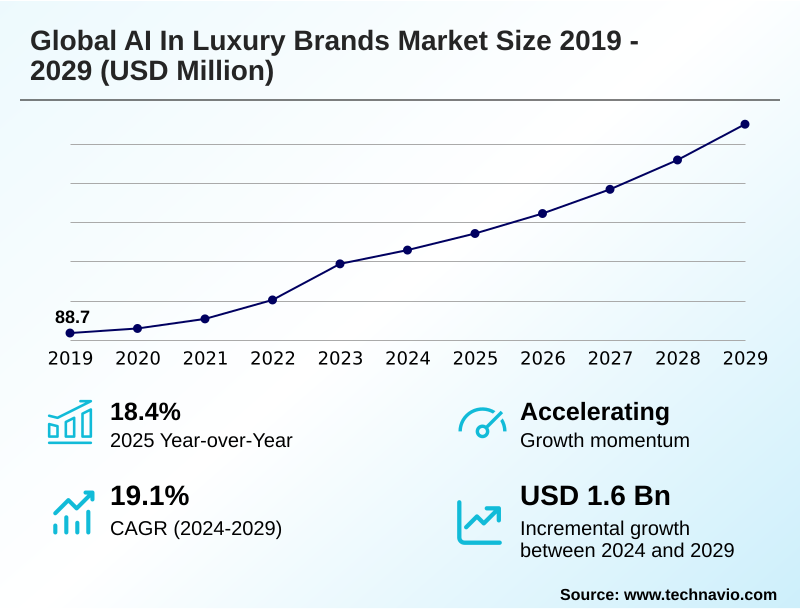
The ai in luxury brands market size is valued to increase by USD 1.60 billion, at a CAGR of 19.1% from 2024 to 2029. Enhanced personalization and customer experience will drive the ai in luxury brands market.

Major Market Trends & Insights

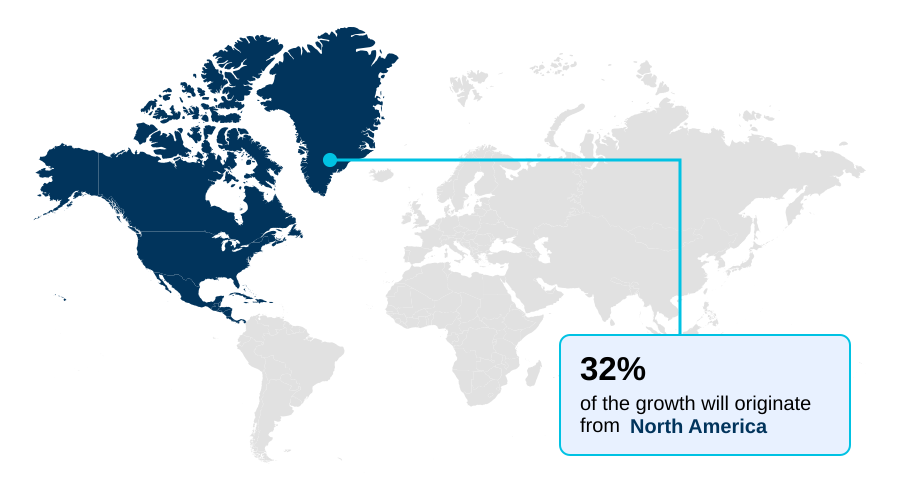
  • North America dominated the market and accounted for a 32.2% growth during the forecast period.
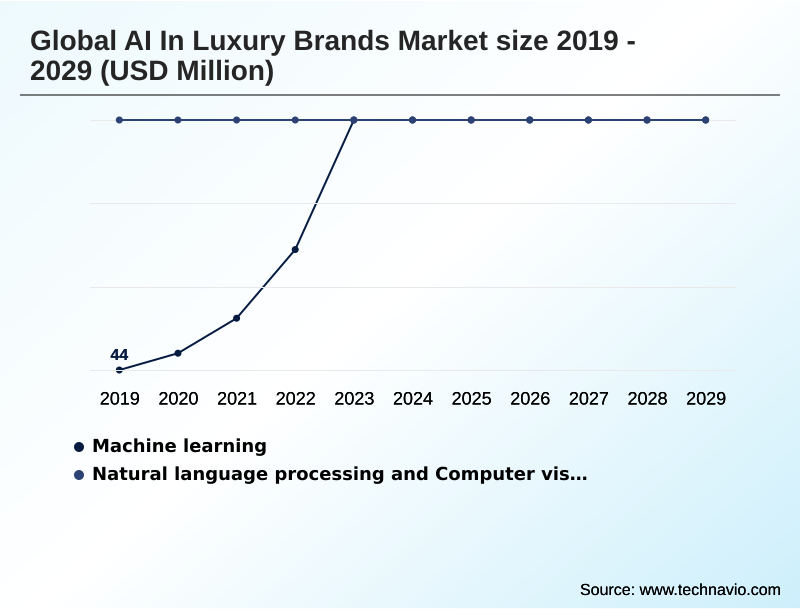
  • By Technology - Machine learning segment was valued at USD 465.6 million in 2023
  • By Application - Trend forecasting segment accounted for the largest market revenue share in 2023

Market Size & Forecast

  • Market Opportunities: USD 2.66 billion
  • Market Future Opportunities: USD 1.60 billion
  • CAGR from 2024 to 2029 : 19.1%

Market Summary

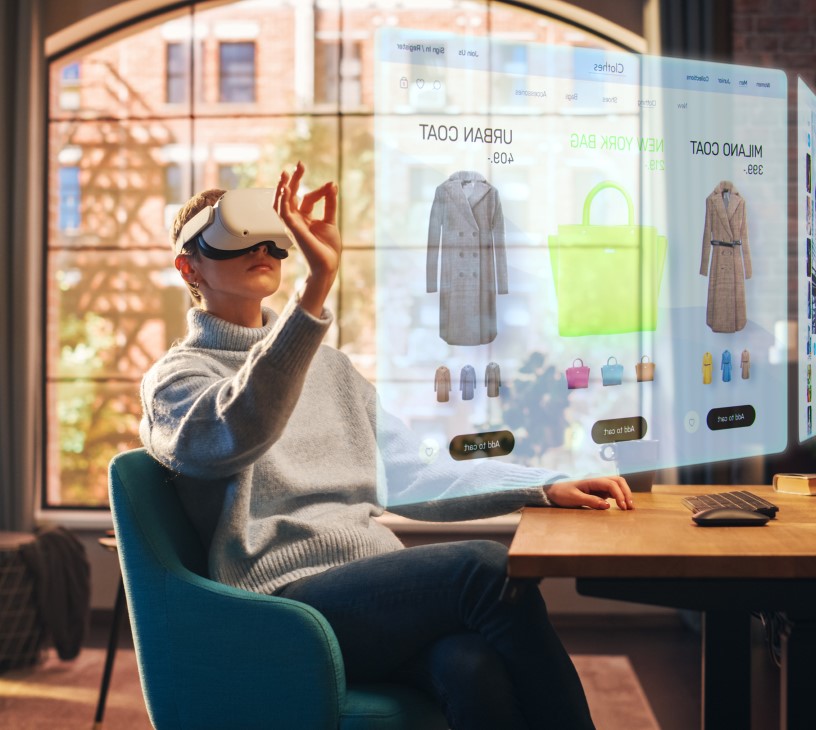
  • The AI in luxury brands market is undergoing a significant strategic expansion, moving beyond exploratory phases into deep operational integration. This evolution is driven by the necessity for hyper-personalization, a key expectation of the modern luxury consumer. By leveraging technologies to analyze vast datasets, brands now deliver bespoke recommendations and curated content with unprecedented accuracy.
  • A key application is in optimizing the supply chain, where machine learning models enable more accurate demand forecasting. For instance, by analyzing trends from social media and sales data, firms can mitigate the risks of overproduction and excess inventory, a crucial step toward greater sustainability.
  • This data-driven approach allows for more agile and responsive production cycles, ensuring products are available where and when they are most desired. However, this technological shift presents a challenge in maintaining the human touch and exclusivity that define luxury, requiring a strategic balance to ensure AI enhances, rather than supplants, the core brand identity.

What will be the Size of the AI In Luxury Brands Market during the forecast period?

Get Key Insights on Market Forecast (PDF) Request Free Sample

How is the AI In Luxury Brands Market Segmented?

The ai in luxury brands industry research report provides comprehensive data (region-wise segment analysis), with forecasts and estimates in "USD million" for the period 2025-2029, as well as historical data from 2019-2023 for the following segments.

  • Technology
    • Machine learning
    • Natural language processing
    • Computer vision
  • Application
    • Trend forecasting
    • Customer service chatbots
    • Virtual try-on and fitting rooms
    • Personalization and recommendation engines
    • Others
  • End-user
    • Apparel
    • Footwear
    • Accessories
    • Cosmetics
    • Jewelry
  • Geography
    • North America
      • US
      • Canada
    • Europe
      • UK
      • Germany
      • France
    • APAC
      • China
      • Japan
      • South Korea
    • South America
      • Brazil
      • Argentina
    • Middle East and Africa
      • Saudi Arabia
      • UAE
    • Rest of World (ROW)

By Technology Insights

The machine learning segment is estimated to witness significant growth during the forecast period.

The machine learning sub-segment is foundational to the AI in luxury brands market, fundamentally reshaping personalization and operational strategy. Machine learning algorithms are integral to hyper-personalization engines, enabling brands to move beyond generic interactions.

By using predictive analytics, firms can now deliver uniquely tailored digital content and AI-powered product recommendations, which significantly enhance the bespoke customer journey.

A recent survey revealed that 73% of fashion executives are prioritizing generative AI models, a subset of machine learning, for their business strategies.

This focus is driven by the demand for seamless, individualized digital experiences and the need for more efficient AI-based inventory management.

The technology also underpins AI-driven trend prediction, allowing for more agile and responsive product development cycles through smart store analytics and real-time data analysis.

Request Free Sample

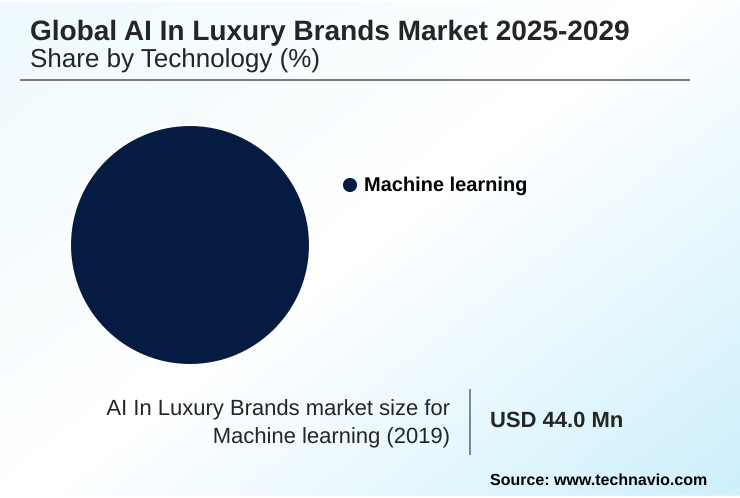
The Machine learning segment was valued at USD 465.6 million in 2023 and showed a gradual increase during the forecast period.

Request Free Sample

Regional Analysis

North America is estimated to contribute 32.2% to the growth of the global market during the forecast period.Technavio’s analysts have elaborately explained the regional trends and drivers that shape the market during the forecast period.

See How AI In Luxury Brands Market Demand is Rising in North America Request Free Sample

The geographic landscape for AI in luxury brands is led by North America, which accounts for approximately 32.2% of the market's incremental growth, driven by a tech-savvy consumer base and early adoption.

This is closely followed by the APAC region, contributing around 29.4% to growth, with markets like China and South Korea demonstrating rapid innovation in AI-powered retail.

The strategic importance of this technology is underscored by a 79% increase in AI spending by luxury brands in recent years.

This investment is directed toward AI-powered authentication and computer vision technology to enhance both the customer experience and operational efficiency.

Deployments of a virtual styling suite and AI-assisted design ideation are becoming more common as brands globally compete to offer the most advanced and personalized services through their digital and physical channels.

Market Dynamics

Our researchers analyzed the data with 2024 as the base year, along with the key drivers, trends, and challenges. A holistic analysis of drivers will help companies refine their marketing strategies to gain a competitive advantage.

  • The successful deployment of AI in the luxury sector requires a nuanced understanding of how AI-driven personalization versus human touch impacts consumer perception. While machine learning for hyper-personalized recommendations is becoming a standard for enhancing online engagement, the core challenge remains the impact of AI on brand exclusivity.
  • Strategically, firms are leveraging AI for predictive trend forecasting in fashion to align collections with emerging consumer desires, thereby minimizing financial risk. Simultaneously, the role of AI in luxury brand storytelling is expanding, with narrative-driven platforms creating deeper emotional connections. Behind the scenes, the ROI of AI implementation in luxury retail is most evident in operational advancements.
  • This includes using AI to optimize luxury inventory levels and developing AI-powered tools for sustainable luxury sourcing. The technical hurdle of AI integration with legacy ERP systems is significant, yet overcoming it is crucial for creating resilient supply chains. Platforms now demonstrate over 99% accuracy in counterfeit detection, a substantial improvement that protects brand integrity.
  • Furthermore, leveraging AI for phygital luxury experiences is proving essential for creating a cohesive omnichannel journey, where virtual try-on accuracy in luxury apparel directly influences purchasing decisions and reduces returns, blending digital convenience with the assurance of a perfect fit.

What are the key market drivers leading to the rise in the adoption of AI In Luxury Brands Industry?

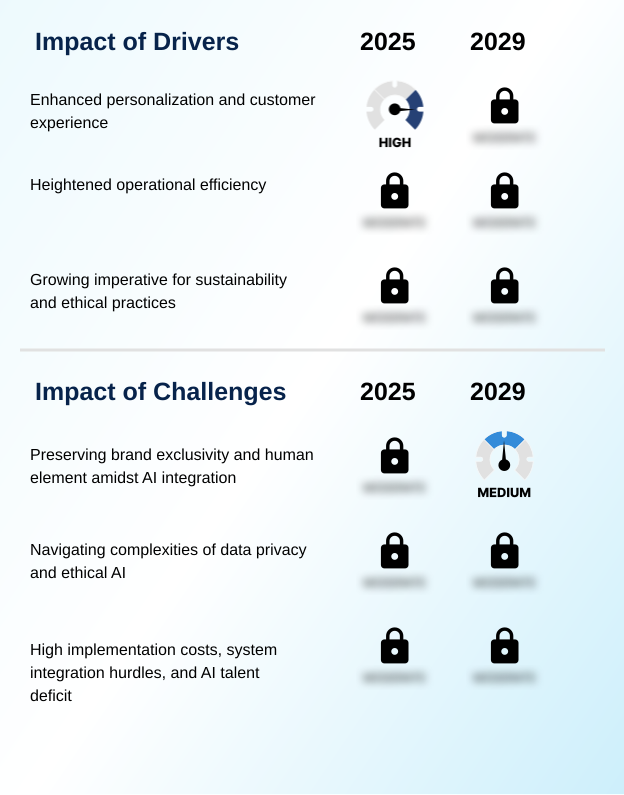
  • The drive to provide enhanced personalization and a superior customer experience is a primary factor propelling market growth.

  • Market growth is primarily fueled by the pursuit of enhanced personalization and heightened operational efficiency.
  • The adoption of AI is driven by its ability to create a seamless connected visitor experience, with investment in AI technologies increasing by 79% over the past three years.
  • This commitment is validated by consumer behavior, as nearly half of luxury shoppers indicate a willingness to spend more for AI-powered customization.
  • Technologies such as AI skin analysis and AI-based inventory management enable brands to deliver tailored recommendations and optimize stock levels effectively.
  • The push for operational excellence also involves leveraging AI-driven demand forecasting and robotic process automation (RPA) to streamline complex global supply chains, reduce waste, and improve profitability, making AI an indispensable tool for modern luxury operations.

What are the market trends shaping the AI In Luxury Brands Industry?

  • The imperative for hyper-personalization is becoming a defining market trend. This is driving brands to deliver elevated and highly individualized customer experiences across all touchpoints.

  • Key trends in the market are centered on elevating the customer journey and fortifying brand integrity through advanced technology. The imperative for a hyper-personalized bespoke customer journey is driving the adoption of AI-powered chatbots and virtual personal shopper tools, which are now capable of nuanced, brand-aligned interactions.
  • In parallel, sustainable manufacturing optimization and AI-enhanced quality control are gaining traction, supported by technologies that improve supply chain transparency. A critical development is the use of computer vision for counterfeit authentication; AI-driven platforms report over 99% accuracy in identifying fakes by scrutinizing microscopic details.
  • This trend is reinforced as proactive AI controls now block the vast majority of fraudulent listings before they are even seen, demonstrating a powerful defense of brand value. The use of a virtual makeup artist is also a growing trend in the beauty sector.

What challenges does the AI In Luxury Brands Industry face during its growth?

  • A key challenge affecting industry growth is the need to preserve brand exclusivity and the human element while strategically integrating AI technologies.

  • A paramount challenge facing the market is balancing technological integration with brand exclusivity, alongside the complexities of ethical AI governance and the high cost of implementation. The scarcity of specialized talent and difficulties in merging AI platforms with legacy systems create significant operational hurdles.
  • Successfully navigating data privacy regulations is critical for maintaining consumer trust, necessitating the use of federated learning techniques and robust data security. Overcoming these obstacles is essential for increasing technology adoption, with some leading markets aiming to boost AI utilization rates from under 3% to over 30% in the retail sector.
  • Strategic partnerships with tech startups are emerging as a key strategy to mitigate high initial investment costs and access specialized expertise in areas like AI-powered size recommendation and conversational commerce platforms.

Exclusive Technavio Analysis on Customer Landscape

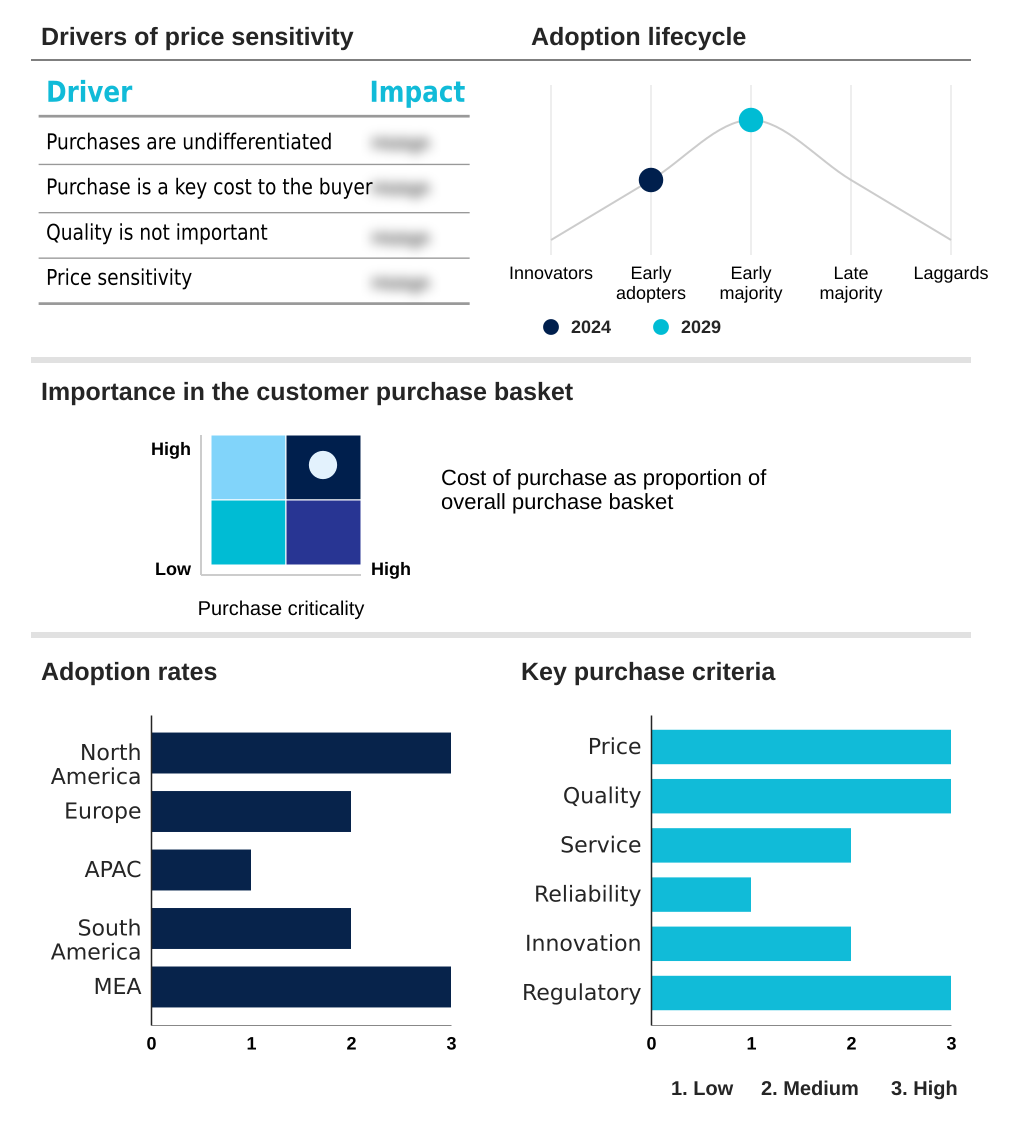
The ai in luxury brands market forecasting report includes the adoption lifecycle of the market, covering from the innovator’s stage to the laggard’s stage. It focuses on adoption rates in different regions based on penetration. Furthermore, the ai in luxury brands market report also includes key purchase criteria and drivers of price sensitivity to help companies evaluate and develop their market growth analysis strategies.

Customer Landscape of AI In Luxury Brands Industry

Competitive Landscape

Companies are implementing various strategies, such as strategic alliances, ai in luxury brands market forecast, partnerships, mergers and acquisitions, geographical expansion, and product/service launches, to enhance their presence in the industry.

Balenciaga SA - Offerings include AI-generated digital experiences and predictive trend forecasting, designed to redefine consumer engagement and optimize product strategy in the luxury sector.

The industry research and growth report includes detailed analyses of the competitive landscape of the market and information about key companies, including:

  • Balenciaga SA
  • Burberry Group Plc
  • Cartier SA
  • Chanel Ltd.
  • Christian Dior SE
  • Compagnie Financiere Richemont SA
  • Google LLC
  • Guccio Gucci SpA
  • IBM Corp.
  • Kering SA
  • LVMH Moet Hennessy
  • Microsoft Corp.
  • Moncler S.P.A.
  • Oracle Corp.
  • Perfect Corp.
  • Revieve Inc.
  • The Estee Lauder Companies
  • The LVMH group

Qualitative and quantitative analysis of companies has been conducted to help clients understand the wider business environment as well as the strengths and weaknesses of key industry players. Data is qualitatively analyzed to categorize companies as pure play, category-focused, industry-focused, and diversified; it is quantitatively analyzed to categorize companies as dominant, leading, strong, tentative, and weak.

Recent Development and News in Ai in luxury brands market

  • In December, 2024, Centric Software launched an AI-powered tool for fashion inspiration, demonstrating continuous innovation in the tech ecosystem that supports the luxury sector.
  • In January, 2025, Hugo Boss integrated AI-generated product content, including a video, across its global e-commerce platforms as part of its digital strategy to enhance product storytelling.
  • In February, 2025, Red Sea Global announced a partnership with Globant to create a Connected Visitor Experience at The Red Sea destination, utilizing AI and IoT for hyper-personalized services.
  • In March, 2025, Amorepacific revealed it is building an AI Beauty Counselor app using Microsoft Azure AI to provide personalized advice and an online skin diagnosis tool for consumers.

Dive into Technavio’s robust research methodology, blending expert interviews, extensive data synthesis, and validated models for unparalleled AI In Luxury Brands Market insights. See full methodology.

Market Scope
Page number 297
Base year 2024
Historic period 2019-2023
Forecast period 2025-2029
Growth momentum & CAGR Accelerate at a CAGR of 19.1%
Market growth 2025-2029 USD 1601.8 million
Market structure Fragmented
YoY growth 2024-2025(%) 18.4%
Key countries US, Canada, UK, Germany, France, Italy, China, Japan, South Korea, India, Brazil, Argentina, Saudi Arabia and UAE
Competitive landscape Leading Companies, Market Positioning of Companies, Competitive Strategies, and Industry Risks

Request Free Sample

Research Analyst Overview

  • The AI in luxury brands market is defined by its strategic integration into core business functions, moving from peripheral applications to central operational roles. The deployment of natural language processing and computer vision technology is becoming standard for creating differentiated customer experiences.
  • Firms are leveraging machine learning algorithms and predictive analytics to power everything from AI-driven demand forecasting to AI-powered product recommendations and supply chain optimization. This technological shift is also addressing critical industry vulnerabilities, with advanced counterfeit detection systems now blocking over 99% of suspected fraudulent listings before they can impact consumers.
  • The rise of generative AI models facilitates everything from AI-driven visual merchandising to personalized marketing at scale. A key boardroom consideration is navigating ethical AI and data privacy regulations, which directly influences the architecture of hyper-personalization engines and AI-driven clienteling tools. Success hinges on using these technologies to augment, not replace, the core tenets of luxury service and craftsmanship.

What are the Key Data Covered in this AI In Luxury Brands Market Research and Growth Report?

  • What is the expected growth of the AI In Luxury Brands Market between 2025 and 2029?

    • USD 1.60 billion, at a CAGR of 19.1%

  • What segmentation does the market report cover?

    • The report is segmented by Technology (Machine learning, Natural language processing and Computer vision), Application (Trend forecasting, Customer service chatbots, Virtual try-on and fitting rooms, Personalization and recommendation engines and Others), End-user (Apparel, Footwear, Accessories, Cosmetics and Jewelry) and Geography (North America, Europe, APAC, South America, Middle East and Africa)

  • Which regions are analyzed in the report?

    • North America, Europe, APAC, South America and Middle East and Africa

  • What are the key growth drivers and market challenges?

    • Enhanced personalization and customer experience, Preserving brand exclusivity and human element amidst AI integration

  • Who are the major players in the AI In Luxury Brands Market?

    • Balenciaga SA, Burberry Group Plc, Cartier SA, Chanel Ltd., Christian Dior SE, Compagnie Financiere Richemont SA, Google LLC, Guccio Gucci SpA, IBM Corp., Kering SA, LVMH Moet Hennessy, Microsoft Corp., Moncler S.P.A., Oracle Corp., Perfect Corp., Revieve Inc., The Estee Lauder Companies and The LVMH group

Market Research Insights

  • The market is being reshaped by the strategic deployment of AI, with a focus on delivering a seamless omnichannel retail integration and immersive brand experience. The implementation of conversational commerce platforms and data anonymization protocols is becoming standard as brands seek to build trust while personalizing interactions.
  • The effectiveness of these technologies is clear; AI-driven counterfeit detection systems now achieve over 99% accuracy in identifying fraudulent goods, directly protecting brand revenue and reputation. Moreover, the use of predictive customer segmentation and AI-driven content generation has led to significant operational gains, with some brands achieving a remarkable 38% reduction in customer acquisition costs.
  • This fusion of digital intelligence with a phygital retail strategy is central to achieving a competitive edge.

We can help! Our analysts can customize this ai in luxury brands market research report to meet your requirements.

Get in touch

1. Executive Summary

1.1 Market overview

Executive Summary - Chart on Market Overview
Executive Summary - Data Table on Market Overview
Executive Summary - Chart on Global Market Characteristics
Executive Summary - Chart on Market by Geography
Executive Summary - Chart on Market Segmentation by Technology
Executive Summary - Chart on Market Segmentation by Application
Executive Summary - Chart on Market Segmentation by End-user
Executive Summary - Chart on Incremental Growth
Executive Summary - Data Table on Incremental Growth
Executive Summary - Chart on Company Market Positioning

2. Technavio Analysis

2.1 Analysis of price sensitivity, lifecycle, customer purchase basket, adoption rates, and purchase criteria

2.2 Criticality of inputs and Factors of differentiation

Chart on Overview on criticality of inputs and factors of differentiation

2.3 Factors of disruption

Chart on Overview on factors of disruption

2.4 Impact of drivers and challenges

Chart on Impact of drivers and challenges in 2024 and 2029

3. Market Landscape

3.1 Market ecosystem

Chart on Parent Market
Data Table on - Parent Market

3.2 Market characteristics

Chart on Market characteristics analysis

3.3 Value chain analysis

Chart on Value chain analysis

4. Market Sizing

4.1 Market definition

Data Table on Offerings of companies included in the market definition

4.2 Market segment analysis

Market segments

4.3 Market size 2024

4.4 Market outlook: Forecast for 2024-2029

Chart on Global - Market size and forecast 2024-2029 ($ million)
Data Table on Global - Market size and forecast 2024-2029 ($ million)
Chart on Global Market: Year-over-year growth 2024-2029 (%)
Data Table on Global Market: Year-over-year growth 2024-2029 (%)

5. Historic Market Size

5.1 Global AI In Luxury Brands Market 2019 - 2023

Historic Market Size - Data Table on Global AI In Luxury Brands Market 2019 - 2023 ($ million)

5.2 Technology segment analysis 2019 - 2023

Historic Market Size - Technology Segment 2019 - 2023 ($ million)

5.3 Application segment analysis 2019 - 2023

Historic Market Size - Application Segment 2019 - 2023 ($ million)

5.4 End-user segment analysis 2019 - 2023

Historic Market Size - End-user Segment 2019 - 2023 ($ million)

5.5 Geography segment analysis 2019 - 2023

Historic Market Size - Geography Segment 2019 - 2023 ($ million)

5.6 Country segment analysis 2019 - 2023

Historic Market Size - Country Segment 2019 - 2023 ($ million)

6. Five Forces Analysis

6.1 Five forces summary

Five forces analysis - Comparison between 2024 and 2029

6.2 Bargaining power of buyers

Bargaining power of buyers - Impact of key factors 2024 and 2029

6.3 Bargaining power of suppliers

Bargaining power of suppliers - Impact of key factors in 2024 and 2029

6.4 Threat of new entrants

Threat of new entrants - Impact of key factors in 2024 and 2029

6.5 Threat of substitutes

Threat of substitutes - Impact of key factors in 2024 and 2029

6.6 Threat of rivalry

Threat of rivalry - Impact of key factors in 2024 and 2029

6.7 Market condition

Chart on Market condition - Five forces 2024 and 2029

7. Market Segmentation by Technology

7.1 Market segments

Chart on Technology - Market share 2024-2029 (%)
Data Table on Technology - Market share 2024-2029 (%)

7.2 Comparison by Technology

Chart on Comparison by Technology
Data Table on Comparison by Technology

7.3 Machine learning - Market size and forecast 2024-2029

Chart on Machine learning - Market size and forecast 2024-2029 ($ million)
Data Table on Machine learning - Market size and forecast 2024-2029 ($ million)
Chart on Machine learning - Year-over-year growth 2024-2029 (%)
Data Table on Machine learning - Year-over-year growth 2024-2029 (%)

7.4 Natural language processing - Market size and forecast 2024-2029

Chart on Natural language processing - Market size and forecast 2024-2029 ($ million)
Data Table on Natural language processing - Market size and forecast 2024-2029 ($ million)
Chart on Natural language processing - Year-over-year growth 2024-2029 (%)
Data Table on Natural language processing - Year-over-year growth 2024-2029 (%)

7.5 Computer vision - Market size and forecast 2024-2029

Chart on Computer vision - Market size and forecast 2024-2029 ($ million)
Data Table on Computer vision - Market size and forecast 2024-2029 ($ million)
Chart on Computer vision - Year-over-year growth 2024-2029 (%)
Data Table on Computer vision - Year-over-year growth 2024-2029 (%)

7.6 Market opportunity by Technology

Market opportunity by Technology ($ million)
Data Table on Market opportunity by Technology ($ million)

8. Market Segmentation by Application

8.1 Market segments

Chart on Application - Market share 2024-2029 (%)
Data Table on Application - Market share 2024-2029 (%)

8.2 Comparison by Application

Chart on Comparison by Application
Data Table on Comparison by Application

8.3 Trend forecasting - Market size and forecast 2024-2029

Chart on Trend forecasting - Market size and forecast 2024-2029 ($ million)
Data Table on Trend forecasting - Market size and forecast 2024-2029 ($ million)
Chart on Trend forecasting - Year-over-year growth 2024-2029 (%)
Data Table on Trend forecasting - Year-over-year growth 2024-2029 (%)

8.4 Customer service chatbots - Market size and forecast 2024-2029

Chart on Customer service chatbots - Market size and forecast 2024-2029 ($ million)
Data Table on Customer service chatbots - Market size and forecast 2024-2029 ($ million)
Chart on Customer service chatbots - Year-over-year growth 2024-2029 (%)
Data Table on Customer service chatbots - Year-over-year growth 2024-2029 (%)

8.5 Virtual try-on and fitting rooms - Market size and forecast 2024-2029

Chart on Virtual try-on and fitting rooms - Market size and forecast 2024-2029 ($ million)
Data Table on Virtual try-on and fitting rooms - Market size and forecast 2024-2029 ($ million)
Chart on Virtual try-on and fitting rooms - Year-over-year growth 2024-2029 (%)
Data Table on Virtual try-on and fitting rooms - Year-over-year growth 2024-2029 (%)

8.6 Personalization and recommendation engines - Market size and forecast 2024-2029

Chart on Personalization and recommendation engines - Market size and forecast 2024-2029 ($ million)
Data Table on Personalization and recommendation engines - Market size and forecast 2024-2029 ($ million)
Chart on Personalization and recommendation engines - Year-over-year growth 2024-2029 (%)
Data Table on Personalization and recommendation engines - Year-over-year growth 2024-2029 (%)

8.7 Others - Market size and forecast 2024-2029

Chart on Others - Market size and forecast 2024-2029 ($ million)
Data Table on Others - Market size and forecast 2024-2029 ($ million)
Chart on Others - Year-over-year growth 2024-2029 (%)
Data Table on Others - Year-over-year growth 2024-2029 (%)

8.8 Market opportunity by Application

Market opportunity by Application ($ million)
Data Table on Market opportunity by Application ($ million)

9. Market Segmentation by End-user

9.1 Market segments

Chart on End-user - Market share 2024-2029 (%)
Data Table on End-user - Market share 2024-2029 (%)

9.2 Comparison by End-user

Chart on Comparison by End-user
Data Table on Comparison by End-user

9.3 Apparel - Market size and forecast 2024-2029

Chart on Apparel - Market size and forecast 2024-2029 ($ million)
Data Table on Apparel - Market size and forecast 2024-2029 ($ million)
Chart on Apparel - Year-over-year growth 2024-2029 (%)
Data Table on Apparel - Year-over-year growth 2024-2029 (%)

9.4 Footwear - Market size and forecast 2024-2029

Chart on Footwear - Market size and forecast 2024-2029 ($ million)
Data Table on Footwear - Market size and forecast 2024-2029 ($ million)
Chart on Footwear - Year-over-year growth 2024-2029 (%)
Data Table on Footwear - Year-over-year growth 2024-2029 (%)

9.5 Accessories - Market size and forecast 2024-2029

Chart on Accessories - Market size and forecast 2024-2029 ($ million)
Data Table on Accessories - Market size and forecast 2024-2029 ($ million)
Chart on Accessories - Year-over-year growth 2024-2029 (%)
Data Table on Accessories - Year-over-year growth 2024-2029 (%)

9.6 Cosmetics - Market size and forecast 2024-2029

Chart on Cosmetics - Market size and forecast 2024-2029 ($ million)
Data Table on Cosmetics - Market size and forecast 2024-2029 ($ million)
Chart on Cosmetics - Year-over-year growth 2024-2029 (%)
Data Table on Cosmetics - Year-over-year growth 2024-2029 (%)

9.7 Jewelry - Market size and forecast 2024-2029

Chart on Jewelry - Market size and forecast 2024-2029 ($ million)
Data Table on Jewelry - Market size and forecast 2024-2029 ($ million)
Chart on Jewelry - Year-over-year growth 2024-2029 (%)
Data Table on Jewelry - Year-over-year growth 2024-2029 (%)

9.8 Market opportunity by End-user

Market opportunity by End-user ($ million)
Data Table on Market opportunity by End-user ($ million)

10. Customer Landscape

10.1 Customer landscape overview

Analysis of price sensitivity, lifecycle, customer purchase basket, adoption rates, and purchase criteria

11. Geographic Landscape

11.1 Geographic segmentation

Chart on Market share by geography 2024-2029 (%)
Data Table on Market share by geography 2024-2029 (%)

11.2 Geographic comparison

Chart on Geographic comparison
Data Table on Geographic comparison

11.3 North America - Market size and forecast 2024-2029

Chart on North America - Market size and forecast 2024-2029 ($ million)
Data Table on North America - Market size and forecast 2024-2029 ($ million)
Chart on North America - Year-over-year growth 2024-2029 (%)
Data Table on North America - Year-over-year growth 2024-2029 (%)
Chart on Regional Comparison - North America
Data Table on Regional Comparison - North America

11.3.1 US - Market size and forecast 2024-2029

Chart on US - Market size and forecast 2024-2029 ($ million)
Data Table on US - Market size and forecast 2024-2029 ($ million)
Chart on US - Year-over-year growth 2024-2029 (%)
Data Table on US - Year-over-year growth 2024-2029 (%)

11.3.2 Canada - Market size and forecast 2024-2029

Chart on Canada - Market size and forecast 2024-2029 ($ million)
Data Table on Canada - Market size and forecast 2024-2029 ($ million)
Chart on Canada - Year-over-year growth 2024-2029 (%)
Data Table on Canada - Year-over-year growth 2024-2029 (%)

11.4 Europe - Market size and forecast 2024-2029

Chart on Europe - Market size and forecast 2024-2029 ($ million)
Data Table on Europe - Market size and forecast 2024-2029 ($ million)
Chart on Europe - Year-over-year growth 2024-2029 (%)
Data Table on Europe - Year-over-year growth 2024-2029 (%)
Chart on Regional Comparison - Europe
Data Table on Regional Comparison - Europe

11.4.1 UK - Market size and forecast 2024-2029

Chart on UK - Market size and forecast 2024-2029 ($ million)
Data Table on UK - Market size and forecast 2024-2029 ($ million)
Chart on UK - Year-over-year growth 2024-2029 (%)
Data Table on UK - Year-over-year growth 2024-2029 (%)

11.4.2 Germany - Market size and forecast 2024-2029

Chart on Germany - Market size and forecast 2024-2029 ($ million)
Data Table on Germany - Market size and forecast 2024-2029 ($ million)
Chart on Germany - Year-over-year growth 2024-2029 (%)
Data Table on Germany - Year-over-year growth 2024-2029 (%)

11.4.3 France - Market size and forecast 2024-2029

Chart on France - Market size and forecast 2024-2029 ($ million)
Data Table on France - Market size and forecast 2024-2029 ($ million)
Chart on France - Year-over-year growth 2024-2029 (%)
Data Table on France - Year-over-year growth 2024-2029 (%)

11.4.4 Italy - Market size and forecast 2024-2029

Chart on Italy - Market size and forecast 2024-2029 ($ million)
Data Table on Italy - Market size and forecast 2024-2029 ($ million)
Chart on Italy - Year-over-year growth 2024-2029 (%)
Data Table on Italy - Year-over-year growth 2024-2029 (%)

11.5 APAC - Market size and forecast 2024-2029

Chart on APAC - Market size and forecast 2024-2029 ($ million)
Data Table on APAC - Market size and forecast 2024-2029 ($ million)
Chart on APAC - Year-over-year growth 2024-2029 (%)
Data Table on APAC - Year-over-year growth 2024-2029 (%)
Chart on Regional Comparison - APAC
Data Table on Regional Comparison - APAC

11.5.1 China - Market size and forecast 2024-2029

Chart on China - Market size and forecast 2024-2029 ($ million)
Data Table on China - Market size and forecast 2024-2029 ($ million)
Chart on China - Year-over-year growth 2024-2029 (%)
Data Table on China - Year-over-year growth 2024-2029 (%)

11.5.2 Japan - Market size and forecast 2024-2029

Chart on Japan - Market size and forecast 2024-2029 ($ million)
Data Table on Japan - Market size and forecast 2024-2029 ($ million)
Chart on Japan - Year-over-year growth 2024-2029 (%)
Data Table on Japan - Year-over-year growth 2024-2029 (%)

11.5.3 South Korea - Market size and forecast 2024-2029

Chart on South Korea - Market size and forecast 2024-2029 ($ million)
Data Table on South Korea - Market size and forecast 2024-2029 ($ million)
Chart on South Korea - Year-over-year growth 2024-2029 (%)
Data Table on South Korea - Year-over-year growth 2024-2029 (%)

11.5.4 India - Market size and forecast 2024-2029

Chart on India - Market size and forecast 2024-2029 ($ million)
Data Table on India - Market size and forecast 2024-2029 ($ million)
Chart on India - Year-over-year growth 2024-2029 (%)
Data Table on India - Year-over-year growth 2024-2029 (%)

11.6 South America - Market size and forecast 2024-2029

Chart on South America - Market size and forecast 2024-2029 ($ million)
Data Table on South America - Market size and forecast 2024-2029 ($ million)
Chart on South America - Year-over-year growth 2024-2029 (%)
Data Table on South America - Year-over-year growth 2024-2029 (%)
Chart on Regional Comparison - South America
Data Table on Regional Comparison - South America

11.6.1 Brazil - Market size and forecast 2024-2029

Chart on Brazil - Market size and forecast 2024-2029 ($ million)
Data Table on Brazil - Market size and forecast 2024-2029 ($ million)
Chart on Brazil - Year-over-year growth 2024-2029 (%)
Data Table on Brazil - Year-over-year growth 2024-2029 (%)

11.6.2 Argentina - Market size and forecast 2024-2029

Chart on Argentina - Market size and forecast 2024-2029 ($ million)
Data Table on Argentina - Market size and forecast 2024-2029 ($ million)
Chart on Argentina - Year-over-year growth 2024-2029 (%)
Data Table on Argentina - Year-over-year growth 2024-2029 (%)

11.7 Middle East and Africa - Market size and forecast 2024-2029

Chart on Middle East and Africa - Market size and forecast 2024-2029 ($ million)
Data Table on Middle East and Africa - Market size and forecast 2024-2029 ($ million)
Chart on Middle East and Africa - Year-over-year growth 2024-2029 (%)
Data Table on Middle East and Africa - Year-over-year growth 2024-2029 (%)
Chart on Regional Comparison - Middle East and Africa
Data Table on Regional Comparison - Middle East and Africa

11.7.1 Saudi Arabia - Market size and forecast 2024-2029

Chart on Saudi Arabia - Market size and forecast 2024-2029 ($ million)
Data Table on Saudi Arabia - Market size and forecast 2024-2029 ($ million)
Chart on Saudi Arabia - Year-over-year growth 2024-2029 (%)
Data Table on Saudi Arabia - Year-over-year growth 2024-2029 (%)

11.7.2 UAE - Market size and forecast 2024-2029

Chart on UAE - Market size and forecast 2024-2029 ($ million)
Data Table on UAE - Market size and forecast 2024-2029 ($ million)
Chart on UAE - Year-over-year growth 2024-2029 (%)
Data Table on UAE - Year-over-year growth 2024-2029 (%)

11.8 Market opportunity by geography

Market opportunity by geography ($ million)
Data Tables on Market opportunity by geography ($ million)

12. Drivers, Challenges, and Opportunity

12.1 Market drivers

Enhanced personalization and customer experience
Heightened operational efficiency
Growing imperative for sustainability and ethical practices

12.2 Market challenges

Preserving brand exclusivity and human element amidst AI integration
Navigating complexities of data privacy and ethical AI
High implementation costs, system integration hurdles, and AI talent deficit

12.3 Impact of drivers and challenges

Impact of drivers and challenges in 2024 and 2029

12.4 Market opportunities

Imperative of hyper-personalization and elevated customer experience
Optimizing operations and fostering sustainability through supply chain advancements
Fortifying brand integrity through advanced counterfeit detection

13. Competitive Landscape

13.1 Overview

13.2

Overview on criticality of inputs and factors of differentiation

13.3 Landscape disruption

Overview on factors of disruption

13.4 Industry risks

Impact of key risks on business

14. Competitive Analysis

14.1 Companies profiled

Companies covered

14.2 Company ranking index

14.3 Market positioning of companies

Matrix on companies position and classification

14.4 Balenciaga SA

Balenciaga SA - Overview
Balenciaga SA - Product / Service
Balenciaga SA - Key offerings
SWOT

14.5 Burberry Group Plc

Burberry Group Plc - Overview
Burberry Group Plc - Business segments
Burberry Group Plc - Key news
Burberry Group Plc - Key offerings
Burberry Group Plc - Segment focus
SWOT

14.6 Cartier SA

Cartier SA - Overview
Cartier SA - Product / Service
Cartier SA - Key offerings
SWOT

14.7 Chanel Ltd.

Chanel Ltd. - Overview
Chanel Ltd. - Product / Service
Chanel Ltd. - Key offerings
SWOT

14.8 Christian Dior SE

Christian Dior SE - Overview
Christian Dior SE - Product / Service
Christian Dior SE - Key offerings
SWOT

14.9 Google LLC

Google LLC - Overview
Google LLC - Product / Service
Google LLC - Key offerings
SWOT

14.10 Guccio Gucci SpA

Guccio Gucci SpA - Overview
Guccio Gucci SpA - Product / Service
Guccio Gucci SpA - Key offerings
SWOT

14.11 IBM Corp.

IBM Corp. - Overview
IBM Corp. - Business segments
IBM Corp. - Key news
IBM Corp. - Key offerings
IBM Corp. - Segment focus
SWOT

14.12 LVMH Moet Hennessy

LVMH Moet Hennessy - Overview
LVMH Moet Hennessy - Business segments
LVMH Moet Hennessy - Key news
LVMH Moet Hennessy - Key offerings
LVMH Moet Hennessy - Segment focus
SWOT

14.13 Microsoft Corp.

Microsoft Corp. - Overview
Microsoft Corp. - Business segments
Microsoft Corp. - Key news
Microsoft Corp. - Key offerings
Microsoft Corp. - Segment focus
SWOT

14.14 Oracle Corp.

Oracle Corp. - Overview
Oracle Corp. - Business segments
Oracle Corp. - Key news
Oracle Corp. - Key offerings
Oracle Corp. - Segment focus
SWOT

14.15 Perfect Corp.

Perfect Corp. - Overview
Perfect Corp. - Product / Service
Perfect Corp. - Key offerings
SWOT

14.16 Revieve Inc.

Revieve Inc. - Overview
Revieve Inc. - Product / Service
Revieve Inc. - Key offerings
SWOT

14.17 The Estee Lauder Companies

The Estee Lauder Companies - Overview
The Estee Lauder Companies - Product / Service
The Estee Lauder Companies - Key offerings
SWOT

14.18 The LVMH group

The LVMH group - Overview
The LVMH group - Business segments
The LVMH group - Key offerings
The LVMH group - Segment focus
SWOT

15. Appendix

15.1 Scope of the report

Market definition
Objectives
Notes and caveats

15.2 Inclusions and exclusions checklist

Inclusions checklist
Exclusions checklist

15.3 Currency conversion rates for US$

15.4 Research methodology

15.5 Data procurement

Information sources

15.6 Data validation

15.7 Validation techniques employed for market sizing

15.8 Data synthesis

15.9 360 degree market analysis

15.10 List of abbreviations

Research Methodology

Technavio presents a detailed picture of the market by way of study, synthesis, and summation of data from multiple sources. The analysts have presented the various facets of the market with a particular focus on identifying the key industry influencers. The data thus presented is comprehensive, reliable, and the result of extensive research, both primary and secondary.

INFORMATION SOURCES

Primary sources

  • Manufacturers and suppliers
  • Channel partners
  • Industry experts
  • Strategic decision makers

Secondary sources

  • Industry journals and periodicals
  • Government data
  • Financial reports of key industry players
  • Historical data
  • Press releases

DATA ANALYSIS

Data Synthesis

  • Collation of data
  • Estimation of key figures
  • Analysis of derived insights

Data Validation

  • Triangulation with data models
  • Reference against proprietary databases
  • Corroboration with industry experts

REPORT WRITING

Qualitative

  • Market drivers
  • Market challenges
  • Market trends
  • Five forces analysis

Quantitative

  • Market size and forecast
  • Market segmentation
  • Geographical insights
  • Competitive landscape

Interested in this report?

Get your sample now to see our research methodology and insights!

Download Now

Frequently Asked Questions

AI In Luxury Brands market growth will increase by USD 1601.8 million during 2025-2029.

The AI In Luxury Brands market is expected to grow at a CAGR of 19.1% during 2025-2029.

AI In Luxury Brands market is segmented by Technology (Machine learning, Natural language processing, Computer vision) Application (Trend forecasting, Customer service chatbots, Virtual try-on and fitting rooms, Personalization and recommendation engines, Others) End-user (Apparel, Footwear, Accessories, Cosmetics, Jewelry)

Balenciaga SA, Burberry Group Plc, Cartier SA, Chanel Ltd., Christian Dior SE, Compagnie Financiere Richemont SA, Google LLC, Guccio Gucci SpA, IBM Corp., Kering SA, LVMH Moet Hennessy, Microsoft Corp., Moncler S.P.A., Oracle Corp., Perfect Corp., Revieve Inc., The Estee Lauder Companies, The LVMH group are a few of the key vendors in the AI In Luxury Brands market.

North America will register the highest growth rate of 32.2% among the other regions. Therefore, the AI In Luxury Brands market in North America is expected to garner significant business opportunities for the vendors during the forecast period.

US, Canada, UK, Germany, France, Italy, China, Japan, South Korea, India, Brazil, Argentina, Saudi Arabia, UAE

  • Enhanced personalization and customer experience is the driving factor this market.

The AI In Luxury Brands market vendors should focus on grabbing business opportunities from the Technology segment as it accounted for the largest market share in the base year.