AI Note Taking Market Analysis, Size, and Forecast 2025-2029: North America (US, Canada, and Mexico), APAC (China, India, and Japan), Europe (UK, Germany, and France), South America (Brazil, Argentina, and Colombia), Middle East and Africa (Saudi Arabia, UAE, and Israel), and Rest of World (ROW)

AI Note Taking Market Analysis, Size, and Forecast 2025-2029:
North America (US, Canada, and Mexico), APAC (China, India, and Japan), Europe (UK, Germany, and France), South America (Brazil, Argentina, and Colombia), Middle East and Africa (Saudi Arabia, UAE, and Israel), and Rest of World (ROW)

Published: Dec 2025 299 Pages SKU: IRTNTR81020

Market Overview at a Glance

$821 Mn
Market Opportunity
21.3%
CAGR 2024 - 2029
32%
North America Growth
$322.1 Mn
Software segment 2023

AI Note Taking Market Size 2025-2029

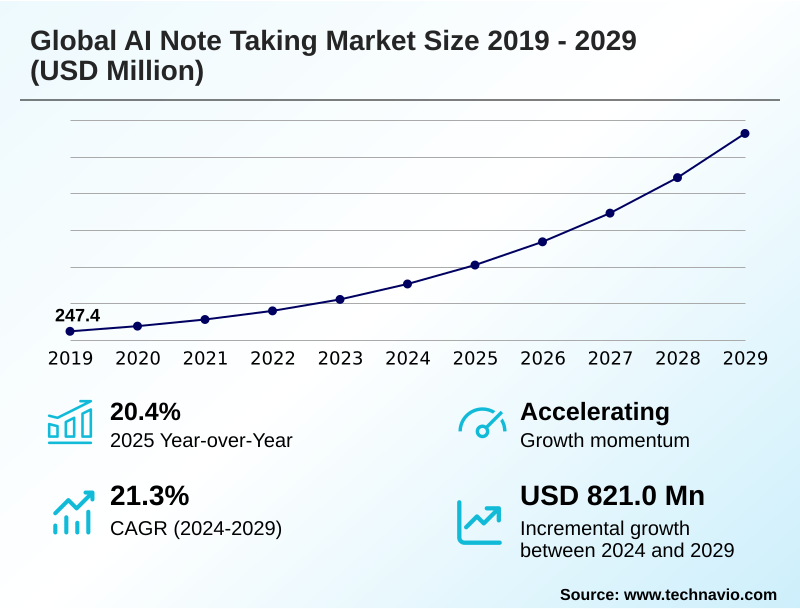
The ai note taking market size is valued to increase by USD 821 million, at a CAGR of 21.3% from 2024 to 2029. Pervasive adoption of remote and hybrid work models will drive the ai note taking market.

Major Market Trends & Insights

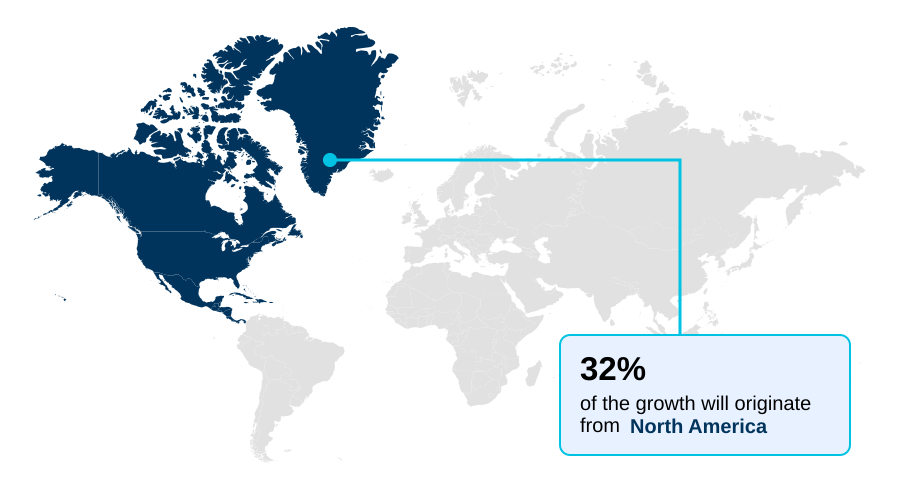
  • North America dominated the market and accounted for a 32% growth during the forecast period.
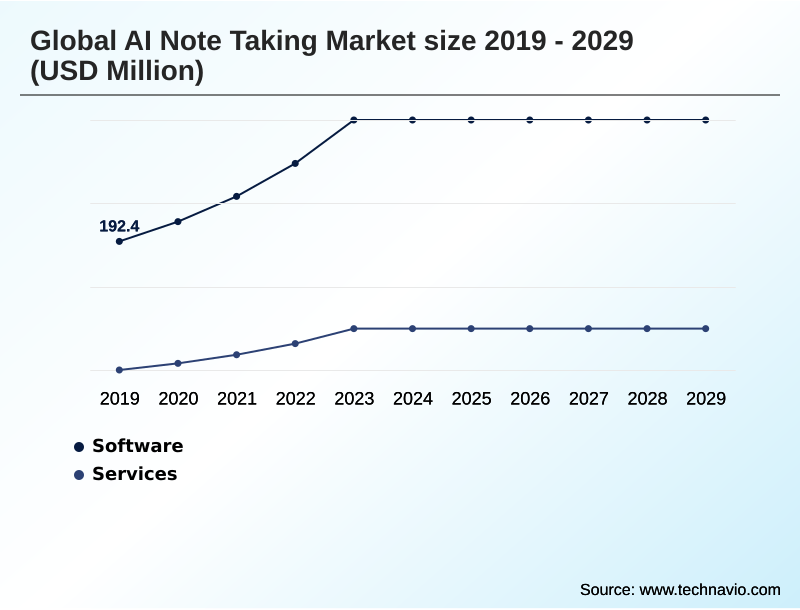
  • By Component - Software segment was valued at USD 322.1 million in 2023
  • By Application - Education segment accounted for the largest market revenue share in 2023

Market Size & Forecast

  • Market Opportunities: USD 1.08 billion
  • Market Future Opportunities: USD 821 million
  • CAGR from 2024 to 2029 : 21.3%

Market Summary

  • The AI note taking market is expanding rapidly, driven by the increasing need for automated documentation and enhanced enterprise productivity. Core technologies, including advanced natural language processing and machine learning algorithms, are transforming simple transcription tools into platforms offering deep conversational intelligence. This evolution is critical in hybrid work environments, where virtual collaboration demands efficient information capture.
  • For example, a sales organization can leverage an AI meeting assistant to automatically log call notes into its crm integration, analyze discussions for sentiment, and track action items, thereby freeing up sales representatives to focus on relationship-building rather than administrative tasks.
  • This shift toward intelligent automation is also prominent in specialized fields like healthcare, where the clinical documentation process is being streamlined. However, the market faces challenges related to data security and the need for high-accuracy automated clinical documentation, which tempers the pace of adoption in risk-averse industries.

What will be the Size of the AI Note Taking Market during the forecast period?

Get Key Insights on Market Forecast (PDF) Request Free Sample

How is the AI Note Taking Market Segmented?

The ai note taking industry research report provides comprehensive data (region-wise segment analysis), with forecasts and estimates in "USD million" for the period 2025-2029, as well as historical data from 2019-2023 for the following segments.

  • Component
    • Software
    • Services
  • Application
    • Education
    • Corporate
    • Healthcare
    • Legal
    • Others
  • End-user
    • Students
    • Educators
    • Professionals
    • Researchers
    • Others
  • Geography
    • North America
      • US
      • Canada
      • Mexico
    • APAC
      • China
      • India
      • Japan
    • Europe
      • UK
      • Germany
      • France
    • South America
      • Brazil
      • Argentina
      • Colombia
    • Middle East and Africa
      • Saudi Arabia
      • UAE
      • Israel
    • Rest of World (ROW)

By Component Insights

The software segment is estimated to witness significant growth during the forecast period.

The software segment is the market's core, driven by tools that leverage natural language processing and advanced machine learning algorithms. These platforms deliver significant gains in enterprise productivity through features like real-time transcription and automated summarization.

With 75% of knowledge workers now using AI on the job, the demand for sophisticated virtual collaboration tools is clear. Solutions are evolving to include speaker identification and sentiment analysis, enabling deeper insights from meeting data.

The integration of these tools with existing systems, especially for functions like sales cycle analysis and deal history analysis through crm integration, is transforming unstructured conversations into strategic assets for a more effective meeting productivity platform.

This shift is essential for maintaining information parity and efficiency in modern work environments.

Request Free Sample

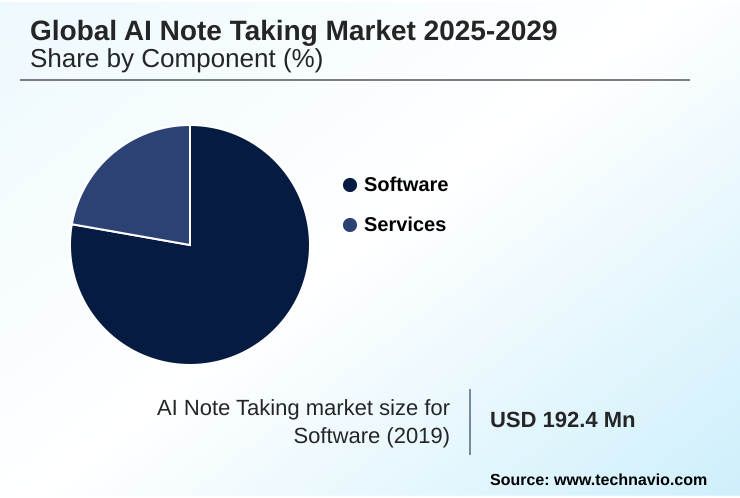
The Software segment was valued at USD 322.1 million in 2023 and showed a gradual increase during the forecast period.

Request Free Sample

Regional Analysis

North America is estimated to contribute 32% to the growth of the global market during the forecast period.Technavio’s analysts have elaborately explained the regional trends and drivers that shape the market during the forecast period.

See How AI Note Taking Market Demand is Rising in North America Request Free Sample

The global landscape for AI adoption shows distinct regional dynamics, with adoption rates in some APAC nations reaching 92% among knowledge workers.

This high level of integration creates a fertile ground for sophisticated AI voice agents and advanced voice transcription services.

In markets like the Middle East and Africa, business readiness is also high, with 77% of decision-makers prepared to adopt AI tools immediately.

North America and Europe lead in deploying specialized solutions, where tools powered by models like gpt-4 and whisper are used for legal practice automation and qualitative data collection.

In healthcare, the use of AI for clinical documentation saves physicians significant time.

The integration of ai-powered search within a knowledge management system and connectivity with third-party applications via platforms like the zoom ai companion are becoming standard expectations, pushing vendors to offer seamless backlinking and calendar integration features.

Market Dynamics

Our researchers analyzed the data with 2024 as the base year, along with the key drivers, trends, and challenges. A holistic analysis of drivers will help companies refine their marketing strategies to gain a competitive advantage.

  • The strategic implementation of AI note taking for remote teams has become critical for organizational efficiency. For specialized fields, automated transcription for legal depositions is reducing manual labor, while AI meeting summaries for salesforce are providing sales teams with actionable insights directly within their workflow.
  • The rise of generative AI in corporate meetings is moving beyond simple transcription to intelligent analysis, although improving accuracy in AI transcription remains a persistent challenge. As organizations scale these tools, addressing data privacy in AI note taking and ensuring AI note taking compliance with gdpr are non-negotiable.
  • The benefits of AI note takers in education are clear, especially with real-time transcription for student lectures. For enterprises, integrating AI notetakers with crm and using AI to track meeting action items are key to ROI.
  • The market is diversifying, with bot-free AI meeting transcription tools gaining favor for their unobtrusive nature, and AI note taking for multilingual meetings addressing the needs of global corporations. Advanced functionalities, such as sentiment analysis in customer calls, are enhancing business intelligence.
  • As a result, companies are seeking the best AI tools for academic research and AI note taking for project management, while evaluating voice recognition accuracy in noisy environments. The ultimate goal for many is achieving comprehensive AI-powered knowledge management for enterprises by automating meeting notes with generative AI and ensuring AI for clinical documentation automation is both reliable and secure.

What are the key market drivers leading to the rise in the adoption of AI Note Taking Industry?

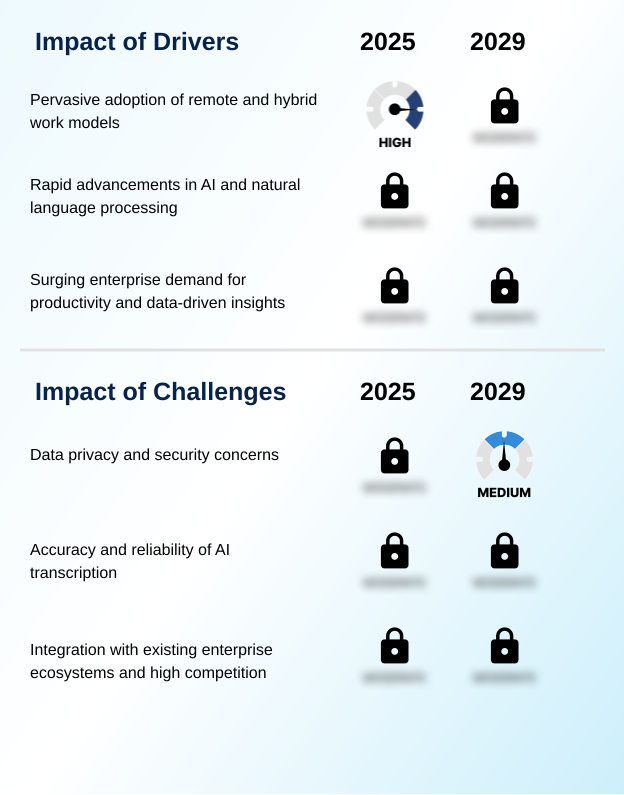
  • The pervasive adoption of remote and hybrid work models serves as a key driver for the market, increasing the demand for efficient collaboration and documentation solutions.

  • Market growth is fueled by measurable productivity enhancements and the increasing sophistication of AI capabilities. With 56.7% of businesses reporting a very positive impact from generative AI, enterprises are aggressively adopting tools that offer ai-driven insights.
  • The shift is toward platforms that provide deep contextual understanding and topic modeling to automatically structure conversational data. This is particularly valuable for sales intelligence and qualitative academic research, where identifying themes is critical.
  • Key drivers include features like AI-powered transcription with precise action item detection, which helps build a searchable corporate knowledge repository. Solutions are also becoming more specialized, with a focus on use cases such as deposition analysis and case management.
  • The development of the multimodal AI workspace, which integrates semantic search with traditional note-taking, is another significant driver, pushing the market beyond basic transcription toward holistic knowledge management.

What are the market trends shaping the AI Note Taking Industry?

  • The proliferation of remote and hybrid work models is a significant market trend. This shift drives the adoption of tools that ensure seamless communication and information parity among geographically dispersed teams.

  • Key market trends are centered on embedding deeper intelligence and automation into user workflows. The integration of generative AI models is a primary driver, transforming platforms into proactive partners for content creation and analysis.
  • In education, the impact is significant, with educator sentiment toward AI showing a twofold increase as tools for adaptive tutoring and creating personalized learning tools become more accessible. For students, this translates to tangible benefits, with 86% now using AI in their studies.
  • In the corporate sector, where 90% of users report time savings from AI, the focus is on achieving contextual understanding in communications. This enables sophisticated automated documentation, which is crucial for asynchronous collaboration.
  • The rise of the AI meeting assistant is a core trend, evolving from a simple recorder to a hub for conversational intelligence that supports the entire clinical documentation process, especially when integrated with electronic health records systems.

What challenges does the AI Note Taking Industry face during its growth?

  • Significant data privacy and security concerns represent a key challenge affecting industry growth, particularly in highly regulated sectors.

  • Key market challenges revolve around security, accuracy, and integration complexity, which temper rapid adoption despite clear benefits. While 8.2% of companies increased AI investment, concerns over data privacy remain a primary barrier. The need for high-accuracy bot-free transcription and reliable speaker labeling is critical, as errors can have significant consequences.
  • Effective background noise removal is an ongoing technical hurdle for ai-powered voice productivity. As platforms evolve into a centralized knowledge management platform with features like image recognition and intelligent meeting recaps, the complexity of ensuring secure and compliant content lifecycle management also grows. Challenges in metadata tagging and realizing post-production benefits hinder ROI.
  • In education, while tools for ai-assisted writing tools and interactive exam preparation show promise, ensuring equitable access and effective classroom management remains a concern, along with the reliability of ai math assistance features.

Exclusive Technavio Analysis on Customer Landscape

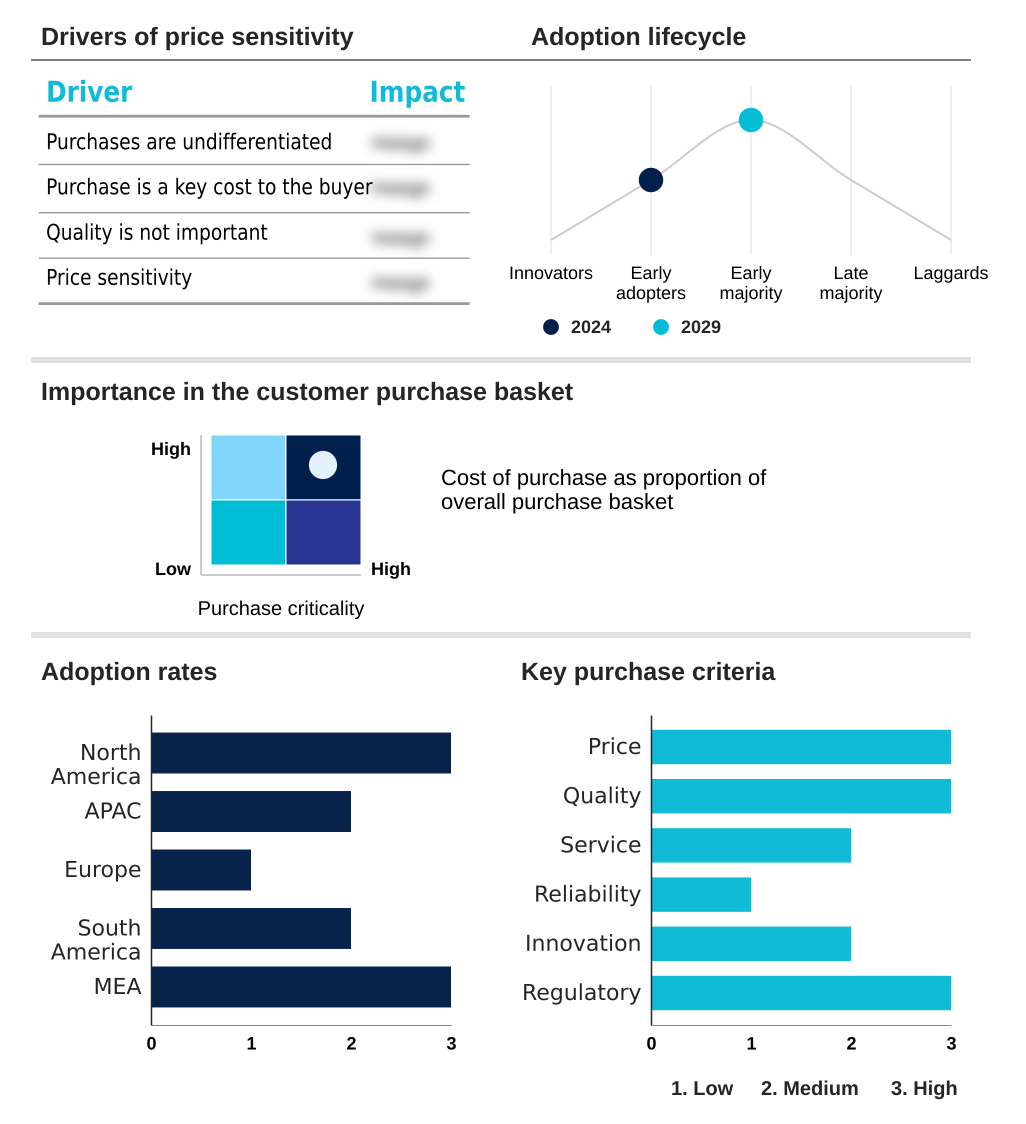
The ai note taking market forecasting report includes the adoption lifecycle of the market, covering from the innovator’s stage to the laggard’s stage. It focuses on adoption rates in different regions based on penetration. Furthermore, the ai note taking market report also includes key purchase criteria and drivers of price sensitivity to help companies evaluate and develop their market growth analysis strategies.

Customer Landscape of AI Note Taking Industry

Competitive Landscape

Companies are implementing various strategies, such as strategic alliances, ai note taking market forecast, partnerships, mergers and acquisitions, geographical expansion, and product/service launches, to enhance their presence in the industry.

Albus Technologies Ltd. - Offerings include an AI meeting assistant providing complimentary recording, transcription, and summarization for virtual meetings, enhancing user productivity and information recall.

The industry research and growth report includes detailed analyses of the competitive landscape of the market and information about key companies, including:

  • Albus Technologies Ltd.
  • Equalicert Inc.
  • Fathom Video Inc.
  • Fellow Insights Inc.
  • Fireflies.ai Corp.
  • Google LLC
  • Granola Inc.
  • IBM Corp.
  • Jamie
  • Krisp Technologies Inc.
  • Meetgeek.ai
  • Mem Labs Inc.
  • Microsoft Corp.
  • Notion Labs Inc.
  • Otter.ai Inc.
  • Reflect App LLC.
  • Zoom Communications Inc.

Qualitative and quantitative analysis of companies has been conducted to help clients understand the wider business environment as well as the strengths and weaknesses of key industry players. Data is qualitatively analyzed to categorize companies as pure play, category-focused, industry-focused, and diversified; it is quantitatively analyzed to categorize companies as dominant, leading, strong, tentative, and weak.

Recent Development and News in Ai note taking market

  • In August, 2024, Google Meet introduced an AI-driven note-taking feature for specific Google Workspace customers to automatically summarize meeting discussions and generate notes in a document.
  • In October, 2024, Zoom announced its next-generation AI Companion 2.0, designed to function as a personal assistant across its entire workplace platform by synthesizing data from multiple sources.
  • In February, 2025, Trint launched AI Summaries, a feature enabling users to generate a concise summary of a transcript with a single click to quickly identify key themes and quotes from interviews.
  • In May, 2025, Japan Airlines detailed a company-wide rollout of generative AI tools, including an application to transcribe verbal accounts from cabin attendants to automate report generation and improve efficiency.

Dive into Technavio’s robust research methodology, blending expert interviews, extensive data synthesis, and validated models for unparalleled AI Note Taking Market insights. See full methodology.

Market Scope
Page number 299
Base year 2024
Historic period 2019-2023
Forecast period 2025-2029
Growth momentum & CAGR Accelerate at a CAGR of 21.3%
Market growth 2025-2029 USD 821.0 million
Market structure Fragmented
YoY growth 2024-2025(%) 20.4%
Key countries US, Canada, Mexico, China, India, Japan, Australia, South Korea, Indonesia, UK, Germany, France, Italy, Spain, The Netherlands, Brazil, Argentina, Colombia, Saudi Arabia, UAE, Israel, South Africa and Turkey
Competitive landscape Leading Companies, Market Positioning of Companies, Competitive Strategies, and Industry Risks

Request Free Sample

Research Analyst Overview

  • The market is defined by a rapid technological evolution where AI-powered transcription and automated summarization are now baseline expectations. The core technology stack, built on natural language processing and machine learning algorithms, is advancing toward true conversational intelligence.
  • Boardroom-level decisions now weigh the benefits of adopting a specialized AI meeting assistant against integrated solutions like the zoom ai companion, with ROI often being the deciding factor. For instance, some firms have achieved an 18% reduction in certain operational costs by automating documentation.
  • Sophisticated generative AI models, including gpt-4 and whisper, are enabling features like bot-free transcription and enhanced contextual understanding. This allows for precise action item detection, topic modeling, and sentiment analysis. The technology's application is broadening into specialized areas with tools like ambient clinical scribes and AI medical scribes transforming clinical workflows.
  • The focus is shifting to a multimodal ai workspace that incorporates semantic search and image recognition, supported by robust voice recognition technology. Offerings include intelligent meeting recaps, advanced speaker identification, and ai-powered voice productivity tools that feature background noise removal and precise speaker labeling, all contributing to a more comprehensive knowledge management platform that provides ai-driven insights.

What are the Key Data Covered in this AI Note Taking Market Research and Growth Report?

  • What is the expected growth of the AI Note Taking Market between 2025 and 2029?

    • USD 821 million, at a CAGR of 21.3%

  • What segmentation does the market report cover?

    • The report is segmented by Component (Software, Services), Application (Education, Corporate, Healthcare, Legal, Others), End-user (Students, Educators, Professionals, Researchers, Others) and Geography (North America, APAC, Europe, South America, Middle East and Africa)

  • Which regions are analyzed in the report?

    • North America, APAC, Europe, South America and Middle East and Africa

  • What are the key growth drivers and market challenges?

    • Pervasive adoption of remote and hybrid work models, Data privacy and security concerns

  • Who are the major players in the AI Note Taking Market?

    • Albus Technologies Ltd., Equalicert Inc., Fathom Video Inc., Fellow Insights Inc., Fireflies.ai Corp., Google LLC, Granola Inc., IBM Corp., Jamie, Krisp Technologies Inc., Meetgeek.ai, Mem Labs Inc., Microsoft Corp., Notion Labs Inc., Otter.ai Inc., Reflect App LLC. and Zoom Communications Inc.

Market Research Insights

  • Market dynamics are increasingly shaped by the demand for quantifiable efficiency gains and specialized applications. In education, where 86% of students now use AI, the focus is on personalized learning tools and adaptive tutoring features to improve outcomes. In sectors like transportation, AI has demonstrated the ability to deliver an 18% reduction in certain operational expenses, driving enterprise adoption.
  • The healthcare sector sees significant time savings, with two-thirds of physicians in pilot programs reporting reduced workloads from tools that integrate with electronic health records systems.
  • This trend is pushing development beyond generic platforms toward solutions that support specific workflows, such as lesson plan generation for educators or seamless integration with project management tools for corporate teams, facilitating asynchronous collaboration and boosting productivity across diverse professional environments.

We can help! Our analysts can customize this ai note taking market research report to meet your requirements.

Get in touch

1. Executive Summary

1.1 Market overview

Executive Summary - Chart on Market Overview
Executive Summary - Data Table on Market Overview
Executive Summary - Chart on Global Market Characteristics
Executive Summary - Chart on Market by Geography
Executive Summary - Chart on Market Segmentation by Component
Executive Summary - Chart on Market Segmentation by Application
Executive Summary - Chart on Market Segmentation by End-user
Executive Summary - Chart on Incremental Growth
Executive Summary - Data Table on Incremental Growth
Executive Summary - Chart on Company Market Positioning

2. Technavio Analysis

2.1 Analysis of price sensitivity, lifecycle, customer purchase basket, adoption rates, and purchase criteria

2.2 Criticality of inputs and Factors of differentiation

Chart on Overview on criticality of inputs and factors of differentiation

2.3 Factors of disruption

Chart on Overview on factors of disruption

2.4 Impact of drivers and challenges

Chart on Impact of drivers and challenges in 2024 and 2029

3. Market Landscape

3.1 Market ecosystem

Chart on Parent Market
Data Table on - Parent Market

3.2 Market characteristics

Chart on Market characteristics analysis

3.3 Value chain analysis

Chart on Value chain analysis

4. Market Sizing

4.1 Market definition

Data Table on Offerings of companies included in the market definition

4.2 Market segment analysis

Market segments

4.3 Market size 2024

4.4 Market outlook: Forecast for 2024-2029

Chart on Global - Market size and forecast 2024-2029 ($ million)
Data Table on Global - Market size and forecast 2024-2029 ($ million)
Chart on Global Market: Year-over-year growth 2024-2029 (%)
Data Table on Global Market: Year-over-year growth 2024-2029 (%)

5. Historic Market Size

5.1 Global AI Note Taking Market 2019 - 2023

Historic Market Size - Data Table on Global AI Note Taking Market 2019 - 2023 ($ million)

5.2 Component segment analysis 2019 - 2023

Historic Market Size - Component Segment 2019 - 2023 ($ million)

5.3 Application segment analysis 2019 - 2023

Historic Market Size - Application Segment 2019 - 2023 ($ million)

5.4 End-user segment analysis 2019 - 2023

Historic Market Size - End-user Segment 2019 - 2023 ($ million)

5.5 Geography segment analysis 2019 - 2023

Historic Market Size - Geography Segment 2019 - 2023 ($ million)

5.6 Country segment analysis 2019 - 2023

Historic Market Size - Country Segment 2019 - 2023 ($ million)

6. Five Forces Analysis

6.1 Five forces summary

Five forces analysis - Comparison between 2024 and 2029

6.2 Bargaining power of buyers

Bargaining power of buyers - Impact of key factors 2024 and 2029

6.3 Bargaining power of suppliers

Bargaining power of suppliers - Impact of key factors in 2024 and 2029

6.4 Threat of new entrants

Threat of new entrants - Impact of key factors in 2024 and 2029

6.5 Threat of substitutes

Threat of substitutes - Impact of key factors in 2024 and 2029

6.6 Threat of rivalry

Threat of rivalry - Impact of key factors in 2024 and 2029

6.7 Market condition

Chart on Market condition - Five forces 2024 and 2029

7. Market Segmentation by Component

7.1 Market segments

Chart on Component - Market share 2024-2029 (%)
Data Table on Component - Market share 2024-2029 (%)

7.2 Comparison by Component

Chart on Comparison by Component
Data Table on Comparison by Component

7.3 Software - Market size and forecast 2024-2029

Chart on Software - Market size and forecast 2024-2029 ($ million)
Data Table on Software - Market size and forecast 2024-2029 ($ million)
Chart on Software - Year-over-year growth 2024-2029 (%)
Data Table on Software - Year-over-year growth 2024-2029 (%)

7.4 Services - Market size and forecast 2024-2029

Chart on Services - Market size and forecast 2024-2029 ($ million)
Data Table on Services - Market size and forecast 2024-2029 ($ million)
Chart on Services - Year-over-year growth 2024-2029 (%)
Data Table on Services - Year-over-year growth 2024-2029 (%)

7.5 Market opportunity by Component

Market opportunity by Component ($ million)
Data Table on Market opportunity by Component ($ million)

8. Market Segmentation by Application

8.1 Market segments

Chart on Application - Market share 2024-2029 (%)
Data Table on Application - Market share 2024-2029 (%)

8.2 Comparison by Application

Chart on Comparison by Application
Data Table on Comparison by Application

8.3 Education - Market size and forecast 2024-2029

Chart on Education - Market size and forecast 2024-2029 ($ million)
Data Table on Education - Market size and forecast 2024-2029 ($ million)
Chart on Education - Year-over-year growth 2024-2029 (%)
Data Table on Education - Year-over-year growth 2024-2029 (%)

8.4 Corporate - Market size and forecast 2024-2029

Chart on Corporate - Market size and forecast 2024-2029 ($ million)
Data Table on Corporate - Market size and forecast 2024-2029 ($ million)
Chart on Corporate - Year-over-year growth 2024-2029 (%)
Data Table on Corporate - Year-over-year growth 2024-2029 (%)

8.5 Healthcare - Market size and forecast 2024-2029

Chart on Healthcare - Market size and forecast 2024-2029 ($ million)
Data Table on Healthcare - Market size and forecast 2024-2029 ($ million)
Chart on Healthcare - Year-over-year growth 2024-2029 (%)
Data Table on Healthcare - Year-over-year growth 2024-2029 (%)

8.6 Legal - Market size and forecast 2024-2029

Chart on Legal - Market size and forecast 2024-2029 ($ million)
Data Table on Legal - Market size and forecast 2024-2029 ($ million)
Chart on Legal - Year-over-year growth 2024-2029 (%)
Data Table on Legal - Year-over-year growth 2024-2029 (%)

8.7 Others - Market size and forecast 2024-2029

Chart on Others - Market size and forecast 2024-2029 ($ million)
Data Table on Others - Market size and forecast 2024-2029 ($ million)
Chart on Others - Year-over-year growth 2024-2029 (%)
Data Table on Others - Year-over-year growth 2024-2029 (%)

8.8 Market opportunity by Application

Market opportunity by Application ($ million)
Data Table on Market opportunity by Application ($ million)

9. Market Segmentation by End-user

9.1 Market segments

Chart on End-user - Market share 2024-2029 (%)
Data Table on End-user - Market share 2024-2029 (%)

9.2 Comparison by End-user

Chart on Comparison by End-user
Data Table on Comparison by End-user

9.3 Students - Market size and forecast 2024-2029

Chart on Students - Market size and forecast 2024-2029 ($ million)
Data Table on Students - Market size and forecast 2024-2029 ($ million)
Chart on Students - Year-over-year growth 2024-2029 (%)
Data Table on Students - Year-over-year growth 2024-2029 (%)

9.4 Educators - Market size and forecast 2024-2029

Chart on Educators - Market size and forecast 2024-2029 ($ million)
Data Table on Educators - Market size and forecast 2024-2029 ($ million)
Chart on Educators - Year-over-year growth 2024-2029 (%)
Data Table on Educators - Year-over-year growth 2024-2029 (%)

9.5 Professionals - Market size and forecast 2024-2029

Chart on Professionals - Market size and forecast 2024-2029 ($ million)
Data Table on Professionals - Market size and forecast 2024-2029 ($ million)
Chart on Professionals - Year-over-year growth 2024-2029 (%)
Data Table on Professionals - Year-over-year growth 2024-2029 (%)

9.6 Researchers - Market size and forecast 2024-2029

Chart on Researchers - Market size and forecast 2024-2029 ($ million)
Data Table on Researchers - Market size and forecast 2024-2029 ($ million)
Chart on Researchers - Year-over-year growth 2024-2029 (%)
Data Table on Researchers - Year-over-year growth 2024-2029 (%)

9.7 Others - Market size and forecast 2024-2029

Chart on Others - Market size and forecast 2024-2029 ($ million)
Data Table on Others - Market size and forecast 2024-2029 ($ million)
Chart on Others - Year-over-year growth 2024-2029 (%)
Data Table on Others - Year-over-year growth 2024-2029 (%)

9.8 Market opportunity by End-user

Market opportunity by End-user ($ million)
Data Table on Market opportunity by End-user ($ million)

10. Customer Landscape

10.1 Customer landscape overview

Analysis of price sensitivity, lifecycle, customer purchase basket, adoption rates, and purchase criteria

11. Geographic Landscape

11.1 Geographic segmentation

Chart on Market share by geography 2024-2029 (%)
Data Table on Market share by geography 2024-2029 (%)

11.2 Geographic comparison

Chart on Geographic comparison
Data Table on Geographic comparison

11.3 North America - Market size and forecast 2024-2029

Chart on North America - Market size and forecast 2024-2029 ($ million)
Data Table on North America - Market size and forecast 2024-2029 ($ million)
Chart on North America - Year-over-year growth 2024-2029 (%)
Data Table on North America - Year-over-year growth 2024-2029 (%)
Chart on Regional Comparison - North America
Data Table on Regional Comparison - North America

11.3.1 US - Market size and forecast 2024-2029

Chart on US - Market size and forecast 2024-2029 ($ million)
Data Table on US - Market size and forecast 2024-2029 ($ million)
Chart on US - Year-over-year growth 2024-2029 (%)
Data Table on US - Year-over-year growth 2024-2029 (%)

11.3.2 Canada - Market size and forecast 2024-2029

Chart on Canada - Market size and forecast 2024-2029 ($ million)
Data Table on Canada - Market size and forecast 2024-2029 ($ million)
Chart on Canada - Year-over-year growth 2024-2029 (%)
Data Table on Canada - Year-over-year growth 2024-2029 (%)

11.3.3 Mexico - Market size and forecast 2024-2029

Chart on Mexico - Market size and forecast 2024-2029 ($ million)
Data Table on Mexico - Market size and forecast 2024-2029 ($ million)
Chart on Mexico - Year-over-year growth 2024-2029 (%)
Data Table on Mexico - Year-over-year growth 2024-2029 (%)

11.4 APAC - Market size and forecast 2024-2029

Chart on APAC - Market size and forecast 2024-2029 ($ million)
Data Table on APAC - Market size and forecast 2024-2029 ($ million)
Chart on APAC - Year-over-year growth 2024-2029 (%)
Data Table on APAC - Year-over-year growth 2024-2029 (%)
Chart on Regional Comparison - APAC
Data Table on Regional Comparison - APAC

11.4.1 China - Market size and forecast 2024-2029

Chart on China - Market size and forecast 2024-2029 ($ million)
Data Table on China - Market size and forecast 2024-2029 ($ million)
Chart on China - Year-over-year growth 2024-2029 (%)
Data Table on China - Year-over-year growth 2024-2029 (%)

11.4.2 India - Market size and forecast 2024-2029

Chart on India - Market size and forecast 2024-2029 ($ million)
Data Table on India - Market size and forecast 2024-2029 ($ million)
Chart on India - Year-over-year growth 2024-2029 (%)
Data Table on India - Year-over-year growth 2024-2029 (%)

11.4.3 Japan - Market size and forecast 2024-2029

Chart on Japan - Market size and forecast 2024-2029 ($ million)
Data Table on Japan - Market size and forecast 2024-2029 ($ million)
Chart on Japan - Year-over-year growth 2024-2029 (%)
Data Table on Japan - Year-over-year growth 2024-2029 (%)

11.4.4 Australia - Market size and forecast 2024-2029

Chart on Australia - Market size and forecast 2024-2029 ($ million)
Data Table on Australia - Market size and forecast 2024-2029 ($ million)
Chart on Australia - Year-over-year growth 2024-2029 (%)
Data Table on Australia - Year-over-year growth 2024-2029 (%)

11.4.5 South Korea - Market size and forecast 2024-2029

Chart on South Korea - Market size and forecast 2024-2029 ($ million)
Data Table on South Korea - Market size and forecast 2024-2029 ($ million)
Chart on South Korea - Year-over-year growth 2024-2029 (%)
Data Table on South Korea - Year-over-year growth 2024-2029 (%)

11.4.6 Indonesia - Market size and forecast 2024-2029

Chart on Indonesia - Market size and forecast 2024-2029 ($ million)
Data Table on Indonesia - Market size and forecast 2024-2029 ($ million)
Chart on Indonesia - Year-over-year growth 2024-2029 (%)
Data Table on Indonesia - Year-over-year growth 2024-2029 (%)

11.5 Europe - Market size and forecast 2024-2029

Chart on Europe - Market size and forecast 2024-2029 ($ million)
Data Table on Europe - Market size and forecast 2024-2029 ($ million)
Chart on Europe - Year-over-year growth 2024-2029 (%)
Data Table on Europe - Year-over-year growth 2024-2029 (%)
Chart on Regional Comparison - Europe
Data Table on Regional Comparison - Europe

11.5.1 UK - Market size and forecast 2024-2029

Chart on UK - Market size and forecast 2024-2029 ($ million)
Data Table on UK - Market size and forecast 2024-2029 ($ million)
Chart on UK - Year-over-year growth 2024-2029 (%)
Data Table on UK - Year-over-year growth 2024-2029 (%)

11.5.2 Germany - Market size and forecast 2024-2029

Chart on Germany - Market size and forecast 2024-2029 ($ million)
Data Table on Germany - Market size and forecast 2024-2029 ($ million)
Chart on Germany - Year-over-year growth 2024-2029 (%)
Data Table on Germany - Year-over-year growth 2024-2029 (%)

11.5.3 France - Market size and forecast 2024-2029

Chart on France - Market size and forecast 2024-2029 ($ million)
Data Table on France - Market size and forecast 2024-2029 ($ million)
Chart on France - Year-over-year growth 2024-2029 (%)
Data Table on France - Year-over-year growth 2024-2029 (%)

11.5.4 Italy - Market size and forecast 2024-2029

Chart on Italy - Market size and forecast 2024-2029 ($ million)
Data Table on Italy - Market size and forecast 2024-2029 ($ million)
Chart on Italy - Year-over-year growth 2024-2029 (%)
Data Table on Italy - Year-over-year growth 2024-2029 (%)

11.5.5 Spain - Market size and forecast 2024-2029

Chart on Spain - Market size and forecast 2024-2029 ($ million)
Data Table on Spain - Market size and forecast 2024-2029 ($ million)
Chart on Spain - Year-over-year growth 2024-2029 (%)
Data Table on Spain - Year-over-year growth 2024-2029 (%)

11.5.6 The Netherlands - Market size and forecast 2024-2029

Chart on The Netherlands - Market size and forecast 2024-2029 ($ million)
Data Table on The Netherlands - Market size and forecast 2024-2029 ($ million)
Chart on The Netherlands - Year-over-year growth 2024-2029 (%)
Data Table on The Netherlands - Year-over-year growth 2024-2029 (%)

11.6 South America - Market size and forecast 2024-2029

Chart on South America - Market size and forecast 2024-2029 ($ million)
Data Table on South America - Market size and forecast 2024-2029 ($ million)
Chart on South America - Year-over-year growth 2024-2029 (%)
Data Table on South America - Year-over-year growth 2024-2029 (%)
Chart on Regional Comparison - South America
Data Table on Regional Comparison - South America

11.6.1 Brazil - Market size and forecast 2024-2029

Chart on Brazil - Market size and forecast 2024-2029 ($ million)
Data Table on Brazil - Market size and forecast 2024-2029 ($ million)
Chart on Brazil - Year-over-year growth 2024-2029 (%)
Data Table on Brazil - Year-over-year growth 2024-2029 (%)

11.6.2 Argentina - Market size and forecast 2024-2029

Chart on Argentina - Market size and forecast 2024-2029 ($ million)
Data Table on Argentina - Market size and forecast 2024-2029 ($ million)
Chart on Argentina - Year-over-year growth 2024-2029 (%)
Data Table on Argentina - Year-over-year growth 2024-2029 (%)

11.6.3 Colombia - Market size and forecast 2024-2029

Chart on Colombia - Market size and forecast 2024-2029 ($ million)
Data Table on Colombia - Market size and forecast 2024-2029 ($ million)
Chart on Colombia - Year-over-year growth 2024-2029 (%)
Data Table on Colombia - Year-over-year growth 2024-2029 (%)

11.7 Middle East and Africa - Market size and forecast 2024-2029

Chart on Middle East and Africa - Market size and forecast 2024-2029 ($ million)
Data Table on Middle East and Africa - Market size and forecast 2024-2029 ($ million)
Chart on Middle East and Africa - Year-over-year growth 2024-2029 (%)
Data Table on Middle East and Africa - Year-over-year growth 2024-2029 (%)
Chart on Regional Comparison - Middle East and Africa
Data Table on Regional Comparison - Middle East and Africa

11.7.1 Saudi Arabia - Market size and forecast 2024-2029

Chart on Saudi Arabia - Market size and forecast 2024-2029 ($ million)
Data Table on Saudi Arabia - Market size and forecast 2024-2029 ($ million)
Chart on Saudi Arabia - Year-over-year growth 2024-2029 (%)
Data Table on Saudi Arabia - Year-over-year growth 2024-2029 (%)

11.7.2 UAE - Market size and forecast 2024-2029

Chart on UAE - Market size and forecast 2024-2029 ($ million)
Data Table on UAE - Market size and forecast 2024-2029 ($ million)
Chart on UAE - Year-over-year growth 2024-2029 (%)
Data Table on UAE - Year-over-year growth 2024-2029 (%)

11.7.3 Israel - Market size and forecast 2024-2029

Chart on Israel - Market size and forecast 2024-2029 ($ million)
Data Table on Israel - Market size and forecast 2024-2029 ($ million)
Chart on Israel - Year-over-year growth 2024-2029 (%)
Data Table on Israel - Year-over-year growth 2024-2029 (%)

11.7.4 South Africa - Market size and forecast 2024-2029

Chart on South Africa - Market size and forecast 2024-2029 ($ million)
Data Table on South Africa - Market size and forecast 2024-2029 ($ million)
Chart on South Africa - Year-over-year growth 2024-2029 (%)
Data Table on South Africa - Year-over-year growth 2024-2029 (%)

11.7.5 Turkey - Market size and forecast 2024-2029

Chart on Turkey - Market size and forecast 2024-2029 ($ million)
Data Table on Turkey - Market size and forecast 2024-2029 ($ million)
Chart on Turkey - Year-over-year growth 2024-2029 (%)
Data Table on Turkey - Year-over-year growth 2024-2029 (%)

11.8 Market opportunity by geography

Market opportunity by geography ($ million)
Data Tables on Market opportunity by geography ($ million)

12. Drivers, Challenges, and Opportunity

12.1 Market drivers

Pervasive adoption of remote and hybrid work models
Rapid advancements in AI and natural language processing
Surging enterprise demand for productivity and data-driven insights

12.2 Market challenges

Data privacy and security concerns
Accuracy and reliability of AI transcription
Integration with existing enterprise ecosystems and high competition

12.3 Impact of drivers and challenges

Impact of drivers and challenges in 2024 and 2029

12.4 Market opportunities

Proliferation of remote and hybrid work models
Rapid advancements in AI technologies
Growing demand from key sectors such as healthcare and education

13. Competitive Landscape

13.1 Overview

13.2

Overview on criticality of inputs and factors of differentiation

13.3 Landscape disruption

Overview on factors of disruption

13.4 Industry risks

Impact of key risks on business

14. Competitive Analysis

14.1 Companies profiled

Companies covered

14.2 Company ranking index

14.3 Market positioning of companies

Matrix on companies position and classification

14.4 Albus Technologies Ltd.

Albus Technologies Ltd. - Overview
Albus Technologies Ltd. - Product / Service
Albus Technologies Ltd. - Key offerings
SWOT

14.5 Equalicert Inc.

Equalicert Inc. - Overview
Equalicert Inc. - Product / Service
Equalicert Inc. - Key offerings
SWOT

14.6 Fathom Video Inc.

Fathom Video Inc. - Overview
Fathom Video Inc. - Product / Service
Fathom Video Inc. - Key offerings
SWOT

14.7 Fellow Insights Inc.

Fellow Insights Inc. - Overview
Fellow Insights Inc. - Product / Service
Fellow Insights Inc. - Key offerings
SWOT

14.8 Fireflies.ai Corp.

Fireflies.ai Corp. - Overview
Fireflies.ai Corp. - Product / Service
Fireflies.ai Corp. - Key offerings
SWOT

14.9 Google LLC

Google LLC - Overview
Google LLC - Product / Service
Google LLC - Key offerings
SWOT

14.10 Granola Inc.

Granola Inc. - Overview
Granola Inc. - Product / Service
Granola Inc. - Key offerings
SWOT

14.11 Jamie

Jamie - Overview
Jamie - Product / Service
Jamie - Key offerings
SWOT

14.12 Krisp Technologies Inc.

Krisp Technologies Inc. - Overview
Krisp Technologies Inc. - Product / Service
Krisp Technologies Inc. - Key offerings
SWOT

14.13 Meetgeek.ai

Meetgeek.ai - Overview
Meetgeek.ai - Product / Service
Meetgeek.ai - Key offerings
SWOT

14.14 Microsoft Corp.

Microsoft Corp. - Overview
Microsoft Corp. - Business segments
Microsoft Corp. - Key news
Microsoft Corp. - Key offerings
Microsoft Corp. - Segment focus
SWOT

14.15 Notion Labs Inc.

Notion Labs Inc. - Overview
Notion Labs Inc. - Product / Service
Notion Labs Inc. - Key offerings
SWOT

14.16 Otter.ai Inc.

Otter.ai Inc. - Overview
Otter.ai Inc. - Product / Service
Otter.ai Inc. - Key offerings
SWOT

14.17 Reflect App LLC.

Reflect App LLC. - Overview
Reflect App LLC. - Product / Service
Reflect App LLC. - Key offerings
SWOT

14.18 Zoom Communications Inc.

Zoom Communications Inc. - Overview
Zoom Communications Inc. - Product / Service
Zoom Communications Inc. - Key offerings
SWOT

15. Appendix

15.1 Scope of the report

Market definition
Objectives
Notes and caveats

15.2 Inclusions and exclusions checklist

Inclusions checklist
Exclusions checklist

15.3 Currency conversion rates for US$

15.4 Research methodology

15.5 Data procurement

Information sources

15.6 Data validation

15.7 Validation techniques employed for market sizing

15.8 Data synthesis

15.9 360 degree market analysis

15.10 List of abbreviations

Research Methodology

Technavio presents a detailed picture of the market by way of study, synthesis, and summation of data from multiple sources. The analysts have presented the various facets of the market with a particular focus on identifying the key industry influencers. The data thus presented is comprehensive, reliable, and the result of extensive research, both primary and secondary.

INFORMATION SOURCES

Primary sources

  • Manufacturers and suppliers
  • Channel partners
  • Industry experts
  • Strategic decision makers

Secondary sources

  • Industry journals and periodicals
  • Government data
  • Financial reports of key industry players
  • Historical data
  • Press releases

DATA ANALYSIS

Data Synthesis

  • Collation of data
  • Estimation of key figures
  • Analysis of derived insights

Data Validation

  • Triangulation with data models
  • Reference against proprietary databases
  • Corroboration with industry experts

REPORT WRITING

Qualitative

  • Market drivers
  • Market challenges
  • Market trends
  • Five forces analysis

Quantitative

  • Market size and forecast
  • Market segmentation
  • Geographical insights
  • Competitive landscape

Interested in this report?

Get your sample now to see our research methodology and insights!

Download Now

Frequently Asked Questions

AI Note Taking market growth will increase by USD 821.0 million during 2025-2029 .

The AI Note Taking market is expected to grow at a CAGR of 21.3% during 2025-2029 .

AI Note Taking market is segmented by Component (Software, Services) Application (Education, Corporate, Healthcare, Legal, Others) End-user (Students, Educators, Professionals, Researchers, Others)

Albus Technologies Ltd., Equalicert Inc., Fathom Video Inc., Fellow Insights Inc., Fireflies.ai Corp., Google LLC, Granola Inc., IBM Corp., Jamie, Krisp Technologies Inc., Meetgeek.ai, Mem Labs Inc., Microsoft Corp., Notion Labs Inc., Otter.ai Inc., Reflect App LLC., Zoom Communications Inc. are a few of the key vendors in the AI Note Taking market.

North America will register the highest growth rate of 32% among the other regions. Therefore, the AI Note Taking market in North America is expected to garner significant business opportunities for the vendors during the forecast period.

US, Canada, Mexico, China, India, Japan, Australia, South Korea, Indonesia, UK, Germany, France, Italy, Spain, The Netherlands, Brazil, Argentina, Colombia, Saudi Arabia, UAE, Israel, South Africa, Turkey

  • Pervasive adoption of remote and hybrid work models is the driving factor this market.

The AI Note Taking market vendors should focus on grabbing business opportunities from the Component segment as it accounted for the largest market share in the base year.