Adaptive AI Market Analysis, Size, and Forecast 2026-2030: North America (US, Canada, and Mexico), APAC (China, Japan, and India), Europe (Germany, UK, and France), South America (Brazil and Argentina), Middle East and Africa (Saudi Arabia, UAE, and South Africa), and Rest of World (ROW)

Adaptive AI Market Analysis, Size, and Forecast 2026-2030:
North America (US, Canada, and Mexico), APAC (China, Japan, and India), Europe (Germany, UK, and France), South America (Brazil and Argentina), Middle East and Africa (Saudi Arabia, UAE, and South Africa), and Rest of World (ROW)

Published: Apr 2026 305 Pages SKU: IRTNTR80732

Market Overview at a Glance

$12.79 B
Market Opportunity
39.8%
CAGR 2025 - 2030
35.8%
North America Growth
$1.70 B
Solutions segment 2024

Adaptive AI Market Size 2026-2030

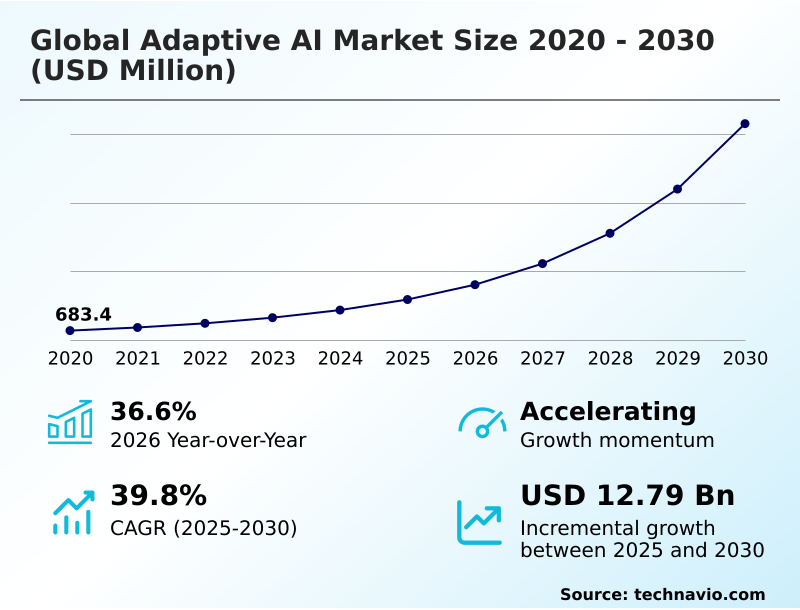
The adaptive ai market size is valued to increase by USD 12.79 billion, at a CAGR of 39.8% from 2025 to 2030. Critical requirement for real-time decision-making systems in volatile economic environments will drive the adaptive ai market.

Major Market Trends & Insights

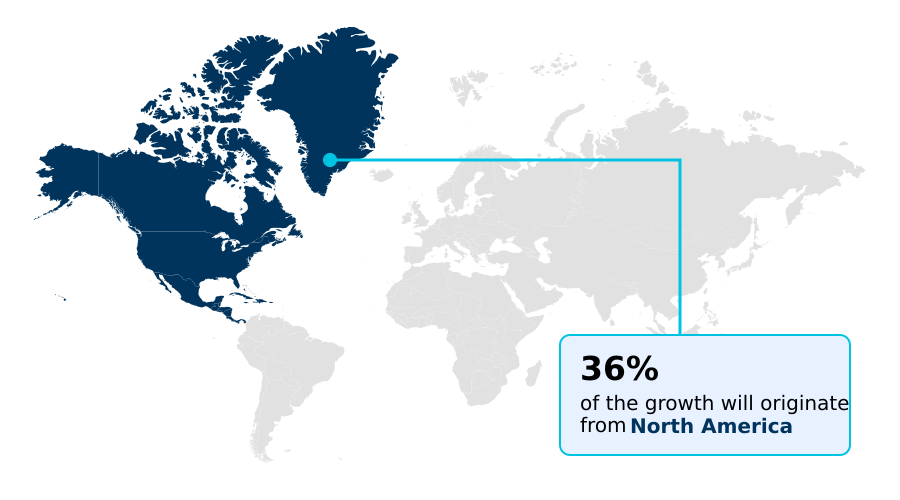
  • North America dominated the market and accounted for a 35.8% growth during the forecast period.
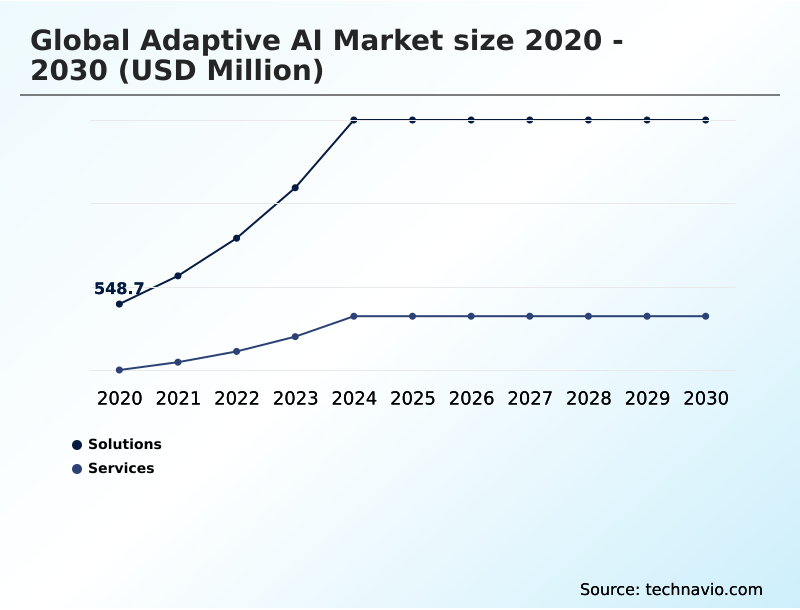
  • By Component - Solutions segment was valued at USD 1.70 billion in 2024
  • By Application - Machine learning segment accounted for the largest market revenue share in 2024

Market Size & Forecast

  • Market Opportunities: USD 15.05 billion
  • Market Future Opportunities: USD 12.79 billion
  • CAGR from 2025 to 2030 : 39.8%

Market Summary

  • The adaptive AI market is undergoing a profound transition from static, periodically trained models to dynamic systems capable of continuous learning. This evolution is driven by the critical need for real-time data processing in unpredictable environments, where the proliferation of IoT and edge devices generates unprecedented data volumes.
  • Key trends include the rise of agentic systems and autonomous decision engines that adjust their logic without human intervention, and a move toward AI sovereignty through decentralized and federated learning architectures. For instance, in supply chain management, an adaptive system can dynamically reroute shipments in response to unforeseen disruptions by processing live logistics data, a task impossible for traditional models.
  • However, this progress introduces significant challenges, including maintaining algorithmic transparency in self-modifying systems, ensuring data integrity against sophisticated poisoning attacks, and managing the high computational costs of perpetual training. These factors create a complex landscape where the pursuit of operational agility is balanced against the demands of governance, security, and sustainability.

What will be the Size of the Adaptive AI Market during the forecast period?

Get Key Insights on Market Forecast (PDF) Get Free Sample

How is the Adaptive AI Market Segmented?

The adaptive ai industry research report provides comprehensive data (region-wise segment analysis), with forecasts and estimates in "USD million" for the period 2026-2030, as well as historical data from 2020-2024 for the following segments.

  • Component
    • Solutions
    • Services
  • Application
    • Machine learning
    • Deep learning
    • NLP
    • Computer vision
    • Reinforcement learning
  • End-user
    • IT and telecom
    • BFSI
    • Healthcare
    • Retail and e-commerce
    • Manufacturing
  • Geography
    • North America
      • US
      • Canada
      • Mexico
    • APAC
      • China
      • Japan
      • India
    • Europe
      • Germany
      • UK
      • France
    • South America
      • Brazil
      • Argentina
    • Middle East and Africa
      • Saudi Arabia
      • UAE
      • South Africa
    • Rest of World (ROW)

By Component Insights

The solutions segment is estimated to witness significant growth during the forecast period.

Solutions within the adaptive AI market provide the technological foundation for creating resilient AI solutions capable of continuous model optimization.

These platforms enable automated model retraining through techniques like reinforcement learning and transfer learning, allowing autonomous systems to perform real-time data processing without manual redevelopment.

Core offerings integrate advanced frameworks for online learning and continual learning, which are critical for maintaining performance in dynamic environments.

By facilitating dynamic resource allocation and incorporating federated learning for privacy, these agentic systems can improve detection accuracy by over 99% in complex security applications.

This architecture combats model degradation, ensuring that deployed systems remain relevant and effective as operational conditions and data patterns evolve, a core value proposition for modern enterprises.

Get Free Sample

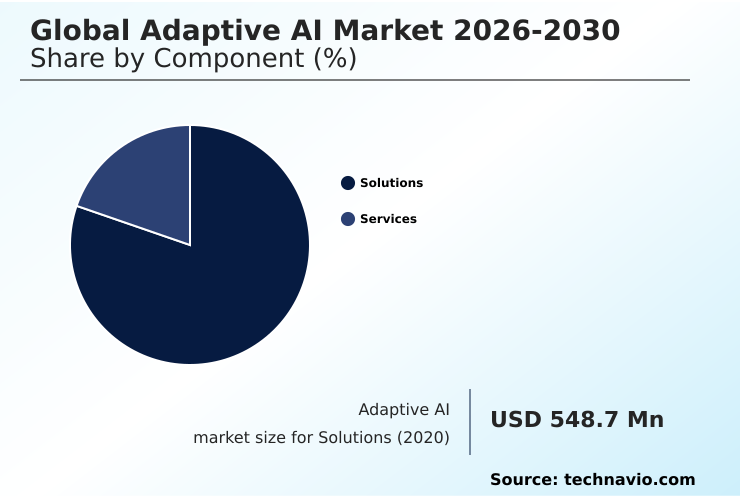
The Solutions segment was valued at USD 1.70 billion in 2024 and showed a gradual increase during the forecast period.

Get Free Sample

Regional Analysis

North America is estimated to contribute 35.8% to the growth of the global market during the forecast period.Technavio’s analysts have elaborately explained the regional trends and drivers that shape the market during the forecast period.

See How Adaptive AI Market Demand is Rising in North America Get Free Sample

The geographic landscape of the adaptive AI market is led by North America, which accounts for over 35% of the incremental growth, driven by its mature tech ecosystem and high adoption rates.

The region leverages intelligent automation and sophisticated MLOps pipelines to deploy high-dimensional models. Concurrently, APAC is the fastest-growing region, fueled by government-led AI sovereignty initiatives and the rapid digitalization of its economies.

In Europe, the focus is on AI model governance and decentralized learning to comply with stringent data privacy regulations. Across all regions, the expansion of edge computing intelligence and the need for robust semantic understanding models are universal drivers.

Adoption is underpinned by technologies delivering tangible results, such as adaptive fraud detection systems that improve accuracy to over 99% and automated data cleansing processes that enhance the reliability of real-time threat detection.

Market Dynamics

Our researchers analyzed the data with 2025 as the base year, along with the key drivers, trends, and challenges. A holistic analysis of drivers will help companies refine their marketing strategies to gain a competitive advantage.

  • The strategic adoption of adaptive AI is reshaping enterprise operations, moving beyond static models to embrace systems capable of continuous improvement. The use of reinforcement learning for dynamic pricing allows e-commerce platforms to adjust to market shifts in real time, optimizing revenue far more effectively than systems requiring manual updates.
  • In finance, real time model adaptation for fraud detection is critical for identifying and neutralizing novel threats as they emerge. Similarly, the successful implementation of agentic systems in enterprise resource planning hinges on their ability to learn and automate complex workflows. For industrial applications, the focus is on leveraging adaptive AI for predictive maintenance, which can significantly reduce unplanned downtime.
  • The deployment of continual learning to prevent model drift ensures that these systems maintain their accuracy over time. A core challenge is managing feedback loop corruption in AI, which requires robust validation. Furthermore, there's a push for explainable AI in autonomous decision engines to meet regulatory demands, particularly through algorithmic transparency for AI compliance.
  • As organizations explore meta-learning for self-optimizing networks, the ability to combat model collapse in adaptive systems becomes a crucial technical hurdle, differentiating leading solutions.

What are the key market drivers leading to the rise in the adoption of Adaptive AI Industry?

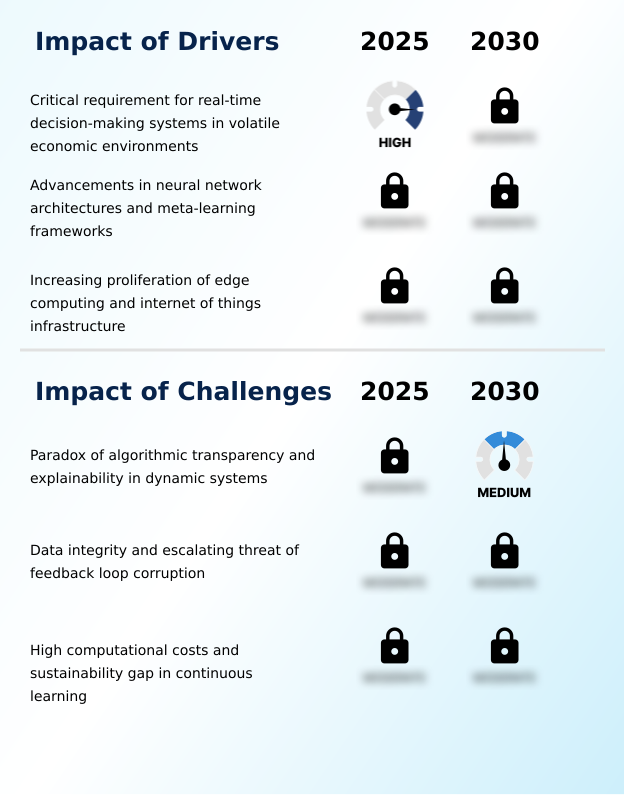
  • The critical requirement for real-time decision-making systems that can operate effectively in volatile economic environments is a key driver of market growth.

  • Market growth is fueled by the need for real-time adaptation in volatile environments. Innovations in self-optimizing neural networks and meta-learning are enabling dynamic reteaching, which significantly improves algorithmic efficiency and reduces the total cost of ownership.
  • This technological push allows for sophisticated contextual adaptation, where systems provide context-aware intelligence for multi-step workflow automation.
  • The proliferation of edge computing and IoT infrastructure is another major driver, creating demand for AI-powered security systems that can operate with low latency. These advancements are crucial for overcoming computational overhead and promoting green computing in AI.
  • However, the risk of feedback loop corruption requires heightened focus on explainable AI and algorithmic transparency to ensure systems remain reliable and auditable as they learn and evolve.

What are the market trends shaping the Adaptive AI Industry?

  • A key market trend is the integration of agentic systems, which are advancing beyond traditional automation. These systems feature autonomous decision engines capable of adjusting their logic to maintain peak performance without human intervention.

  • Key market trends are centered on enhancing system autonomy and resilience. The rise of autonomous decision engines is transforming industries by enabling real-time decision-making for latency-sensitive tasks without human intervention, which can improve fraud detection accuracy to over 99%. These systems are built on advanced neural network architectures designed to combat model drift and concept drift.
  • However, their complexity introduces challenges such as data poisoning and the risk of model collapse, where systems degrade after training on AI-generated data. Consequently, there is a strong emphasis on establishing robust AI governance frameworks and enhancing model observability to ensure ethical AI deployment and prevent catastrophic forgetting.
  • This focus on data integrity validation is critical for building trust in systems that operate autonomously.

What challenges does the Adaptive AI Industry face during its growth?

  • A key challenge affecting industry growth is the paradox of achieving algorithmic transparency and explainability within dynamic systems that continuously evolve their logic.

  • Primary market challenges stem from the operational complexity and risks of continuous learning systems. Ensuring algorithmic accountability for dynamic pricing algorithms and predictive maintenance models is a significant hurdle, as their logic evolves in response to non-stationary data.
  • The integrity of real-time feedback loops is constantly threatened by potential data corruption, which can lead to flawed optimizations in autonomous supply chains and intelligent industrial control. This makes dynamic risk assessment a critical but difficult function.
  • Furthermore, the high computational cost of running self-improving AI systems creates a sustainability gap, with total ownership costs sometimes triple that of static models. Organizations must balance the pursuit of hyper-personalization engines and dynamic workload scheduling with the need for transparent and financially viable AI strategies to build personalized customer experiences.

Exclusive Technavio Analysis on Customer Landscape

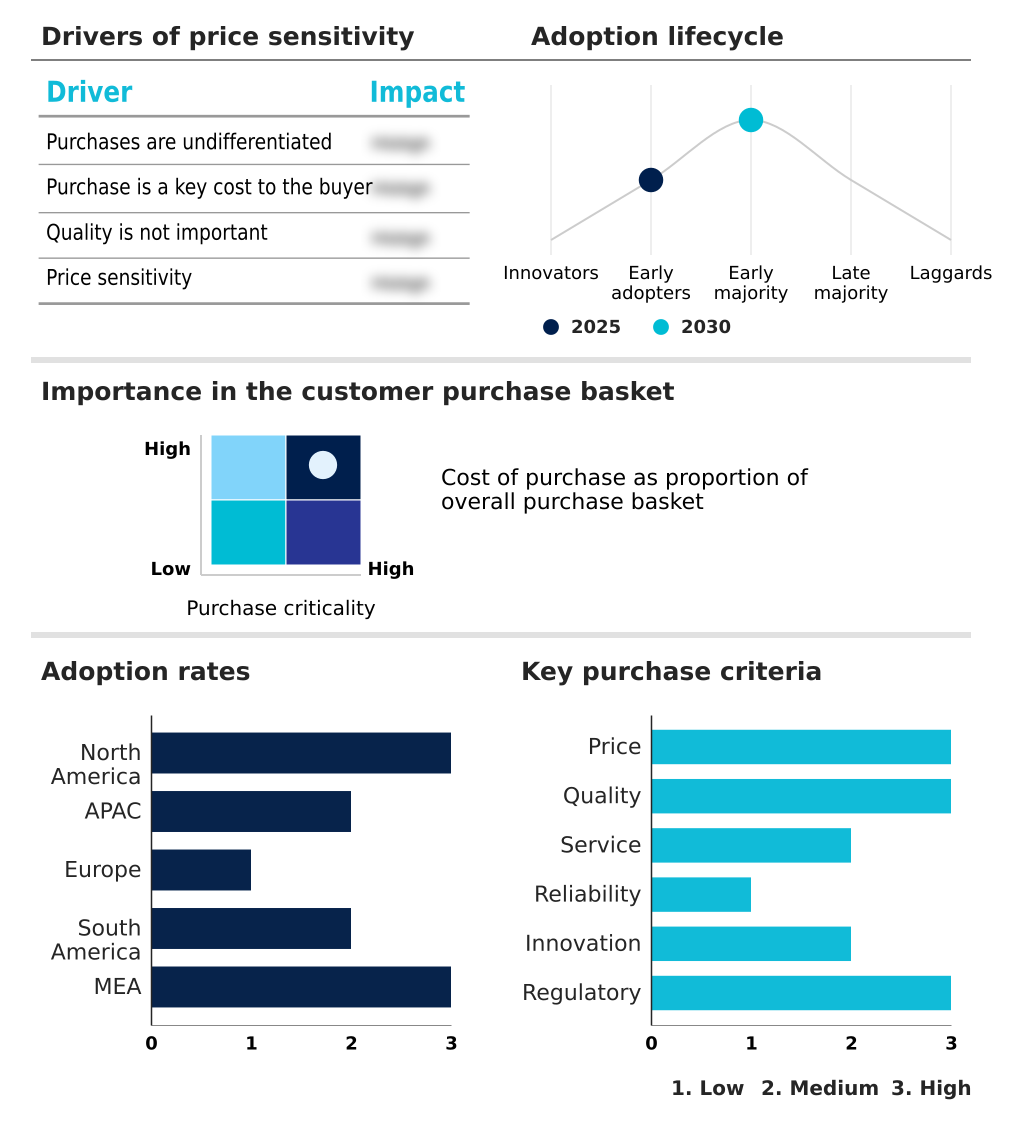
The adaptive ai market forecasting report includes the adoption lifecycle of the market, covering from the innovator’s stage to the laggard’s stage. It focuses on adoption rates in different regions based on penetration. Furthermore, the adaptive ai market report also includes key purchase criteria and drivers of price sensitivity to help companies evaluate and develop their market growth analysis strategies.

Customer Landscape of Adaptive AI Industry

Competitive Landscape

Companies are implementing various strategies, such as strategic alliances, adaptive ai market forecast, partnerships, mergers and acquisitions, geographical expansion, and product/service launches, to enhance their presence in the industry.

Alteryx Inc. - Offerings include adaptive AI platforms that enable continuous model optimization and automated workflows, facilitating real-time decision intelligence in dynamic enterprise environments.

The industry research and growth report includes detailed analyses of the competitive landscape of the market and information about key companies, including:

  • Alteryx Inc.
  • Amazon.com Inc.
  • ArthurAI Inc.
  • C3.ai Inc.
  • Clarifai Inc.
  • Databricks Inc.
  • Dataiku Inc.
  • DataRobot Inc.
  • Google LLC
  • IBM Corp.
  • Microsoft Corp.
  • NVIDIA Corp.
  • Palantir Technologies Inc.
  • SAS Institute Inc.
  • Scale AI
  • Seldon Technologies
  • Snowflake Inc.
  • SparkCognition Inc.
  • Symphony Innovation LLC
  • TIBCO Software Inc.

Qualitative and quantitative analysis of companies has been conducted to help clients understand the wider business environment as well as the strengths and weaknesses of key industry players. Data is qualitatively analyzed to categorize companies as pure play, category-focused, industry-focused, and diversified; it is quantitatively analyzed to categorize companies as dominant, leading, strong, tentative, and weak.

Recent Development and News in Adaptive ai market

  • In March, 2025, Microsoft Corp. formed a strategic alliance with Synertech to co-develop a new generation of adaptive AI platforms tailored for the manufacturing sector, aiming to create smart factories with autonomous optimization capabilities.
  • In August, 2025, a consortium of international healthcare organizations, in partnership with Google's AI division, launched the Global Health Sentinel Initiative, a decentralized adaptive AI platform for predictive modeling and real-time tracking of emerging infectious diseases.
  • In March, 2025, IBM Corp. announced a strategic collaboration with Palantir Technologies Inc. to integrate IBM's Watson AI capabilities with the Palantir Foundry platform, enabling enterprises to build and deploy adaptive AI applications.
  • In May, 2025, NVIDIA Corp. launched its NVIDIA Chiron platform, a full-stack software and hardware solution specifically engineered for developing and deploying real-time adaptive AI systems with tools for continuous learning and model adaptation.

Dive into Technavio’s robust research methodology, blending expert interviews, extensive data synthesis, and validated models for unparalleled Adaptive AI Market insights. See full methodology.

Market Scope
Page number 305
Base year 2025
Historic period 2020-2024
Forecast period 2026-2030
Growth momentum & CAGR Accelerate at a CAGR of 39.8%
Market growth 2026-2030 USD 12789.2 million
Market structure Fragmented
YoY growth 2025-2026(%) 36.6%
Key countries US, Canada, Mexico, China, Japan, India, South Korea, Australia, Indonesia, Germany, UK, France, Italy, Spain, The Netherlands, Brazil, Argentina, Chile, Saudi Arabia, UAE, South Africa, Israel and Turkey
Competitive landscape Leading Companies, Market Positioning of Companies, Competitive Strategies, and Industry Risks

Request Free Sample

Research Analyst Overview

  • The adaptive AI market is defined by a strategic shift from static intelligence to systems capable of dynamic reteaching and real-time adaptation. This evolution is driven by advancements in self-optimizing neural networks, which allow for contextual adaptation in response to non-stationary data.
  • A primary trend shaping boardroom strategy is the move toward AI sovereignty, compelling leaders to adopt decentralized learning and federated learning models to address data privacy regulations and ensure algorithmic accountability. This directly impacts budgeting for on-premise infrastructure and AI governance frameworks.
  • Organizations are leveraging these technologies to create self-healing software and hyper-personalization engines, achieving outcomes such as a 60% reduction in manual exception handling. The market's trajectory depends on overcoming challenges like feedback loop corruption and the complexity of MLOps pipelines for high-dimensional models, while advancing semantic understanding models and intelligent automation to deliver sustained value.
  • Real-time feedback loops and robust AI lifecycle management are essential for success.

What are the Key Data Covered in this Adaptive AI Market Research and Growth Report?

  • What is the expected growth of the Adaptive AI Market between 2026 and 2030?

    • USD 12.79 billion, at a CAGR of 39.8%

  • What segmentation does the market report cover?

    • The report is segmented by Component (Solutions, and Services), Application (Machine learning, Deep learning, NLP, Computer vision, and Reinforcement learning), End-user (IT and telecom, BFSI, Healthcare, Retail and e-commerce, and Manufacturing) and Geography (North America, APAC, Europe, South America, Middle East and Africa)

  • Which regions are analyzed in the report?

    • North America, APAC, Europe, South America and Middle East and Africa

  • What are the key growth drivers and market challenges?

    • Critical requirement for real-time decision-making systems in volatile economic environments, Paradox of algorithmic transparency and explainability in dynamic systems

  • Who are the major players in the Adaptive AI Market?

    • Alteryx Inc., Amazon.com Inc., ArthurAI Inc., C3.ai Inc., Clarifai Inc., Databricks Inc., Dataiku Inc., DataRobot Inc., Google LLC, IBM Corp., Microsoft Corp., NVIDIA Corp., Palantir Technologies Inc., SAS Institute Inc., Scale AI, Seldon Technologies, Snowflake Inc., SparkCognition Inc., Symphony Innovation LLC and TIBCO Software Inc.

Market Research Insights

  • The market dynamic is shifting toward self-improving AI systems that deliver tangible business outcomes. Organizations are adopting adaptive fraud detection architectures and real-time threat detection, which can improve accuracy by over 99%, a stark contrast to legacy systems.
  • This push for context-aware intelligence is also evident in enterprise resource planning, where the use of AI lifecycle management and multi-step workflow automation has been shown to reduce manual exception handling by 60%.
  • As businesses prioritize human-in-the-loop systems and automated data cleansing to enhance data integrity, the focus remains on deploying adaptive systems that provide a clear return on investment through heightened operational efficiency and improved dynamic risk assessment capabilities in volatile commercial landscapes.

We can help! Our analysts can customize this adaptive ai market research report to meet your requirements.

Get in touch

1. Executive Summary

1.1 Market overview

Executive Summary - Chart on Market Overview
Executive Summary - Data Table on Market Overview
Executive Summary - Chart on Global Market Characteristics
Executive Summary - Chart on Market by Geography
Executive Summary - Chart on Market Segmentation by Component
Executive Summary - Chart on Market Segmentation by Application
Executive Summary - Chart on Market Segmentation by End-user
Executive Summary - Chart on Incremental Growth
Executive Summary - Data Table on Incremental Growth
Executive Summary - Chart on Company Market Positioning

2. Technavio Analysis

2.1 Analysis of price sensitivity, lifecycle, customer purchase basket, adoption rates, and purchase criteria

2.2 Criticality of inputs and Factors of differentiation

Chart on Overview on criticality of inputs and factors of differentiation

2.3 Factors of disruption

Chart on Overview on factors of disruption

2.4 Impact of drivers and challenges

Chart on Impact of drivers and challenges in 2025 and 2030

3. Market Landscape

3.1 Market ecosystem

Chart on Parent Market
Data Table on - Parent Market

3.2 Market characteristics

Chart on Market characteristics analysis

3.3 Value chain analysis

Chart on Value chain analysis

4. Market Sizing

4.1 Market definition

Data Table on Offerings of companies included in the market definition

4.2 Market segment analysis

Market segments

4.3 Market size 2025

4.4 Market outlook: Forecast for 2025-2030

Chart on Global - Market size and forecast 2025-2030 ($ million)
Data Table on Global - Market size and forecast 2025-2030 ($ million)
Chart on Global Market: Year-over-year growth 2025-2030 (%)
Data Table on Global Market: Year-over-year growth 2025-2030 (%)

5. Historic Market Size

5.1 Global Adaptive AI Market 2020 - 2024

Historic Market Size - Data Table on Global Adaptive AI Market 2020 - 2024 ($ million)

5.2 Component segment analysis 2020 - 2024

Historic Market Size - Component Segment 2020 - 2024 ($ million)

5.3 Application segment analysis 2020 - 2024

Historic Market Size - Application Segment 2020 - 2024 ($ million)

5.4 End-user segment analysis 2020 - 2024

Historic Market Size - End-user Segment 2020 - 2024 ($ million)

5.5 Geography segment analysis 2020 - 2024

Historic Market Size - Geography Segment 2020 - 2024 ($ million)

5.6 Country segment analysis 2020 - 2024

Historic Market Size - Country Segment 2020 - 2024 ($ million)

6. Qualitative Analysis

6.1 Impact of geopolitical conflicts on global adaptive AI market

7. Five Forces Analysis

7.1 Five forces summary

Five forces analysis - Comparison between 2025 and 2030

7.2 Bargaining power of buyers

Bargaining power of buyers - Impact of key factors 2025 and 2030

7.3 Bargaining power of suppliers

Bargaining power of suppliers - Impact of key factors in 2025 and 2030

7.4 Threat of new entrants

Threat of new entrants - Impact of key factors in 2025 and 2030

7.5 Threat of substitutes

Threat of substitutes - Impact of key factors in 2025 and 2030

7.6 Threat of rivalry

Threat of rivalry - Impact of key factors in 2025 and 2030

7.7 Market condition

Chart on Market condition - Five forces 2025 and 2030

8. Market Segmentation by Component

8.1 Market segments

Chart on Component - Market share 2025-2030 (%)
Data Table on Component - Market share 2025-2030 (%)

8.2 Comparison by Component

Chart on Comparison by Component
Data Table on Comparison by Component

8.3 Solutions - Market size and forecast 2025-2030

Chart on Solutions - Market size and forecast 2025-2030 ($ million)
Data Table on Solutions - Market size and forecast 2025-2030 ($ million)
Chart on Solutions - Year-over-year growth 2025-2030 (%)
Data Table on Solutions - Year-over-year growth 2025-2030 (%)

8.4 Services - Market size and forecast 2025-2030

Chart on Services - Market size and forecast 2025-2030 ($ million)
Data Table on Services - Market size and forecast 2025-2030 ($ million)
Chart on Services - Year-over-year growth 2025-2030 (%)
Data Table on Services - Year-over-year growth 2025-2030 (%)

8.5 Market opportunity by Component

Market opportunity by Component ($ million)
Data Table on Market opportunity by Component ($ million)

9. Market Segmentation by Application

9.1 Market segments

Chart on Application - Market share 2025-2030 (%)
Data Table on Application - Market share 2025-2030 (%)

9.2 Comparison by Application

Chart on Comparison by Application
Data Table on Comparison by Application

9.3 Machine learning - Market size and forecast 2025-2030

Chart on Machine learning - Market size and forecast 2025-2030 ($ million)
Data Table on Machine learning - Market size and forecast 2025-2030 ($ million)
Chart on Machine learning - Year-over-year growth 2025-2030 (%)
Data Table on Machine learning - Year-over-year growth 2025-2030 (%)

9.4 Deep learning - Market size and forecast 2025-2030

Chart on Deep learning - Market size and forecast 2025-2030 ($ million)
Data Table on Deep learning - Market size and forecast 2025-2030 ($ million)
Chart on Deep learning - Year-over-year growth 2025-2030 (%)
Data Table on Deep learning - Year-over-year growth 2025-2030 (%)

9.5 NLP - Market size and forecast 2025-2030

Chart on NLP - Market size and forecast 2025-2030 ($ million)
Data Table on NLP - Market size and forecast 2025-2030 ($ million)
Chart on NLP - Year-over-year growth 2025-2030 (%)
Data Table on NLP - Year-over-year growth 2025-2030 (%)

9.6 Computer vision - Market size and forecast 2025-2030

Chart on Computer vision - Market size and forecast 2025-2030 ($ million)
Data Table on Computer vision - Market size and forecast 2025-2030 ($ million)
Chart on Computer vision - Year-over-year growth 2025-2030 (%)
Data Table on Computer vision - Year-over-year growth 2025-2030 (%)

9.7 Reinforcement learning - Market size and forecast 2025-2030

Chart on Reinforcement learning - Market size and forecast 2025-2030 ($ million)
Data Table on Reinforcement learning - Market size and forecast 2025-2030 ($ million)
Chart on Reinforcement learning - Year-over-year growth 2025-2030 (%)
Data Table on Reinforcement learning - Year-over-year growth 2025-2030 (%)

9.8 Market opportunity by Application

Market opportunity by Application ($ million)
Data Table on Market opportunity by Application ($ million)

10. Market Segmentation by End-user

10.1 Market segments

Chart on End-user - Market share 2025-2030 (%)
Data Table on End-user - Market share 2025-2030 (%)

10.2 Comparison by End-user

Chart on Comparison by End-user
Data Table on Comparison by End-user

10.3 IT and telecom - Market size and forecast 2025-2030

Chart on IT and telecom - Market size and forecast 2025-2030 ($ million)
Data Table on IT and telecom - Market size and forecast 2025-2030 ($ million)
Chart on IT and telecom - Year-over-year growth 2025-2030 (%)
Data Table on IT and telecom - Year-over-year growth 2025-2030 (%)

10.4 BFSI - Market size and forecast 2025-2030

Chart on BFSI - Market size and forecast 2025-2030 ($ million)
Data Table on BFSI - Market size and forecast 2025-2030 ($ million)
Chart on BFSI - Year-over-year growth 2025-2030 (%)
Data Table on BFSI - Year-over-year growth 2025-2030 (%)

10.5 Healthcare - Market size and forecast 2025-2030

Chart on Healthcare - Market size and forecast 2025-2030 ($ million)
Data Table on Healthcare - Market size and forecast 2025-2030 ($ million)
Chart on Healthcare - Year-over-year growth 2025-2030 (%)
Data Table on Healthcare - Year-over-year growth 2025-2030 (%)

10.6 Retail and e-commerce - Market size and forecast 2025-2030

Chart on Retail and e-commerce - Market size and forecast 2025-2030 ($ million)
Data Table on Retail and e-commerce - Market size and forecast 2025-2030 ($ million)
Chart on Retail and e-commerce - Year-over-year growth 2025-2030 (%)
Data Table on Retail and e-commerce - Year-over-year growth 2025-2030 (%)

10.7 Manufacturing - Market size and forecast 2025-2030

Chart on Manufacturing - Market size and forecast 2025-2030 ($ million)
Data Table on Manufacturing - Market size and forecast 2025-2030 ($ million)
Chart on Manufacturing - Year-over-year growth 2025-2030 (%)
Data Table on Manufacturing - Year-over-year growth 2025-2030 (%)

10.8 Market opportunity by End-user

Market opportunity by End-user ($ million)
Data Table on Market opportunity by End-user ($ million)

11. Customer Landscape

11.1 Customer landscape overview

Analysis of price sensitivity, lifecycle, customer purchase basket, adoption rates, and purchase criteria

12. Geographic Landscape

12.1 Geographic segmentation

Chart on Market share by geography 2025-2030 (%)
Data Table on Market share by geography 2025-2030 (%)

12.2 Geographic comparison

Chart on Geographic comparison
Data Table on Geographic comparison

12.3 North America - Market size and forecast 2025-2030

Chart on North America - Market size and forecast 2025-2030 ($ million)
Data Table on North America - Market size and forecast 2025-2030 ($ million)
Chart on North America - Year-over-year growth 2025-2030 (%)
Data Table on North America - Year-over-year growth 2025-2030 (%)
Chart on Regional Comparison - North America
Data Table on Regional Comparison - North America

12.3.1 US - Market size and forecast 2025-2030

Chart on US - Market size and forecast 2025-2030 ($ million)
Data Table on US - Market size and forecast 2025-2030 ($ million)
Chart on US - Year-over-year growth 2025-2030 (%)
Data Table on US - Year-over-year growth 2025-2030 (%)

12.3.2 Canada - Market size and forecast 2025-2030

Chart on Canada - Market size and forecast 2025-2030 ($ million)
Data Table on Canada - Market size and forecast 2025-2030 ($ million)
Chart on Canada - Year-over-year growth 2025-2030 (%)
Data Table on Canada - Year-over-year growth 2025-2030 (%)

12.3.3 Mexico - Market size and forecast 2025-2030

Chart on Mexico - Market size and forecast 2025-2030 ($ million)
Data Table on Mexico - Market size and forecast 2025-2030 ($ million)
Chart on Mexico - Year-over-year growth 2025-2030 (%)
Data Table on Mexico - Year-over-year growth 2025-2030 (%)

12.4 APAC - Market size and forecast 2025-2030

Chart on APAC - Market size and forecast 2025-2030 ($ million)
Data Table on APAC - Market size and forecast 2025-2030 ($ million)
Chart on APAC - Year-over-year growth 2025-2030 (%)
Data Table on APAC - Year-over-year growth 2025-2030 (%)
Chart on Regional Comparison - APAC
Data Table on Regional Comparison - APAC

12.4.1 China - Market size and forecast 2025-2030

Chart on China - Market size and forecast 2025-2030 ($ million)
Data Table on China - Market size and forecast 2025-2030 ($ million)
Chart on China - Year-over-year growth 2025-2030 (%)
Data Table on China - Year-over-year growth 2025-2030 (%)

12.4.2 Japan - Market size and forecast 2025-2030

Chart on Japan - Market size and forecast 2025-2030 ($ million)
Data Table on Japan - Market size and forecast 2025-2030 ($ million)
Chart on Japan - Year-over-year growth 2025-2030 (%)
Data Table on Japan - Year-over-year growth 2025-2030 (%)

12.4.3 India - Market size and forecast 2025-2030

Chart on India - Market size and forecast 2025-2030 ($ million)
Data Table on India - Market size and forecast 2025-2030 ($ million)
Chart on India - Year-over-year growth 2025-2030 (%)
Data Table on India - Year-over-year growth 2025-2030 (%)

12.4.4 South Korea - Market size and forecast 2025-2030

Chart on South Korea - Market size and forecast 2025-2030 ($ million)
Data Table on South Korea - Market size and forecast 2025-2030 ($ million)
Chart on South Korea - Year-over-year growth 2025-2030 (%)
Data Table on South Korea - Year-over-year growth 2025-2030 (%)

12.4.5 Australia - Market size and forecast 2025-2030

Chart on Australia - Market size and forecast 2025-2030 ($ million)
Data Table on Australia - Market size and forecast 2025-2030 ($ million)
Chart on Australia - Year-over-year growth 2025-2030 (%)
Data Table on Australia - Year-over-year growth 2025-2030 (%)

12.4.6 Indonesia - Market size and forecast 2025-2030

Chart on Indonesia - Market size and forecast 2025-2030 ($ million)
Data Table on Indonesia - Market size and forecast 2025-2030 ($ million)
Chart on Indonesia - Year-over-year growth 2025-2030 (%)
Data Table on Indonesia - Year-over-year growth 2025-2030 (%)

12.5 Europe - Market size and forecast 2025-2030

Chart on Europe - Market size and forecast 2025-2030 ($ million)
Data Table on Europe - Market size and forecast 2025-2030 ($ million)
Chart on Europe - Year-over-year growth 2025-2030 (%)
Data Table on Europe - Year-over-year growth 2025-2030 (%)
Chart on Regional Comparison - Europe
Data Table on Regional Comparison - Europe

12.5.1 Germany - Market size and forecast 2025-2030

Chart on Germany - Market size and forecast 2025-2030 ($ million)
Data Table on Germany - Market size and forecast 2025-2030 ($ million)
Chart on Germany - Year-over-year growth 2025-2030 (%)
Data Table on Germany - Year-over-year growth 2025-2030 (%)

12.5.2 UK - Market size and forecast 2025-2030

Chart on UK - Market size and forecast 2025-2030 ($ million)
Data Table on UK - Market size and forecast 2025-2030 ($ million)
Chart on UK - Year-over-year growth 2025-2030 (%)
Data Table on UK - Year-over-year growth 2025-2030 (%)

12.5.3 France - Market size and forecast 2025-2030

Chart on France - Market size and forecast 2025-2030 ($ million)
Data Table on France - Market size and forecast 2025-2030 ($ million)
Chart on France - Year-over-year growth 2025-2030 (%)
Data Table on France - Year-over-year growth 2025-2030 (%)

12.5.4 Italy - Market size and forecast 2025-2030

Chart on Italy - Market size and forecast 2025-2030 ($ million)
Data Table on Italy - Market size and forecast 2025-2030 ($ million)
Chart on Italy - Year-over-year growth 2025-2030 (%)
Data Table on Italy - Year-over-year growth 2025-2030 (%)

12.5.5 Spain - Market size and forecast 2025-2030

Chart on Spain - Market size and forecast 2025-2030 ($ million)
Data Table on Spain - Market size and forecast 2025-2030 ($ million)
Chart on Spain - Year-over-year growth 2025-2030 (%)
Data Table on Spain - Year-over-year growth 2025-2030 (%)

12.5.6 The Netherlands - Market size and forecast 2025-2030

Chart on The Netherlands - Market size and forecast 2025-2030 ($ million)
Data Table on The Netherlands - Market size and forecast 2025-2030 ($ million)
Chart on The Netherlands - Year-over-year growth 2025-2030 (%)
Data Table on The Netherlands - Year-over-year growth 2025-2030 (%)

12.6 South America - Market size and forecast 2025-2030

Chart on South America - Market size and forecast 2025-2030 ($ million)
Data Table on South America - Market size and forecast 2025-2030 ($ million)
Chart on South America - Year-over-year growth 2025-2030 (%)
Data Table on South America - Year-over-year growth 2025-2030 (%)
Chart on Regional Comparison - South America
Data Table on Regional Comparison - South America

12.6.1 Brazil - Market size and forecast 2025-2030

Chart on Brazil - Market size and forecast 2025-2030 ($ million)
Data Table on Brazil - Market size and forecast 2025-2030 ($ million)
Chart on Brazil - Year-over-year growth 2025-2030 (%)
Data Table on Brazil - Year-over-year growth 2025-2030 (%)

12.6.2 Argentina - Market size and forecast 2025-2030

Chart on Argentina - Market size and forecast 2025-2030 ($ million)
Data Table on Argentina - Market size and forecast 2025-2030 ($ million)
Chart on Argentina - Year-over-year growth 2025-2030 (%)
Data Table on Argentina - Year-over-year growth 2025-2030 (%)

12.6.3 Chile - Market size and forecast 2025-2030

Chart on Chile - Market size and forecast 2025-2030 ($ million)
Data Table on Chile - Market size and forecast 2025-2030 ($ million)
Chart on Chile - Year-over-year growth 2025-2030 (%)
Data Table on Chile - Year-over-year growth 2025-2030 (%)

12.7 Middle East and Africa - Market size and forecast 2025-2030

Chart on Middle East and Africa - Market size and forecast 2025-2030 ($ million)
Data Table on Middle East and Africa - Market size and forecast 2025-2030 ($ million)
Chart on Middle East and Africa - Year-over-year growth 2025-2030 (%)
Data Table on Middle East and Africa - Year-over-year growth 2025-2030 (%)
Chart on Regional Comparison - Middle East and Africa
Data Table on Regional Comparison - Middle East and Africa

12.7.1 Saudi Arabia - Market size and forecast 2025-2030

Chart on Saudi Arabia - Market size and forecast 2025-2030 ($ million)
Data Table on Saudi Arabia - Market size and forecast 2025-2030 ($ million)
Chart on Saudi Arabia - Year-over-year growth 2025-2030 (%)
Data Table on Saudi Arabia - Year-over-year growth 2025-2030 (%)

12.7.2 UAE - Market size and forecast 2025-2030

Chart on UAE - Market size and forecast 2025-2030 ($ million)
Data Table on UAE - Market size and forecast 2025-2030 ($ million)
Chart on UAE - Year-over-year growth 2025-2030 (%)
Data Table on UAE - Year-over-year growth 2025-2030 (%)

12.7.3 South Africa - Market size and forecast 2025-2030

Chart on South Africa - Market size and forecast 2025-2030 ($ million)
Data Table on South Africa - Market size and forecast 2025-2030 ($ million)
Chart on South Africa - Year-over-year growth 2025-2030 (%)
Data Table on South Africa - Year-over-year growth 2025-2030 (%)

12.7.4 Israel - Market size and forecast 2025-2030

Chart on Israel - Market size and forecast 2025-2030 ($ million)
Data Table on Israel - Market size and forecast 2025-2030 ($ million)
Chart on Israel - Year-over-year growth 2025-2030 (%)
Data Table on Israel - Year-over-year growth 2025-2030 (%)

12.7.5 Turkey - Market size and forecast 2025-2030

Chart on Turkey - Market size and forecast 2025-2030 ($ million)
Data Table on Turkey - Market size and forecast 2025-2030 ($ million)
Chart on Turkey - Year-over-year growth 2025-2030 (%)
Data Table on Turkey - Year-over-year growth 2025-2030 (%)

12.8 Market opportunity by geography

Market opportunity by geography ($ million)
Data Tables on Market opportunity by geography ($ million)

13. Drivers, Challenges, and Opportunity

13.1 Market drivers

Critical requirement for real-time decision-making systems in volatile economic environments
Advancements in neural network architectures and meta-learning frameworks
Increasing proliferation of edge computing and internet of things infrastructure

13.2 Market challenges

Paradox of algorithmic transparency and explainability in dynamic systems
Data integrity and escalating threat of feedback loop corruption
High computational costs and sustainability gap in continuous learning

13.3 Impact of drivers and challenges

Impact of drivers and challenges in 2025 and 2030

13.4 Market opportunities

Integration of agentic systems and autonomous decision engines
Expansion of real-time contextual adaptation in regulated sectors
Rise of AI sovereignty and decentralized learning architectures

14. Competitive Landscape

14.1 Overview

14.2

Overview on criticality of inputs and factors of differentiation

14.3 Landscape disruption

Overview on factors of disruption

14.4 Industry risks

Impact of key risks on business

15. Competitive Analysis

15.1 Companies profiled

Companies covered

15.2 Company ranking index

15.3 Market positioning of companies

Matrix on companies position and classification

15.4 Alteryx Inc.

Alteryx Inc. - Overview
Alteryx Inc. - Product / Service
Alteryx Inc. - Key offerings
SWOT

15.5 Amazon.com Inc.

Amazon.com Inc. - Overview
Amazon.com Inc. - Business segments
Amazon.com Inc. - Key news
Amazon.com Inc. - Key offerings
Amazon.com Inc. - Segment focus
SWOT

15.6 C3.ai Inc.

C3.ai Inc. - Overview
C3.ai Inc. - Product / Service
C3.ai Inc. - Key news
C3.ai Inc. - Key offerings
SWOT

15.7 Clarifai Inc.

Clarifai Inc. - Overview
Clarifai Inc. - Product / Service
Clarifai Inc. - Key offerings
SWOT

15.8 Databricks Inc.

Databricks Inc. - Overview
Databricks Inc. - Product / Service
Databricks Inc. - Key offerings
SWOT

15.9 Google LLC

Google LLC - Overview
Google LLC - Product / Service
Google LLC - Key offerings
SWOT

15.10 IBM Corp.

IBM Corp. - Overview
IBM Corp. - Business segments
IBM Corp. - Key news
IBM Corp. - Key offerings
IBM Corp. - Segment focus
SWOT

15.11 Microsoft Corp.

Microsoft Corp. - Overview
Microsoft Corp. - Business segments
Microsoft Corp. - Key news
Microsoft Corp. - Key offerings
Microsoft Corp. - Segment focus
SWOT

15.12 NVIDIA Corp.

NVIDIA Corp. - Overview
NVIDIA Corp. - Business segments
NVIDIA Corp. - Key news
NVIDIA Corp. - Key offerings
NVIDIA Corp. - Segment focus
SWOT

15.13 Palantir Technologies Inc.

Palantir Technologies Inc. - Overview
Palantir Technologies Inc. - Business segments
Palantir Technologies Inc. - Key offerings
Palantir Technologies Inc. - Segment focus
SWOT

15.14 SAS Institute Inc.

SAS Institute Inc. - Overview
SAS Institute Inc. - Product / Service
SAS Institute Inc. - Key offerings
SWOT

15.15 Snowflake Inc.

Snowflake Inc. - Overview
Snowflake Inc. - Business segments
Snowflake Inc. - Key news
Snowflake Inc. - Key offerings
Snowflake Inc. - Segment focus
SWOT

15.16 SparkCognition Inc.

SparkCognition Inc. - Overview
SparkCognition Inc. - Product / Service
SparkCognition Inc. - Key offerings
SWOT

15.17 Symphony Innovation LLC

Symphony Innovation LLC - Overview
Symphony Innovation LLC - Product / Service
Symphony Innovation LLC - Key offerings
SWOT

15.18 TIBCO Software Inc.

TIBCO Software Inc. - Overview
TIBCO Software Inc. - Product / Service
TIBCO Software Inc. - Key offerings
SWOT

16. Appendix

16.1 Scope of the report

Market definition
Objectives
Notes and caveats

16.2 Inclusions and exclusions checklist

Inclusions checklist
Exclusions checklist

16.3 Currency conversion rates for US$

16.4 Research methodology

16.5 Data procurement

Information sources

16.6 Data validation

16.7 Validation techniques employed for market sizing

16.8 Data synthesis

16.9 360 degree market analysis

16.10 List of abbreviations

Research Methodology

Technavio presents a detailed picture of the market by way of study, synthesis, and summation of data from multiple sources. The analysts have presented the various facets of the market with a particular focus on identifying the key industry influencers. The data thus presented is comprehensive, reliable, and the result of extensive research, both primary and secondary.

INFORMATION SOURCES

Primary sources

  • Manufacturers and suppliers
  • Channel partners
  • Industry experts
  • Strategic decision makers

Secondary sources

  • Industry journals and periodicals
  • Government data
  • Financial reports of key industry players
  • Historical data
  • Press releases

DATA ANALYSIS

Data Synthesis

  • Collation of data
  • Estimation of key figures
  • Analysis of derived insights

Data Validation

  • Triangulation with data models
  • Reference against proprietary databases
  • Corroboration with industry experts

REPORT WRITING

Qualitative

  • Market drivers
  • Market challenges
  • Market trends
  • Five forces analysis

Quantitative

  • Market size and forecast
  • Market segmentation
  • Geographical insights
  • Competitive landscape

Interested in this report?

Get your sample now to see our research methodology and insights!

Download Now

Frequently Asked Questions

Adaptive AI market growth will increase by USD 12789.2 million during 2026-2030.

The Adaptive AI market is expected to grow at a CAGR of 39.8% during 2026-2030.

Adaptive AI market is segmented by Component (Solutions, Services) Application (Machine learning, Deep learning, NLP, Computer vision, Reinforcement learning) End-user (IT and telecom, BFSI, Healthcare, Retail and e-commerce, Manufacturing)

Alteryx Inc., Amazon.com Inc., ArthurAI Inc., C3.ai Inc., Clarifai Inc., Databricks Inc., Dataiku Inc., DataRobot Inc., Google LLC, IBM Corp., Microsoft Corp., NVIDIA Corp., Palantir Technologies Inc., SAS Institute Inc., Scale AI, Seldon Technologies, Snowflake Inc., SparkCognition Inc., Symphony Innovation LLC, TIBCO Software Inc. are a few of the key vendors in the Adaptive AI market.

North America will register the highest growth rate of 35.8% among the other regions. Therefore, the Adaptive AI market in North America is expected to garner significant business opportunities for the vendors during the forecast period.

US, Canada, Mexico, China, Japan, India, South Korea, Australia, Indonesia, Germany, UK, France, Italy, Spain, The Netherlands, Brazil, Argentina, Chile, Saudi Arabia, UAE, South Africa, Israel, Turkey

  • Critical requirement for real-time decision-making systems in volatile economic environments is the driving factor this market.

The Adaptive AI market vendors should focus on grabbing business opportunities from the Component segment as it accounted for the largest market share in the base year.
RIA - Research AI Assistant
Ask RIA