AI Policy And Standards Market Analysis, Size, and Forecast 2026-2030: North America (US, Canada, and Mexico), Europe (Germany, France, and UK), APAC (China, India, and Japan), South America (Brazil and Argentina), Middle East and Africa (UAE, Saudi Arabia, and Israel), and Rest of World (ROW)

AI Policy And Standards Market Analysis, Size, and Forecast 2026-2030:
North America (US, Canada, and Mexico), Europe (Germany, France, and UK), APAC (China, India, and Japan), South America (Brazil and Argentina), Middle East and Africa (UAE, Saudi Arabia, and Israel), and Rest of World (ROW)

Published: Apr 2026 305 Pages SKU: IRTNTR80712

Market Overview at a Glance

$509.30 Mn
Market Opportunity
38.4%
CAGR 2025 - 2030
43.4%
North America Growth
$52.68 Mn
Solutions segment 2024

AI Policy And Standards Market Size 2026-2030

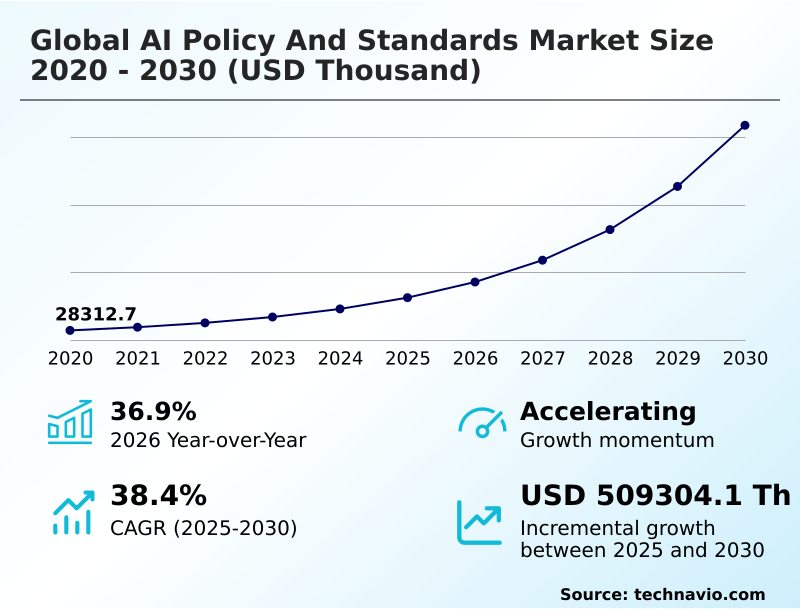
The ai policy and standards market size is valued to increase by USD 509.30 million, at a CAGR of 38.4% from 2025 to 2030. Strategic shift toward multilateral governance and transparency frameworks will drive the ai policy and standards market.

Major Market Trends & Insights

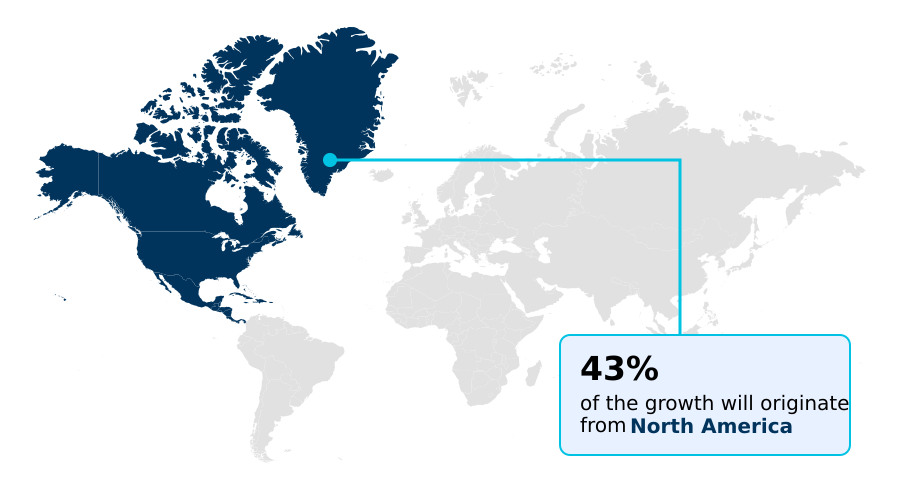
  • North America dominated the market and accounted for a 43.4% growth during the forecast period.
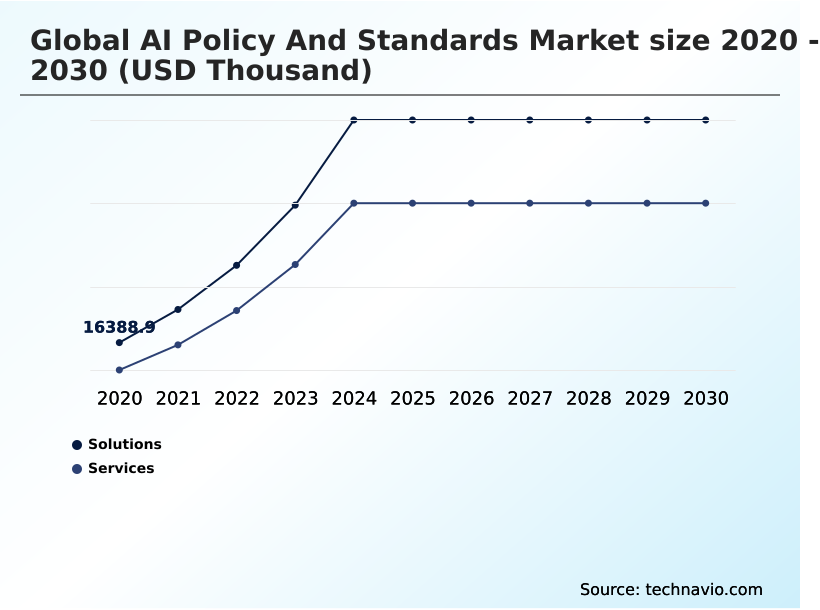
  • By Component - Solutions segment was valued at USD 52.68 million in 2024
  • By Application - Risk and compliance management segment accounted for the largest market revenue share in 2024

Market Size & Forecast

  • Market Opportunities:
  • Market Future Opportunities: USD 509.30 million
  • CAGR from 2025 to 2030 : 38.4%

Market Summary

  • The AI policy and standards market is undergoing rapid institutionalization as organizations shift from abstract ethical frameworks to enforceable regulatory regimes. This evolution is driven by the need to mitigate systemic risks associated with AI, such as algorithmic bias, while fostering industrial competitiveness.
  • The market for policy compliance solutions, standardized auditing, and governance platforms has expanded significantly as enterprises seek to align internal protocols with emerging legal mandates. For instance, a financial institution deploying an AI model for credit scoring must now implement robust model explainability techniques and continuous auditing to ensure fairness and prevent discriminatory outcomes, demonstrating compliance to regulators.
  • This transition is characterized by a move toward interoperability and trustworthy AI verification, where standards developed in one jurisdiction are increasingly harmonized with international benchmarks to facilitate cross-border digital trade.
  • The role of third-party conformity assessment bodies and policy advisory firms has become central to this ecosystem, providing the technical assurance required for high-risk AI applications and supporting sovereign AI development.

What will be the Size of the AI Policy And Standards Market during the forecast period?

Get Key Insights on Market Forecast (PDF) Get Free Sample

How is the AI Policy And Standards Market Segmented?

The ai policy and standards industry research report provides comprehensive data (region-wise segment analysis), with forecasts and estimates in "USD thousand" for the period 2026-2030, as well as historical data from 2020-2024 for the following segments.

  • Component
    • Solutions
    • Services
  • Application
    • Risk and compliance management
    • Bias detection and mitigation
    • Model explainability
    • Fairness and accountability tools
    • Others
  • Deployment
    • Cloud-based
    • On-premises
  • Geography
    • North America
      • US
      • Canada
      • Mexico
    • Europe
      • Germany
      • France
      • UK
    • APAC
      • China
      • India
      • Japan
    • South America
      • Brazil
      • Argentina
    • Middle East and Africa
      • UAE
      • Saudi Arabia
      • Israel
    • Rest of World (ROW)

By Component Insights

The solutions segment is estimated to witness significant growth during the forecast period.

The solutions segment is rapidly evolving from static oversight to integrated, automated governance platforms. These solutions, incorporating policy management engines and automated documentation generators, are critical for navigating complex global regulatory frameworks.

Demand is intensifying for modular software that can adapt to varying jurisdictional requirements, enabling enterprises to maintain a centralized AI asset repository while enforcing real-time guardrails.

By integrating advanced telemetry and reporting modules, these platforms ensure compliance is a continuous operational state, not a periodic audit.

This shift toward embedding policy enforcement agents directly into data management layers, which automates the capture of reasoning traces and decision models, reduces the manual burden of compliance by over 40%.

Key offerings include AI governance solutions, automated regtech solutions, and AI fairness metrics, which are crucial for algorithmic risk management and ensuring AI data sovereignty.

Get Free Sample

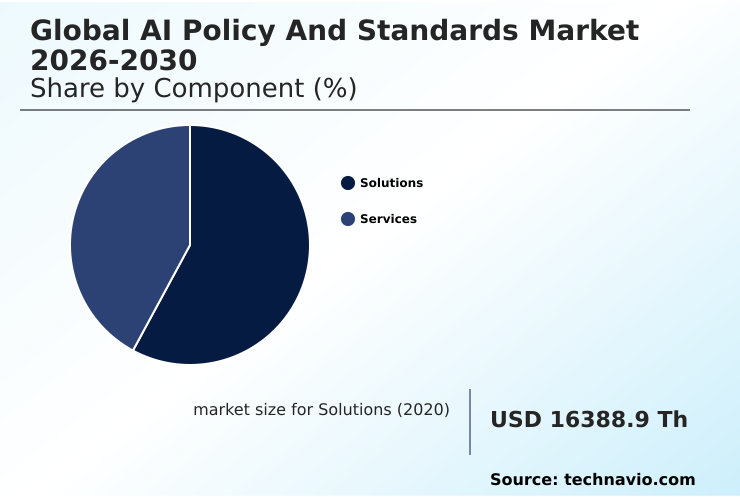
The Solutions segment was valued at USD 52.68 million in 2024 and showed a gradual increase during the forecast period.

Get Free Sample

Regional Analysis

North America is estimated to contribute 43.4% to the growth of the global market during the forecast period.Technavio’s analysts have elaborately explained the regional trends and drivers that shape the market during the forecast period.

See How AI Policy And Standards Market Demand is Rising in North America Get Free Sample

The geographic landscape of the AI policy and standards market is defined by distinct regional approaches to governance and innovation.

In North America, the market is driven by a focus on technical standards from bodies like NIST, with an emphasis on AI safety research and empirical safety benchmarks, leading to a 30% increase in adoption of standardized risk assessment tools.

Europe is pioneering enforceable regulatory mandates through its AI Act, creating a massive demand for AI regulatory technology and compliance software.

Meanwhile, the APAC region is characterized by a focus on sovereign AI development and national AI strategies, with some nations reporting a 20% faster deployment of public sector AI governance projects by using tailored AI procurement guidelines.

This regional divergence necessitates adaptable AI governance solutions and corporate AI ethics boards capable of navigating multiple legal frameworks, from AI content provenance rules in one region to AI intellectual property laws in another.

Market Dynamics

Our researchers analyzed the data with 2025 as the base year, along with the key drivers, trends, and challenges. A holistic analysis of drivers will help companies refine their marketing strategies to gain a competitive advantage.

  • The successful deployment of AI hinges on navigating a complex web of technical and ethical challenges, making specialized governance frameworks essential. For enterprises, implementing AI ethics principles in finance is no longer optional, as regulators demand transparency in algorithmic lending. This requires automated regulatory reporting for AI, which significantly reduces compliance costs compared to manual methods.
  • Furthermore, continuous auditing for machine learning models is becoming standard practice to prevent model drift and ensure fairness, particularly with bias detection in hiring algorithms. For high-stakes applications, such as explainable AI for credit scoring and human-in-the-loop for medical AI, ensuring accountability is paramount.
  • The rise of generative AI watermarking techniques and technical standards for AI content provenance addresses concerns around misinformation. As organizations adopt more complex systems, ethical considerations for multi-agent systems and managing AI data sovereignty rules are critical.
  • Developing AI literacy programs for employees and ensuring auditability by design in AI systems are foundational to building a culture of responsibility and trust across the entire AI lifecycle.

What are the key market drivers leading to the rise in the adoption of AI Policy And Standards Industry?

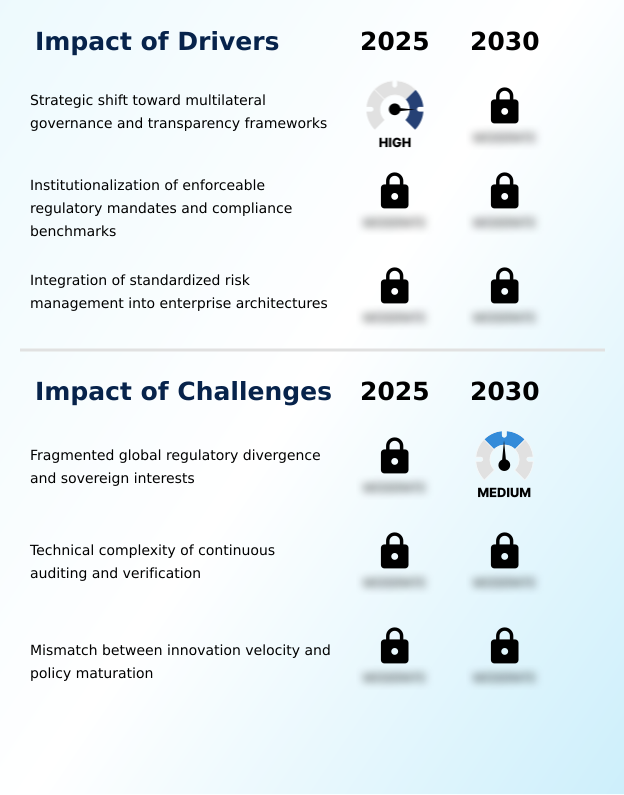
  • A key market driver is the strategic shift toward multilateral governance and transparency frameworks, fostering international accountability.

  • The market is propelled by the institutionalization of enforceable regulatory mandates, which necessitates rigorous, legally binding compliance programs and an AI legal framework.
  • The move beyond voluntary ethics to AI regulatory compliance automation has become a critical board-level priority, with organizations investing in governance stacks that offer audit-ready evidence.
  • This has resulted in a 50% increase in demand for specialized AI compliance software over the last year.
  • Another major driver is the integration of standardized risk management, with leading firms embedding international technical standards into their core architectures, promoting AI system robustness.
  • This convergence, where cloud providers offer policy-enforcement agents for real-time monitoring of model health and bias, has made high-level governance practices 60% more accessible for smaller organizations.
  • This driver is supported by the development of ethical AI toolkits, AI safety research, and robust accountability mechanisms.

What are the market trends shaping the AI Policy And Standards Industry?

  • The market is undergoing a significant transition from abstract principle-setting toward binding regulatory enforcement. This shift emphasizes practical implementation protocols and compliance by design.

  • A defining market trend is the decisive transition from abstract ethical principles to binding regulatory enforcement, making compliance by design a strategic imperative. This shift, which necessitates that organizations adopt AI systems risk classification and AI ethics committee oversight, is driving a surge in demand for automated regulatory technology.
  • Platforms providing AI model transparency and AI accountability framework solutions are becoming essential, with some users reporting a 30% reduction in time-to-compliance. The institutionalization of scientific oversight and empirical safety benchmarking is also gaining prominence, pushing the adoption of AI safety certification and generative AI policy.
  • Furthermore, the rapid adoption of standardized content provenance and technical labeling, supported by AI model monitoring, addresses misinformation challenges. This trend is fueling innovation in digital forensics and AI explainability solutions, solidifying their role as core components of a compliant product strategy.

What challenges does the AI Policy And Standards Industry face during its growth?

  • A key challenge affecting industry growth is the fragmented global regulatory landscape, marked by divergence and competing sovereign interests.

  • A primary challenge is the increasing divergence between sovereign regulatory frameworks, creating a fragmented compliance environment that complicates cross-border data flow policy. This patchwork of mandates, where a single AI model must satisfy multiple, sometimes conflicting, AI procurement guidelines, increases the cost of global operations by an estimated 25%.
  • Another obstacle is the technical complexity of continuous, industrial-scale auditing and verification of evolving machine learning models, as multi-modal and agentic systems often outpace the sophistication of current AI algorithm auditing tools. Finally, the mismatch between the velocity of AI innovation and the slow maturation of formal policy creates a reactive environment.
  • This pacing problem discourages long-term investment, as a sudden shift in regulatory requirements, driven by changing priorities in public sector AI governance, could render existing AI supply chain security protocols and architectures non-compliant.

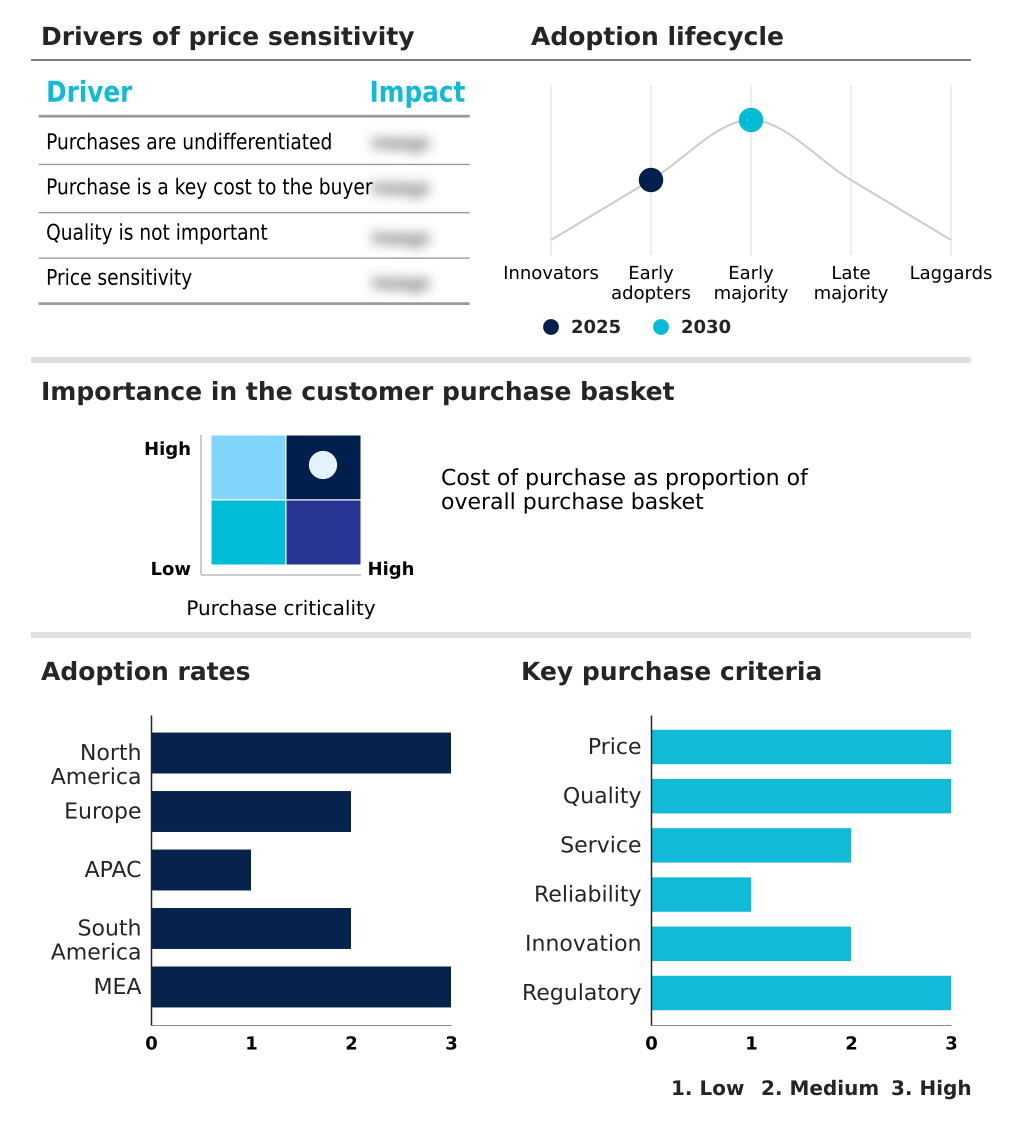
Exclusive Technavio Analysis on Customer Landscape

The ai policy and standards market forecasting report includes the adoption lifecycle of the market, covering from the innovator’s stage to the laggard’s stage. It focuses on adoption rates in different regions based on penetration. Furthermore, the ai policy and standards market report also includes key purchase criteria and drivers of price sensitivity to help companies evaluate and develop their market growth analysis strategies.

Customer Landscape of AI Policy And Standards Industry

Competitive Landscape

Companies are implementing various strategies, such as strategic alliances, ai policy and standards market forecast, partnerships, mergers and acquisitions, geographical expansion, and product/service launches, to enhance their presence in the industry.

Accenture Plc - Providing responsible AI frameworks to establish enterprise-wide governance principles, risk controls, and ethical AI policies for robust compliance and operational integrity.

The industry research and growth report includes detailed analyses of the competitive landscape of the market and information about key companies, including:

  • Accenture Plc
  • Amazon Web Services Inc.
  • Capgemini SE
  • Cognizant Technology Solution
  • Credo AI
  • Databricks Inc.
  • DataRobot Inc.
  • Deloitte Touche Tohmatsu Ltd.
  • Google LLC
  • HCL Technologies Ltd.
  • IBM Corp.
  • Infosys Ltd.
  • KPMG International Ltd.
  • Microsoft Corp.
  • Oracle Corp.
  • PricewaterhouseCoopers LLP
  • Salesforce Inc.
  • SAP SE
  • Tata Consultancy Services
  • Wipro Ltd.

Qualitative and quantitative analysis of companies has been conducted to help clients understand the wider business environment as well as the strengths and weaknesses of key industry players. Data is qualitatively analyzed to categorize companies as pure play, category-focused, industry-focused, and diversified; it is quantitatively analyzed to categorize companies as dominant, leading, strong, tentative, and weak.

Recent Development and News in Ai policy and standards market

  • In May, 2025, Amazon Web Services partnered with HUMAIN to invest over USD 5 billion in a new AI Zone in Saudi Arabia, including a commitment to train over one hundred thousand citizens in cloud computing and generative AI certifications.
  • In April, 2025, Google Cloud collaborated with Singapore's Infocomm Media Development Authority (IMDA) to pilot the refreshed AI Verify framework, helping set a blueprint for national policy influence on the delivery of secure cloud-based intelligence services.
  • In March, 2025, Microsoft integrated updated ISO and IEC technical specifications into its Azure AI platform, providing enterprise customers with standardized templates for life-cycle assessments of generative models and enabling automated compliance reporting.
  • In February, 2025, Accenture launched a comprehensive suite of cognitive governance tools designed to align enterprise autonomous agents with emerging international frameworks, moving toward continuous and automated policy enforcement.

Dive into Technavio’s robust research methodology, blending expert interviews, extensive data synthesis, and validated models for unparalleled AI Policy And Standards Market insights. See full methodology.

Market Scope
Page number 305
Base year 2025
Historic period 2020-2024
Forecast period 2026-2030
Growth momentum & CAGR Accelerate at a CAGR of 38.4%
Market growth 2026-2030 USD 509304.1 thousand
Market structure Fragmented
YoY growth 2025-2026(%) 36.9%
Key countries US, Canada, Mexico, Germany, France, UK, The Netherlands, Italy, Spain, China, India, Japan, South Korea, Singapore, Australia, Brazil, Argentina, Chile, UAE, Saudi Arabia, Israel, Egypt and South Africa
Competitive landscape Leading Companies, Market Positioning of Companies, Competitive Strategies, and Industry Risks

Request Free Sample

Research Analyst Overview

  • The AI policy and standards market is rapidly maturing, moving from high-level ethical discussions to the operational reality of industrial-scale compliance. This institutionalization is driven by the critical need for a responsible AI framework and robust AI ethics principles to govern increasingly autonomous systems.
  • For the boardroom, the key decision is no longer *if* but *how* to implement AI lifecycle governance, as failure to adopt enforceable regulatory mandates can result in significant penalties. Companies integrating AI governance solutions are seeing a 35% reduction in compliance-related incidents.
  • The landscape is defined by a push for auditability by design and accountability mechanisms, supported by model explainability techniques and algorithmic bias detection. This requires sophisticated AI impact assessment tools and transparent accountability frameworks. The emphasis on AI fairness metrics and transparency reporting standards, alongside continuous model auditing and generative model evaluation, underscores the technical depth now required.
  • This shift necessitates human-in-the-loop oversight and creates a market for trustworthy AI verification and ethical AI toolkits to ensure large language model integrity and manage algorithmic risk.

What are the Key Data Covered in this AI Policy And Standards Market Research and Growth Report?

  • What is the expected growth of the AI Policy And Standards Market between 2026 and 2030?

    • USD 509.30 million, at a CAGR of 38.4%

  • What segmentation does the market report cover?

    • The report is segmented by Component (Solutions, and Services), Application (Risk and compliance management, Bias detection and mitigation, Model explainability, Fairness and accountability tools, and Others), Deployment (Cloud-based, and On-premises) and Geography (North America, Europe, APAC, South America, Middle East and Africa)

  • Which regions are analyzed in the report?

    • North America, Europe, APAC, South America and Middle East and Africa

  • What are the key growth drivers and market challenges?

    • Strategic shift toward multilateral governance and transparency frameworks, Fragmented global regulatory divergence and sovereign interests

  • Who are the major players in the AI Policy And Standards Market?

    • Accenture Plc, Amazon Web Services Inc., Capgemini SE, Cognizant Technology Solution, Credo AI, Databricks Inc., DataRobot Inc., Deloitte Touche Tohmatsu Ltd., Google LLC, HCL Technologies Ltd., IBM Corp., Infosys Ltd., KPMG International Ltd., Microsoft Corp., Oracle Corp., PricewaterhouseCoopers LLP, Salesforce Inc., SAP SE, Tata Consultancy Services and Wipro Ltd.

Market Research Insights

  • The market dynamics are defined by a shift from voluntary guidelines to mandatory AI regulatory compliance, compelling organizations to adopt sophisticated governance frameworks. Firms leveraging AI governance platforms report a 40% improvement in audit preparedness compared to those with manual processes.
  • The adoption of AI explainability solutions is also critical, with early adopters seeing a 25% reduction in model validation disputes. This environment fosters a demand for specialized expertise, with a notable increase in the hiring of responsible AI officers.
  • The focus on an AI code of conduct and AI algorithm auditing is not just a compliance checkbox but a strategic imperative, driving the market for AI risk mitigation strategies and AI policy implementation services that ensure systems are robust and trustworthy.

We can help! Our analysts can customize this ai policy and standards market research report to meet your requirements.

Get in touch

1. Executive Summary

1.1 Market overview

Executive Summary - Chart on Market Overview
Executive Summary - Data Table on Market Overview
Executive Summary - Chart on Global Market Characteristics
Executive Summary - Chart on Market by Geography
Executive Summary - Chart on Market Segmentation by Component
Executive Summary - Chart on Market Segmentation by Application
Executive Summary - Chart on Market Segmentation by Deployment
Executive Summary - Chart on Incremental Growth
Executive Summary - Data Table on Incremental Growth
Executive Summary - Chart on Company Market Positioning

2. Technavio Analysis

2.1 Analysis of price sensitivity, lifecycle, customer purchase basket, adoption rates, and purchase criteria

2.2 Criticality of inputs and Factors of differentiation

Chart on Overview on criticality of inputs and factors of differentiation

2.3 Factors of disruption

Chart on Overview on factors of disruption

2.4 Impact of drivers and challenges

Chart on Impact of drivers and challenges in 2025 and 2030

3. Market Landscape

3.1 Market ecosystem

Chart on Parent Market
Data Table on - Parent Market

3.2 Market characteristics

Chart on Market characteristics analysis

3.3 Value chain analysis

Chart on Value chain analysis

4. Market Sizing

4.1 Market definition

Data Table on Offerings of companies included in the market definition

4.2 Market segment analysis

Market segments

4.3 Market size 2025

4.4 Market outlook: Forecast for 2025-2030

Chart on Global - Market size and forecast 2025-2030 ($ thousand)
Data Table on Global - Market size and forecast 2025-2030 ($ thousand)
Chart on Global Market: Year-over-year growth 2025-2030 (%)
Data Table on Global Market: Year-over-year growth 2025-2030 (%)

5. Historic Market Size

5.1 Global AI Policy And Standards Market 2020 - 2024

Historic Market Size - Data Table on Global AI Policy And Standards Market 2020 - 2024 ($ thousand)

5.2 Component segment analysis 2020 - 2024

Historic Market Size - Component Segment 2020 - 2024 ($ thousand)

5.3 Application segment analysis 2020 - 2024

Historic Market Size - Application Segment 2020 - 2024 ($ thousand)

5.4 Deployment segment analysis 2020 - 2024

Historic Market Size - Deployment Segment 2020 - 2024 ($ thousand)

5.5 Geography segment analysis 2020 - 2024

Historic Market Size - Geography Segment 2020 - 2024 ($ thousand)

5.6 Country segment analysis 2020 - 2024

Historic Market Size - Country Segment 2020 - 2024 ($ thousand)

6. Qualitative Analysis

6.1 Impact of geopolitical conflict on Global AI Policy and Standards Market

7. Five Forces Analysis

7.1 Five forces summary

Five forces analysis - Comparison between 2025 and 2030

7.2 Bargaining power of buyers

Bargaining power of buyers - Impact of key factors 2025 and 2030

7.3 Bargaining power of suppliers

Bargaining power of suppliers - Impact of key factors in 2025 and 2030

7.4 Threat of new entrants

Threat of new entrants - Impact of key factors in 2025 and 2030

7.5 Threat of substitutes

Threat of substitutes - Impact of key factors in 2025 and 2030

7.6 Threat of rivalry

Threat of rivalry - Impact of key factors in 2025 and 2030

7.7 Market condition

Chart on Market condition - Five forces 2025 and 2030

8. Market Segmentation by Component

8.1 Market segments

Chart on Component - Market share 2025-2030 (%)
Data Table on Component - Market share 2025-2030 (%)

8.2 Comparison by Component

Chart on Comparison by Component
Data Table on Comparison by Component

8.3 Solutions - Market size and forecast 2025-2030

Chart on Solutions - Market size and forecast 2025-2030 ($ thousand)
Data Table on Solutions - Market size and forecast 2025-2030 ($ thousand)
Chart on Solutions - Year-over-year growth 2025-2030 (%)
Data Table on Solutions - Year-over-year growth 2025-2030 (%)

8.4 Services - Market size and forecast 2025-2030

Chart on Services - Market size and forecast 2025-2030 ($ thousand)
Data Table on Services - Market size and forecast 2025-2030 ($ thousand)
Chart on Services - Year-over-year growth 2025-2030 (%)
Data Table on Services - Year-over-year growth 2025-2030 (%)

8.5 Market opportunity by Component

Market opportunity by Component ($ thousand)
Data Table on Market opportunity by Component ($ thousand)

9. Market Segmentation by Application

9.1 Market segments

Chart on Application - Market share 2025-2030 (%)
Data Table on Application - Market share 2025-2030 (%)

9.2 Comparison by Application

Chart on Comparison by Application
Data Table on Comparison by Application

9.3 Risk and compliance management - Market size and forecast 2025-2030

Chart on Risk and compliance management - Market size and forecast 2025-2030 ($ thousand)
Data Table on Risk and compliance management - Market size and forecast 2025-2030 ($ thousand)
Chart on Risk and compliance management - Year-over-year growth 2025-2030 (%)
Data Table on Risk and compliance management - Year-over-year growth 2025-2030 (%)

9.4 Bias detection and mitigation - Market size and forecast 2025-2030

Chart on Bias detection and mitigation - Market size and forecast 2025-2030 ($ thousand)
Data Table on Bias detection and mitigation - Market size and forecast 2025-2030 ($ thousand)
Chart on Bias detection and mitigation - Year-over-year growth 2025-2030 (%)
Data Table on Bias detection and mitigation - Year-over-year growth 2025-2030 (%)

9.5 Model explainability - Market size and forecast 2025-2030

Chart on Model explainability - Market size and forecast 2025-2030 ($ thousand)
Data Table on Model explainability - Market size and forecast 2025-2030 ($ thousand)
Chart on Model explainability - Year-over-year growth 2025-2030 (%)
Data Table on Model explainability - Year-over-year growth 2025-2030 (%)

9.6 Fairness and accountability tools - Market size and forecast 2025-2030

Chart on Fairness and accountability tools - Market size and forecast 2025-2030 ($ thousand)
Data Table on Fairness and accountability tools - Market size and forecast 2025-2030 ($ thousand)
Chart on Fairness and accountability tools - Year-over-year growth 2025-2030 (%)
Data Table on Fairness and accountability tools - Year-over-year growth 2025-2030 (%)

9.7 Others - Market size and forecast 2025-2030

Chart on Others - Market size and forecast 2025-2030 ($ thousand)
Data Table on Others - Market size and forecast 2025-2030 ($ thousand)
Chart on Others - Year-over-year growth 2025-2030 (%)
Data Table on Others - Year-over-year growth 2025-2030 (%)

9.8 Market opportunity by Application

Market opportunity by Application ($ thousand)
Data Table on Market opportunity by Application ($ thousand)

10. Market Segmentation by Deployment

10.1 Market segments

Chart on Deployment - Market share 2025-2030 (%)
Data Table on Deployment - Market share 2025-2030 (%)

10.2 Comparison by Deployment

Chart on Comparison by Deployment
Data Table on Comparison by Deployment

10.3 Cloud-based - Market size and forecast 2025-2030

Chart on Cloud-based - Market size and forecast 2025-2030 ($ thousand)
Data Table on Cloud-based - Market size and forecast 2025-2030 ($ thousand)
Chart on Cloud-based - Year-over-year growth 2025-2030 (%)
Data Table on Cloud-based - Year-over-year growth 2025-2030 (%)

10.4 On-premises - Market size and forecast 2025-2030

Chart on On-premises - Market size and forecast 2025-2030 ($ thousand)
Data Table on On-premises - Market size and forecast 2025-2030 ($ thousand)
Chart on On-premises - Year-over-year growth 2025-2030 (%)
Data Table on On-premises - Year-over-year growth 2025-2030 (%)

10.5 Market opportunity by Deployment

Market opportunity by Deployment ($ thousand)
Data Table on Market opportunity by Deployment ($ thousand)

11. Customer Landscape

11.1 Customer landscape overview

Analysis of price sensitivity, lifecycle, customer purchase basket, adoption rates, and purchase criteria

12. Geographic Landscape

12.1 Geographic segmentation

Chart on Market share by geography 2025-2030 (%)
Data Table on Market share by geography 2025-2030 (%)

12.2 Geographic comparison

Chart on Geographic comparison
Data Table on Geographic comparison

12.3 North America - Market size and forecast 2025-2030

Chart on North America - Market size and forecast 2025-2030 ($ thousand)
Data Table on North America - Market size and forecast 2025-2030 ($ thousand)
Chart on North America - Year-over-year growth 2025-2030 (%)
Data Table on North America - Year-over-year growth 2025-2030 (%)
Chart on Regional Comparison - North America
Data Table on Regional Comparison - North America

12.3.1 US - Market size and forecast 2025-2030

Chart on US - Market size and forecast 2025-2030 ($ thousand)
Data Table on US - Market size and forecast 2025-2030 ($ thousand)
Chart on US - Year-over-year growth 2025-2030 (%)
Data Table on US - Year-over-year growth 2025-2030 (%)

12.3.2 Canada - Market size and forecast 2025-2030

Chart on Canada - Market size and forecast 2025-2030 ($ thousand)
Data Table on Canada - Market size and forecast 2025-2030 ($ thousand)
Chart on Canada - Year-over-year growth 2025-2030 (%)
Data Table on Canada - Year-over-year growth 2025-2030 (%)

12.3.3 Mexico - Market size and forecast 2025-2030

Chart on Mexico - Market size and forecast 2025-2030 ($ thousand)
Data Table on Mexico - Market size and forecast 2025-2030 ($ thousand)
Chart on Mexico - Year-over-year growth 2025-2030 (%)
Data Table on Mexico - Year-over-year growth 2025-2030 (%)

12.4 Europe - Market size and forecast 2025-2030

Chart on Europe - Market size and forecast 2025-2030 ($ thousand)
Data Table on Europe - Market size and forecast 2025-2030 ($ thousand)
Chart on Europe - Year-over-year growth 2025-2030 (%)
Data Table on Europe - Year-over-year growth 2025-2030 (%)
Chart on Regional Comparison - Europe
Data Table on Regional Comparison - Europe

12.4.1 Germany - Market size and forecast 2025-2030

Chart on Germany - Market size and forecast 2025-2030 ($ thousand)
Data Table on Germany - Market size and forecast 2025-2030 ($ thousand)
Chart on Germany - Year-over-year growth 2025-2030 (%)
Data Table on Germany - Year-over-year growth 2025-2030 (%)

12.4.2 France - Market size and forecast 2025-2030

Chart on France - Market size and forecast 2025-2030 ($ thousand)
Data Table on France - Market size and forecast 2025-2030 ($ thousand)
Chart on France - Year-over-year growth 2025-2030 (%)
Data Table on France - Year-over-year growth 2025-2030 (%)

12.4.3 UK - Market size and forecast 2025-2030

Chart on UK - Market size and forecast 2025-2030 ($ thousand)
Data Table on UK - Market size and forecast 2025-2030 ($ thousand)
Chart on UK - Year-over-year growth 2025-2030 (%)
Data Table on UK - Year-over-year growth 2025-2030 (%)

12.4.4 The Netherlands - Market size and forecast 2025-2030

Chart on The Netherlands - Market size and forecast 2025-2030 ($ thousand)
Data Table on The Netherlands - Market size and forecast 2025-2030 ($ thousand)
Chart on The Netherlands - Year-over-year growth 2025-2030 (%)
Data Table on The Netherlands - Year-over-year growth 2025-2030 (%)

12.4.5 Italy - Market size and forecast 2025-2030

Chart on Italy - Market size and forecast 2025-2030 ($ thousand)
Data Table on Italy - Market size and forecast 2025-2030 ($ thousand)
Chart on Italy - Year-over-year growth 2025-2030 (%)
Data Table on Italy - Year-over-year growth 2025-2030 (%)

12.4.6 Spain - Market size and forecast 2025-2030

Chart on Spain - Market size and forecast 2025-2030 ($ thousand)
Data Table on Spain - Market size and forecast 2025-2030 ($ thousand)
Chart on Spain - Year-over-year growth 2025-2030 (%)
Data Table on Spain - Year-over-year growth 2025-2030 (%)

12.5 APAC - Market size and forecast 2025-2030

Chart on APAC - Market size and forecast 2025-2030 ($ thousand)
Data Table on APAC - Market size and forecast 2025-2030 ($ thousand)
Chart on APAC - Year-over-year growth 2025-2030 (%)
Data Table on APAC - Year-over-year growth 2025-2030 (%)
Chart on Regional Comparison - APAC
Data Table on Regional Comparison - APAC

12.5.1 China - Market size and forecast 2025-2030

Chart on China - Market size and forecast 2025-2030 ($ thousand)
Data Table on China - Market size and forecast 2025-2030 ($ thousand)
Chart on China - Year-over-year growth 2025-2030 (%)
Data Table on China - Year-over-year growth 2025-2030 (%)

12.5.2 India - Market size and forecast 2025-2030

Chart on India - Market size and forecast 2025-2030 ($ thousand)
Data Table on India - Market size and forecast 2025-2030 ($ thousand)
Chart on India - Year-over-year growth 2025-2030 (%)
Data Table on India - Year-over-year growth 2025-2030 (%)

12.5.3 Japan - Market size and forecast 2025-2030

Chart on Japan - Market size and forecast 2025-2030 ($ thousand)
Data Table on Japan - Market size and forecast 2025-2030 ($ thousand)
Chart on Japan - Year-over-year growth 2025-2030 (%)
Data Table on Japan - Year-over-year growth 2025-2030 (%)

12.5.4 South Korea - Market size and forecast 2025-2030

Chart on South Korea - Market size and forecast 2025-2030 ($ thousand)
Data Table on South Korea - Market size and forecast 2025-2030 ($ thousand)
Chart on South Korea - Year-over-year growth 2025-2030 (%)
Data Table on South Korea - Year-over-year growth 2025-2030 (%)

12.5.5 Singapore - Market size and forecast 2025-2030

Chart on Singapore - Market size and forecast 2025-2030 ($ thousand)
Data Table on Singapore - Market size and forecast 2025-2030 ($ thousand)
Chart on Singapore - Year-over-year growth 2025-2030 (%)
Data Table on Singapore - Year-over-year growth 2025-2030 (%)

12.5.6 Australia - Market size and forecast 2025-2030

Chart on Australia - Market size and forecast 2025-2030 ($ thousand)
Data Table on Australia - Market size and forecast 2025-2030 ($ thousand)
Chart on Australia - Year-over-year growth 2025-2030 (%)
Data Table on Australia - Year-over-year growth 2025-2030 (%)

12.6 South America - Market size and forecast 2025-2030

Chart on South America - Market size and forecast 2025-2030 ($ thousand)
Data Table on South America - Market size and forecast 2025-2030 ($ thousand)
Chart on South America - Year-over-year growth 2025-2030 (%)
Data Table on South America - Year-over-year growth 2025-2030 (%)
Chart on Regional Comparison - South America
Data Table on Regional Comparison - South America

12.6.1 Brazil - Market size and forecast 2025-2030

Chart on Brazil - Market size and forecast 2025-2030 ($ thousand)
Data Table on Brazil - Market size and forecast 2025-2030 ($ thousand)
Chart on Brazil - Year-over-year growth 2025-2030 (%)
Data Table on Brazil - Year-over-year growth 2025-2030 (%)

12.6.2 Argentina - Market size and forecast 2025-2030

Chart on Argentina - Market size and forecast 2025-2030 ($ thousand)
Data Table on Argentina - Market size and forecast 2025-2030 ($ thousand)
Chart on Argentina - Year-over-year growth 2025-2030 (%)
Data Table on Argentina - Year-over-year growth 2025-2030 (%)

12.6.3 Chile - Market size and forecast 2025-2030

Chart on Chile - Market size and forecast 2025-2030 ($ thousand)
Data Table on Chile - Market size and forecast 2025-2030 ($ thousand)
Chart on Chile - Year-over-year growth 2025-2030 (%)
Data Table on Chile - Year-over-year growth 2025-2030 (%)

12.7 Middle East and Africa - Market size and forecast 2025-2030

Chart on Middle East and Africa - Market size and forecast 2025-2030 ($ thousand)
Data Table on Middle East and Africa - Market size and forecast 2025-2030 ($ thousand)
Chart on Middle East and Africa - Year-over-year growth 2025-2030 (%)
Data Table on Middle East and Africa - Year-over-year growth 2025-2030 (%)
Chart on Regional Comparison - Middle East and Africa
Data Table on Regional Comparison - Middle East and Africa

12.7.1 UAE - Market size and forecast 2025-2030

Chart on UAE - Market size and forecast 2025-2030 ($ thousand)
Data Table on UAE - Market size and forecast 2025-2030 ($ thousand)
Chart on UAE - Year-over-year growth 2025-2030 (%)
Data Table on UAE - Year-over-year growth 2025-2030 (%)

12.7.2 Saudi Arabia - Market size and forecast 2025-2030

Chart on Saudi Arabia - Market size and forecast 2025-2030 ($ thousand)
Data Table on Saudi Arabia - Market size and forecast 2025-2030 ($ thousand)
Chart on Saudi Arabia - Year-over-year growth 2025-2030 (%)
Data Table on Saudi Arabia - Year-over-year growth 2025-2030 (%)

12.7.3 Israel - Market size and forecast 2025-2030

Chart on Israel - Market size and forecast 2025-2030 ($ thousand)
Data Table on Israel - Market size and forecast 2025-2030 ($ thousand)
Chart on Israel - Year-over-year growth 2025-2030 (%)
Data Table on Israel - Year-over-year growth 2025-2030 (%)

12.7.4 Egypt - Market size and forecast 2025-2030

Chart on Egypt - Market size and forecast 2025-2030 ($ thousand)
Data Table on Egypt - Market size and forecast 2025-2030 ($ thousand)
Chart on Egypt - Year-over-year growth 2025-2030 (%)
Data Table on Egypt - Year-over-year growth 2025-2030 (%)

12.7.5 South Africa - Market size and forecast 2025-2030

Chart on South Africa - Market size and forecast 2025-2030 ($ thousand)
Data Table on South Africa - Market size and forecast 2025-2030 ($ thousand)
Chart on South Africa - Year-over-year growth 2025-2030 (%)
Data Table on South Africa - Year-over-year growth 2025-2030 (%)

12.8 Market opportunity by geography

Market opportunity by geography ($ thousand)
Data Tables on Market opportunity by geography ($ thousand)

13. Drivers, Challenges, and Opportunity

13.1 Market drivers

Strategic shift toward multilateral governance and transparency frameworks
Institutionalization of enforceable regulatory mandates and compliance benchmarks
Integration of standardized risk management into enterprise architectures

13.2 Market challenges

Fragmented global regulatory divergence and sovereign interests
Technical complexity of continuous auditing and verification
Mismatch between innovation velocity and policy maturation

13.3 Impact of drivers and challenges

Impact of drivers and challenges in 2025 and 2030

13.4 Market opportunities

Transition from principle-setting to enforcement and practical implementation
Global proliferation of scientific oversight and empirical safety benchmarking
Integration of standardized content provenance and technical labeling

14. Competitive Landscape

14.1 Overview

14.2

Overview on criticality of inputs and factors of differentiation

14.3 Landscape disruption

Overview on factors of disruption

14.4 Industry risks

Impact of key risks on business

15. Competitive Analysis

15.1 Companies profiled

Companies covered

15.2 Company ranking index

15.3 Market positioning of companies

Matrix on companies position and classification

15.4 Accenture Plc

Accenture Plc - Overview
Accenture Plc - Business segments
Accenture Plc - Key news
Accenture Plc - Key offerings
Accenture Plc - Segment focus
SWOT

15.5 Amazon Web Services Inc.

Amazon Web Services Inc. - Overview
Amazon Web Services Inc. - Product / Service
Amazon Web Services Inc. - Key offerings
SWOT

15.6 Capgemini SE

Capgemini SE - Overview
Capgemini SE - Business segments
Capgemini SE - Key news
Capgemini SE - Key offerings
Capgemini SE - Segment focus
SWOT

15.7 Cognizant Technology Solution

Cognizant Technology Solution - Overview
Cognizant Technology Solution - Business segments
Cognizant Technology Solution - Key news
Cognizant Technology Solution - Key offerings
Cognizant Technology Solution - Segment focus
SWOT

15.8 Deloitte Touche Tohmatsu Ltd.

Deloitte Touche Tohmatsu Ltd. - Overview
Deloitte Touche Tohmatsu Ltd. - Business segments
Deloitte Touche Tohmatsu Ltd. - Key offerings
Deloitte Touche Tohmatsu Ltd. - Segment focus
SWOT

15.9 Google LLC

Google LLC - Overview
Google LLC - Product / Service
Google LLC - Key offerings
SWOT

15.10 IBM Corp.

IBM Corp. - Overview
IBM Corp. - Business segments
IBM Corp. - Key news
IBM Corp. - Key offerings
IBM Corp. - Segment focus
SWOT

15.11 Infosys Ltd.

Infosys Ltd. - Overview
Infosys Ltd. - Business segments
Infosys Ltd. - Key news
Infosys Ltd. - Key offerings
Infosys Ltd. - Segment focus
SWOT

15.12 Microsoft Corp.

Microsoft Corp. - Overview
Microsoft Corp. - Business segments
Microsoft Corp. - Key news
Microsoft Corp. - Key offerings
Microsoft Corp. - Segment focus
SWOT

15.13 Oracle Corp.

Oracle Corp. - Overview
Oracle Corp. - Business segments
Oracle Corp. - Key news
Oracle Corp. - Key offerings
Oracle Corp. - Segment focus
SWOT

15.14 PricewaterhouseCoopers LLP

PricewaterhouseCoopers LLP - Overview
PricewaterhouseCoopers LLP - Product / Service
PricewaterhouseCoopers LLP - Key offerings
SWOT

15.15 Salesforce Inc.

Salesforce Inc. - Overview
Salesforce Inc. - Business segments
Salesforce Inc. - Key news
Salesforce Inc. - Key offerings
Salesforce Inc. - Segment focus
SWOT

15.16 SAP SE

SAP SE - Overview
SAP SE - Business segments
SAP SE - Key news
SAP SE - Key offerings
SAP SE - Segment focus
SWOT

15.17 Tata Consultancy Services

Tata Consultancy Services - Overview
Tata Consultancy Services - Business segments
Tata Consultancy Services - Key offerings
Tata Consultancy Services - Segment focus
SWOT

15.18 Wipro Ltd.

Wipro Ltd. - Overview
Wipro Ltd. - Business segments
Wipro Ltd. - Key news
Wipro Ltd. - Key offerings
Wipro Ltd. - Segment focus
SWOT

16. Appendix

16.1 Scope of the report

Market definition
Objectives
Notes and caveats

16.2 Inclusions and exclusions checklist

Inclusions checklist
Exclusions checklist

16.3 Currency conversion rates for US$

16.4 Research methodology

16.5 Data procurement

Information sources

16.6 Data validation

16.7 Validation techniques employed for market sizing

16.8 Data synthesis

16.9 360 degree market analysis

16.10 List of abbreviations

Research Methodology

Technavio presents a detailed picture of the market by way of study, synthesis, and summation of data from multiple sources. The analysts have presented the various facets of the market with a particular focus on identifying the key industry influencers. The data thus presented is comprehensive, reliable, and the result of extensive research, both primary and secondary.

INFORMATION SOURCES

Primary sources

  • Manufacturers and suppliers
  • Channel partners
  • Industry experts
  • Strategic decision makers

Secondary sources

  • Industry journals and periodicals
  • Government data
  • Financial reports of key industry players
  • Historical data
  • Press releases

DATA ANALYSIS

Data Synthesis

  • Collation of data
  • Estimation of key figures
  • Analysis of derived insights

Data Validation

  • Triangulation with data models
  • Reference against proprietary databases
  • Corroboration with industry experts

REPORT WRITING

Qualitative

  • Market drivers
  • Market challenges
  • Market trends
  • Five forces analysis

Quantitative

  • Market size and forecast
  • Market segmentation
  • Geographical insights
  • Competitive landscape

Interested in this report?

Get your sample now to see our research methodology and insights!

Download Now

Frequently Asked Questions

AI Policy And Standards market growth will increase by USD 509304.1 thousand thousand during 2026-2030.

The AI Policy And Standards market is expected to grow at a CAGR of 38.4% during 2026-2030.

AI Policy And Standards market is segmented by Component (Solutions, Services) Application (Risk and compliance management, Bias detection and mitigation, Model explainability, Fairness and accountability tools, Others) Deployment (Cloud-based, On-premises)

Accenture Plc, Amazon Web Services Inc., Capgemini SE, Cognizant Technology Solution, Credo AI, Databricks Inc., DataRobot Inc., Deloitte Touche Tohmatsu Ltd., Google LLC, HCL Technologies Ltd., IBM Corp., Infosys Ltd., KPMG International Ltd., Microsoft Corp., Oracle Corp., PricewaterhouseCoopers LLP, Salesforce Inc., SAP SE, Tata Consultancy Services, Wipro Ltd. are a few of the key vendors in the AI Policy And Standards market.

North America will register the highest growth rate of 43.4% among the other regions. Therefore, the AI Policy And Standards market in North America is expected to garner significant business opportunities for the vendors during the forecast period.

US, Canada, Mexico, Germany, France, UK, The Netherlands, Italy, Spain, China, India, Japan, South Korea, Singapore, Australia, Brazil, Argentina, Chile, UAE, Saudi Arabia, Israel, Egypt, South Africa

  • Strategic shift toward multilateral governance and transparency frameworks is the driving factor this market.

The AI Policy And Standards market vendors should focus on grabbing business opportunities from the Component segment as it accounted for the largest market share in the base year.
RIA - Research AI Assistant
Ask RIA