AI Radiology Workflow Automation Software Market Analysis, Size, and Forecast 2026-2030: North America (US, Canada, and Mexico), Europe (Germany, UK, and France), APAC (China, Japan, and India), South America (Brazil, Argentina, and Colombia), Middle East and Africa (Saudi Arabia, UAE, and South Africa), and Rest of World (ROW)

AI Radiology Workflow Automation Software Market Analysis, Size, and Forecast 2026-2030:
North America (US, Canada, and Mexico), Europe (Germany, UK, and France), APAC (China, Japan, and India), South America (Brazil, Argentina, and Colombia), Middle East and Africa (Saudi Arabia, UAE, and South Africa), and Rest of World (ROW)

Published: Apr 2026 297 Pages SKU: IRTNTR81393

Market Overview at a Glance

$1.42 B
Market Opportunity
21.6%
CAGR 2025 - 2030
44.4%
North America Growth
$434.6 Mn
Software segment 2024

AI Radiology Workflow Automation Software Market Size 2026-2030

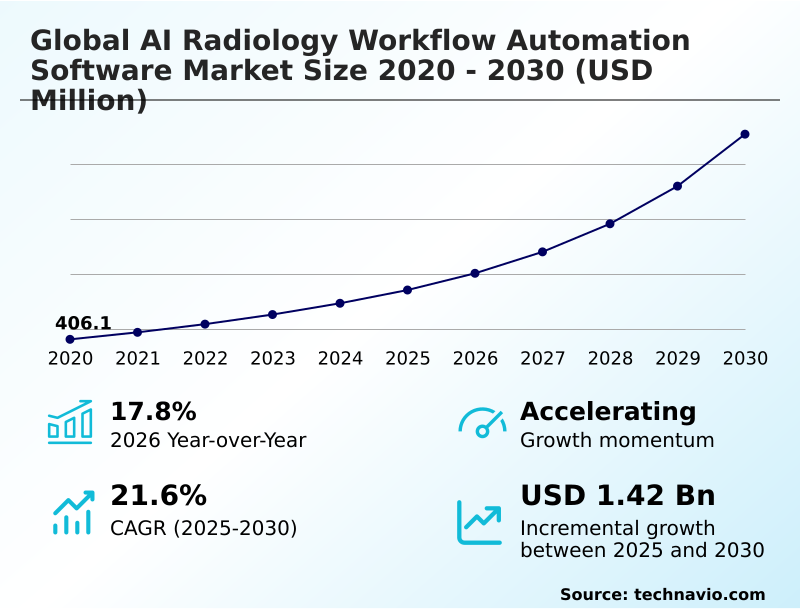
The ai radiology workflow automation software market size is valued to increase by USD 1.42 billion, at a CAGR of 21.6% from 2025 to 2030. Exponential expansion of medical imaging volumes across major regions will drive the ai radiology workflow automation software market.

Major Market Trends & Insights

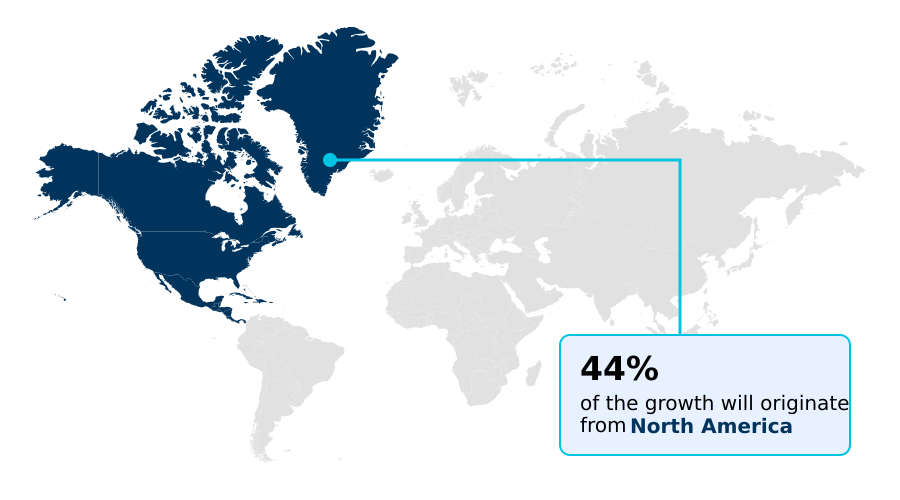
  • North America dominated the market and accounted for a 44.4% growth during the forecast period.
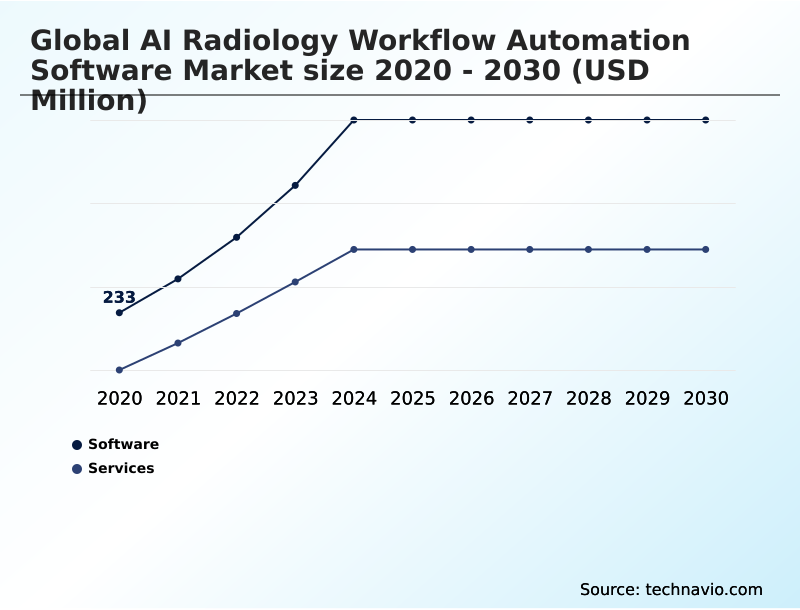
  • By Component - Software segment was valued at USD 434.6 million in 2024
  • By Application - WOO segment accounted for the largest market revenue share in 2024

Market Size & Forecast

  • Market Opportunities: USD 1.87 billion
  • Market Future Opportunities: USD 1.42 billion
  • CAGR from 2025 to 2030 : 21.6%

Market Summary

  • The AI radiology workflow automation software market is undergoing a significant transformation, driven by the need to manage immense diagnostic imaging volumes and alleviate pressure on medical professionals. Advanced platforms featuring machine learning models and deep learning frameworks are essential for optimizing departmental resource allocation and improving clinical workflow efficiency.
  • These solutions provide robust clinical decision support, moving beyond simple image analysis to offer intelligent load balancing and automated case prioritization. For example, a large hospital network can deploy an AI orchestration platform to automatically route neurological scans to available subspecialists, ensuring the fastest possible diagnostic turnaround time for critical cases like strokes.
  • This not only enhances radiologist productivity by up to 25% but also directly supports value-based care reimbursement models by improving diagnostic accuracy. However, navigating complex regulatory approval processes and ensuring HIPAA compliance remain critical hurdles for developers.
  • The technology’s core value lies in its ability to streamline operations, from preliminary scan analysis to structured reporting automation, ultimately allowing clinicians to focus on complex patient care.

What will be the Size of the AI Radiology Workflow Automation Software Market during the forecast period?

Get Key Insights on Market Forecast (PDF) Request Free Sample

How is the AI Radiology Workflow Automation Software Market Segmented?

The ai radiology workflow automation software industry research report provides comprehensive data (region-wise segment analysis), with forecasts and estimates in "USD million" for the period 2026-2030, as well as historical data from 2020-2024 for the following segments.

  • Component
    • Software
    • Services
  • Application
    • WOO
    • Triage and prioritization
    • Reporting and documentation
    • Others
  • Deployment
    • Cloud
    • On premises
  • Geography
    • North America
      • US
      • Canada
      • Mexico
    • Europe
      • Germany
      • UK
      • France
    • APAC
      • China
      • Japan
      • India
    • South America
      • Brazil
      • Argentina
      • Colombia
    • Middle East and Africa
      • Saudi Arabia
      • UAE
      • South Africa
    • Rest of World (ROW)

By Component Insights

The software segment is estimated to witness significant growth during the forecast period.

The software segment is central to market development, encompassing advanced image processing algorithms and tools for preliminary scan analysis. Innovations are focused on reducing manual workloads through capabilities like automated patient data entry reduction, freeing up valuable clinical time.

Leading solutions, exemplified by integrated systems like the ai-rad companion and the edison platform, are becoming indispensable for departmental resource allocation. These platforms are crucial for teleradiology network support, enabling remote diagnostics at scale.

They also incorporate predictive functions for preventative equipment maintenance, which can reduce scanner downtime by up to 20%, and tools for patient scheduling optimization, improving throughput and the overall patient experience.

Request Free Sample

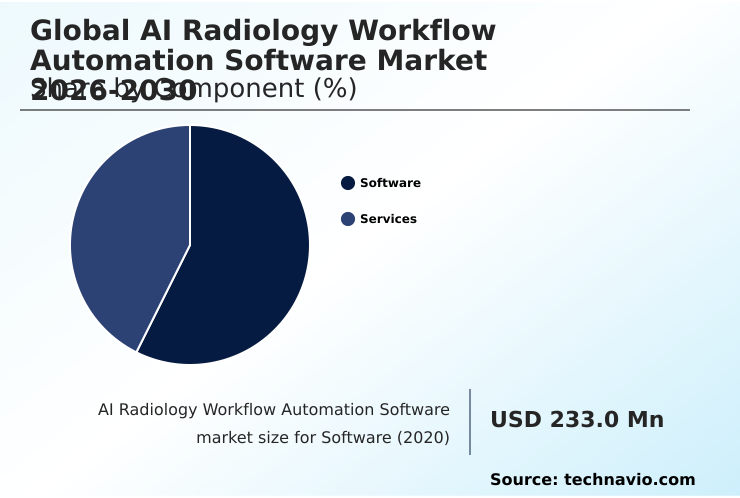
The Software segment was valued at USD 434.6 million in 2024 and showed a gradual increase during the forecast period.

Request Free Sample

Regional Analysis

North America is estimated to contribute 44.4% to the growth of the global market during the forecast period.Technavio’s analysts have elaborately explained the regional trends and drivers that shape the market during the forecast period.

See How AI Radiology Workflow Automation Software Market Demand is Rising in North America Request Free Sample

North America is set to contribute approximately 44% of the market's incremental growth, driven by advanced healthcare infrastructure and high adoption rates.

In this region, the focus is on sophisticated AI orchestration platforms that enable intelligent load balancing and dynamic worklist management.

The clinical validation of new machine learning models is a key priority, with a strong emphasis on algorithmic transparency to build clinician trust.

In contrast, the APAC market, with a growth rate over 23%, is leveraging these technologies to bridge healthcare access gaps.

Here, federated learning models and robust data anonymization protocols are critical for deploying automated anomaly detection across diverse populations, supported by effective change management strategies to ensure widespread use.

Market Dynamics

Our researchers analyzed the data with 2025 as the base year, along with the key drivers, trends, and challenges. A holistic analysis of drivers will help companies refine their marketing strategies to gain a competitive advantage.

  • Healthcare providers are increasingly evaluating the ROI of AI radiology workflow automation to justify investment in platforms that address critical clinical needs. A key application is using AI software for stroke detection workflow, which complements solutions for automating pulmonary embolism triage with AI. These tools provide immediate benefits in emergency radiology, where AI-driven intracranial hemorrhage prioritization can be life-saving.
  • Beyond emergencies, generative AI for radiology report drafting is a significant focus, helping to reduce radiologist burnout with automation software. The implementation strategy is a central question, with debates over cloud vs on-premise AI radiology platforms and the importance of integrating AI triage into existing PACS. Vendor-neutral AI orchestration for radiology is gaining traction, allowing institutions to combine best-in-class algorithms.
  • Functionally, these systems improve radiologist productivity with AI tools by automating lung nodule detection and reporting and enabling AI-powered follow-up tracking for findings. Predictive analytics for MRI scanner scheduling and using AI for preventative modality maintenance are also becoming vital for optimizing diagnostic imaging throughput.
  • Successful deployment requires thorough clinical validation of AI triage algorithms and strategies for managing AI algorithm performance and drift. Use cases are expanding to include workflow automation for mammography screening and AI tools for teleradiology workload balancing, demonstrating a system-wide impact that far exceeds manual processes.

What are the key market drivers leading to the rise in the adoption of AI Radiology Workflow Automation Software Industry?

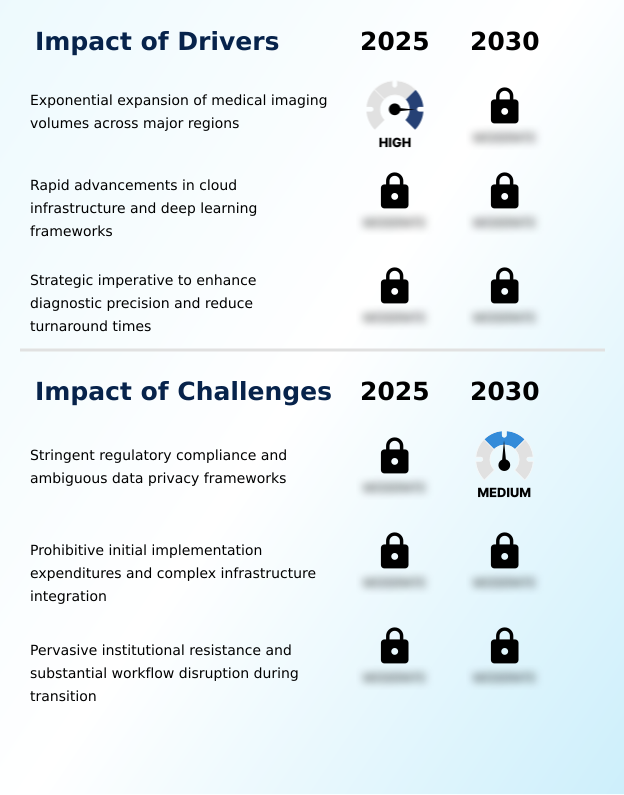
  • The exponential expansion of medical imaging volumes across major regions serves as the primary driver for market growth.

  • Market expansion is fueled by mature deep learning frameworks and computer vision algorithms that provide robust clinical decision support.
  • The rise of natural language generation is enabling structured reporting automation, which cuts down documentation time by over 40% and ensures adherence to interoperability standards.
  • As healthcare data security becomes paramount, vendors are engineering platforms that ensure strict HIPAA compliance and GDPR compliance by design. This focus on security and standardization simplifies the regulatory approval process, which has historically been a barrier.
  • These technological drivers create a compelling case for adoption, promising both clinical and operational advantages.

What are the market trends shaping the AI Radiology Workflow Automation Software Industry?

  • The integration of generative AI is emerging as a pivotal trend, focused on automating report generation and simplifying patient communication.

  • A pivotal trend is the deployment of platforms offering AI-powered triage, which streamlines diagnostic workflow orchestration. These systems provide automated case prioritization, ensuring that critical studies are reviewed first, which significantly boosts radiologist productivity and operational throughput.
  • The tight integration with existing PACS and radiology information system integration is crucial for seamless adoption, leading to a demonstrable diagnostic accuracy improvement of up to 15%. This efficiency directly supports value-based care reimbursement models by linking technological investment to better patient outcomes. The overall impact is a marked physician burnout reduction, as automation handles repetitive, high-volume tasks.

What challenges does the AI Radiology Workflow Automation Software Industry face during its growth?

  • Stringent regulatory compliance requirements and ambiguous data privacy frameworks present a key challenge affecting industry growth.

  • A primary challenge is the high total cost of ownership associated with deploying a comprehensive enterprise imaging platform. While predictive workflow analytics promise to enhance clinical workflow efficiency, the initial legacy system integration can be complex and expensive. Many institutions report user adoption rates below 50% in the first year without proper training and change management.
  • The shift to a cloud-native architecture and SaaS delivery model helps mitigate some costs, but concerns remain over long-term subscription fees. Achieving a reduction in diagnostic turnaround time requires not just the software but also a full re-engineering of existing processes, from automated quantitative measurements to final reporting.

Exclusive Technavio Analysis on Customer Landscape

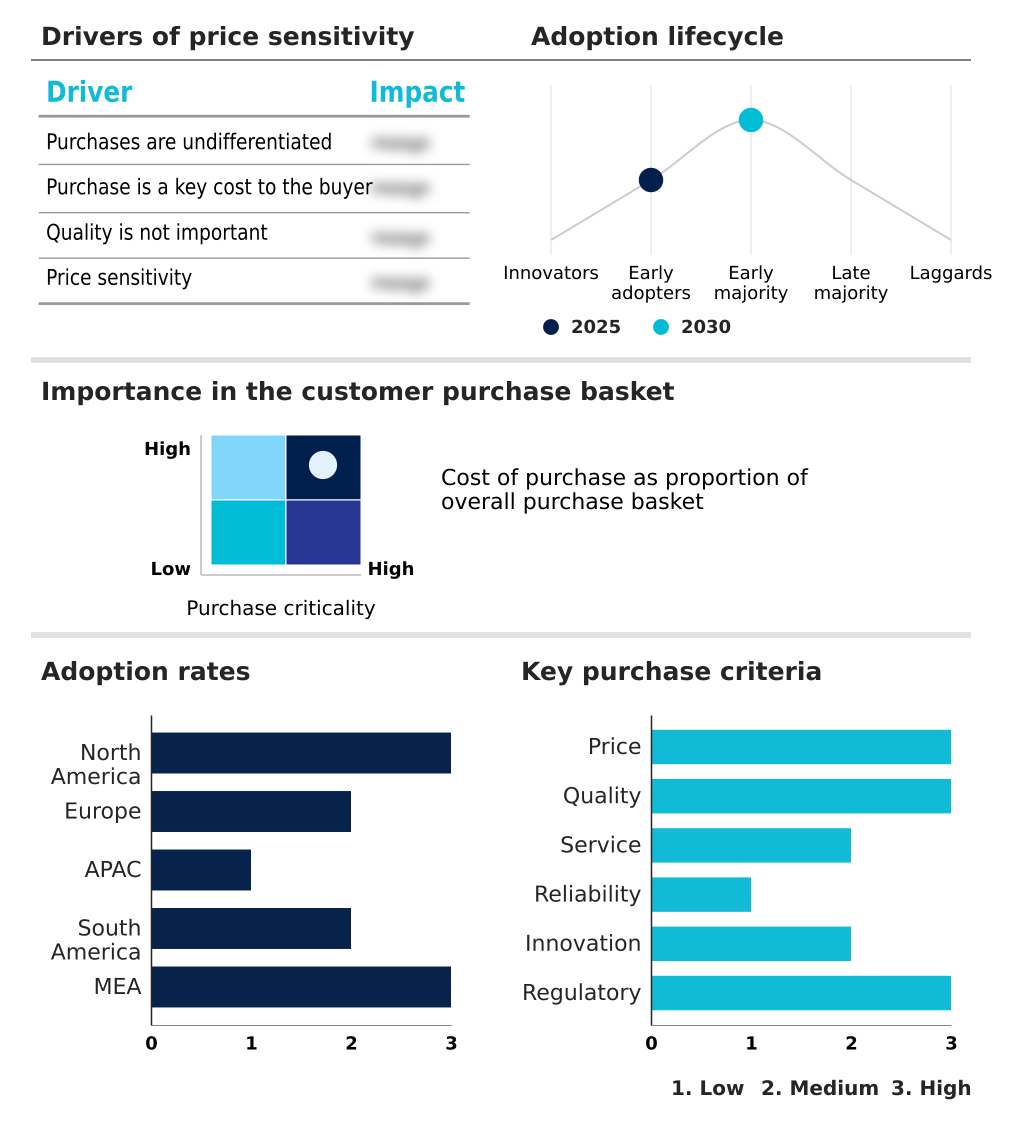
The ai radiology workflow automation software market forecasting report includes the adoption lifecycle of the market, covering from the innovator’s stage to the laggard’s stage. It focuses on adoption rates in different regions based on penetration. Furthermore, the ai radiology workflow automation software market report also includes key purchase criteria and drivers of price sensitivity to help companies evaluate and develop their market growth analysis strategies.

Customer Landscape of AI Radiology Workflow Automation Software Industry

Competitive Landscape

Companies are implementing various strategies, such as strategic alliances, ai radiology workflow automation software market forecast, partnerships, mergers and acquisitions, geographical expansion, and product/service launches, to enhance their presence in the industry.

Aidoc Medical Ltd. - The aiOS platform automates medical image analysis, enabling critical case triage and streamlining enterprise radiology workflows for enhanced operational efficiency.

The industry research and growth report includes detailed analyses of the competitive landscape of the market and information about key companies, including:

  • Aidoc Medical Ltd.
  • Blackford Analysis
  • Carestream Health Inc.
  • DeepHealth
  • FUJIFILM Holdings Corp.
  • GE HealthCare Technologies
  • GLEAMER
  • Koninklijke Philips NV
  • Lunit Inc.
  • Microsoft Corp.
  • Optum Inc.
  • Qure.ai Technologies Pvt. Ltd.
  • Rad AI
  • RapidAI
  • Sectra AB
  • Siemens Healthineers AG
  • Subtle Medical Inc.
  • TeraRecon Inc.
  • Visage Imaging
  • Viz.ai Inc.

Qualitative and quantitative analysis of companies has been conducted to help clients understand the wider business environment as well as the strengths and weaknesses of key industry players. Data is qualitatively analyzed to categorize companies as pure play, category-focused, industry-focused, and diversified; it is quantitatively analyzed to categorize companies as dominant, leading, strong, tentative, and weak.

Recent Development and News in Ai radiology workflow automation software market

  • In February 2025, DeepHealth announced the launch of a new suite of AI-powered radiology informatics and population screening solutions at the European Congress of Radiology, featuring a cloud-native platform to unify imaging workflows.
  • In November 2024, GE HealthCare entered into a definitive agreement to acquire Intelerad for approximately USD 2.3 billion, aiming to expand its medical imaging and workflow software solutions portfolio.
  • In October 2024, RADPAIR formed a strategic partnership with Lifetrack Medical Systems to accelerate the global expansion of its AI-enabled radiology workflow automation solutions.
  • In January 2025, Siemens Healthineers initiated a strategic collaboration with Apollo Hospitals in India to co-develop and deploy AI-driven imaging workflows specifically focused on the early detection of liver disease.

Dive into Technavio’s robust research methodology, blending expert interviews, extensive data synthesis, and validated models for unparalleled AI Radiology Workflow Automation Software Market insights. See full methodology.

Market Scope
Page number 297
Base year 2025
Historic period 2020-2024
Forecast period 2026-2030
Growth momentum & CAGR Accelerate at a CAGR of 21.6%
Market growth 2026-2030 USD 1416.8 million
Market structure Fragmented
YoY growth 2025-2026(%) 17.8%
Key countries US, Canada, Mexico, Germany, UK, France, Italy, The Netherlands, Spain, China, Japan, India, South Korea, Australia, Indonesia, Brazil, Argentina, Colombia, Saudi Arabia, UAE, South Africa, Israel and Turkey
Competitive landscape Leading Companies, Market Positioning of Companies, Competitive Strategies, and Industry Risks

Request Free Sample

Research Analyst Overview

  • The AI radiology workflow automation software market is defined by the integration of sophisticated platforms that enhance diagnostic precision. Systems offering AI-powered triage and automated case prioritization are becoming standard, enabling diagnostic workflow orchestration that reduces turnaround times by over 20%. The core technology relies on seamless radiology information system integration and PACS integration, augmented by advanced clinical decision support.
  • Deep learning frameworks and powerful computer vision algorithms drive structured reporting automation through natural language generation. An enterprise imaging platform now serves as the hub for these tools, performing automated quantitative measurements to improve clinical workflow efficiency. Boardroom decisions increasingly center on selecting an AI orchestration platform that offers superior worklist management and intelligent load balancing.
  • The effectiveness of these machine learning models in automated anomaly detection and preliminary scan analysis, coupled with patient data entry reduction, is reshaping capital investment strategies in diagnostic imaging. Platforms like the AI-rad companion and edison platform exemplify this shift toward comprehensive, integrated solutions.

What are the Key Data Covered in this AI Radiology Workflow Automation Software Market Research and Growth Report?

  • What is the expected growth of the AI Radiology Workflow Automation Software Market between 2026 and 2030?

    • USD 1.42 billion, at a CAGR of 21.6%

  • What segmentation does the market report cover?

    • The report is segmented by Component (Software, and Services), Application (WOO, Triage and prioritization, Reporting and documentation, and Others), Deployment (Cloud, and On premises) and Geography (North America, Europe, APAC, South America, Middle East and Africa)

  • Which regions are analyzed in the report?

    • North America, Europe, APAC, South America and Middle East and Africa

  • What are the key growth drivers and market challenges?

    • Exponential expansion of medical imaging volumes across major regions, Stringent regulatory compliance and ambiguous data privacy frameworks

  • Who are the major players in the AI Radiology Workflow Automation Software Market?

    • Aidoc Medical Ltd., Blackford Analysis, Carestream Health Inc., DeepHealth, FUJIFILM Holdings Corp., GE HealthCare Technologies, GLEAMER, Koninklijke Philips NV, Lunit Inc., Microsoft Corp., Optum Inc., Qure.ai Technologies Pvt. Ltd., Rad AI, RapidAI, Sectra AB, Siemens Healthineers AG, Subtle Medical Inc., TeraRecon Inc., Visage Imaging and Viz.ai Inc.

Market Research Insights

  • The AI radiology workflow automation software market is fundamentally reshaping diagnostic services, driven by the clear need for physician burnout reduction and enhanced radiologist productivity. Institutions adopting these tools report a 30% improvement in operational throughput, directly impacting value-based care reimbursement metrics.
  • The shift is enabled by mature interoperability standards and a focus on healthcare data security, ensuring both HIPAA compliance and GDPR compliance. A key challenge remains the complex regulatory approval process, which can delay deployment. As a result, many providers are opting for a flexible SaaS delivery model, which lowers the total cost of ownership compared to legacy systems.
  • Successful implementation hinges on addressing user adoption rates through effective change management and clinical validation, ensuring the technology delivers on its promise of diagnostic accuracy improvement.

We can help! Our analysts can customize this ai radiology workflow automation software market research report to meet your requirements.

Get in touch

1. Executive Summary

1.1 Market overview

Executive Summary - Chart on Market Overview
Executive Summary - Data Table on Market Overview
Executive Summary - Chart on Global Market Characteristics
Executive Summary - Chart on Market by Geography
Executive Summary - Chart on Market Segmentation by Component
Executive Summary - Chart on Market Segmentation by Application
Executive Summary - Chart on Market Segmentation by Deployment
Executive Summary - Chart on Incremental Growth
Executive Summary - Data Table on Incremental Growth
Executive Summary - Chart on Company Market Positioning

2. Technavio Analysis

2.1 Analysis of price sensitivity, lifecycle, customer purchase basket, adoption rates, and purchase criteria

2.2 Criticality of inputs and Factors of differentiation

Chart on Overview on criticality of inputs and factors of differentiation

2.3 Factors of disruption

Chart on Overview on factors of disruption

2.4 Impact of drivers and challenges

Chart on Impact of drivers and challenges in 2025 and 2030

3. Market Landscape

3.1 Market ecosystem

Chart on Parent Market
Data Table on - Parent Market

3.2 Market characteristics

Chart on Market characteristics analysis

3.3 Value chain analysis

Chart on Value chain analysis

4. Market Sizing

4.1 Market definition

Data Table on Offerings of companies included in the market definition

4.2 Market segment analysis

Market segments

4.3 Market size 2025

4.4 Market outlook: Forecast for 2025-2030

Chart on Global - Market size and forecast 2025-2030 ($ million)
Data Table on Global - Market size and forecast 2025-2030 ($ million)
Chart on Global Market: Year-over-year growth 2025-2030 (%)
Data Table on Global Market: Year-over-year growth 2025-2030 (%)

5. Historic Market Size

5.1 Global AI Radiology Workflow Automation Software Market 2020 - 2024

Historic Market Size - Data Table on Global AI Radiology Workflow Automation Software Market 2020 - 2024 ($ million)

5.2 Component segment analysis 2020 - 2024

Historic Market Size - Component Segment 2020 - 2024 ($ million)

5.3 Application segment analysis 2020 - 2024

Historic Market Size - Application Segment 2020 - 2024 ($ million)

5.4 Deployment segment analysis 2020 - 2024

Historic Market Size - Deployment Segment 2020 - 2024 ($ million)

5.5 Geography segment analysis 2020 - 2024

Historic Market Size - Geography Segment 2020 - 2024 ($ million)

5.6 Country segment analysis 2020 - 2024

Historic Market Size - Country Segment 2020 - 2024 ($ million)

6. Qualitative Analysis

6.1 Impact of Geopolitical Conflicts on Global AI Radiology Workflow Automation Software Market

7. Five Forces Analysis

7.1 Five forces summary

Five forces analysis - Comparison between 2025 and 2030

7.2 Bargaining power of buyers

Bargaining power of buyers - Impact of key factors 2025 and 2030

7.3 Bargaining power of suppliers

Bargaining power of suppliers - Impact of key factors in 2025 and 2030

7.4 Threat of new entrants

Threat of new entrants - Impact of key factors in 2025 and 2030

7.5 Threat of substitutes

Threat of substitutes - Impact of key factors in 2025 and 2030

7.6 Threat of rivalry

Threat of rivalry - Impact of key factors in 2025 and 2030

7.7 Market condition

Chart on Market condition - Five forces 2025 and 2030

8. Market Segmentation by Component

8.1 Market segments

Chart on Component - Market share 2025-2030 (%)
Data Table on Component - Market share 2025-2030 (%)

8.2 Comparison by Component

Chart on Comparison by Component
Data Table on Comparison by Component

8.3 Software - Market size and forecast 2025-2030

Chart on Software - Market size and forecast 2025-2030 ($ million)
Data Table on Software - Market size and forecast 2025-2030 ($ million)
Chart on Software - Year-over-year growth 2025-2030 (%)
Data Table on Software - Year-over-year growth 2025-2030 (%)

8.4 Services - Market size and forecast 2025-2030

Chart on Services - Market size and forecast 2025-2030 ($ million)
Data Table on Services - Market size and forecast 2025-2030 ($ million)
Chart on Services - Year-over-year growth 2025-2030 (%)
Data Table on Services - Year-over-year growth 2025-2030 (%)

8.5 Market opportunity by Component

Market opportunity by Component ($ million)
Data Table on Market opportunity by Component ($ million)

9. Market Segmentation by Application

9.1 Market segments

Chart on Application - Market share 2025-2030 (%)
Data Table on Application - Market share 2025-2030 (%)

9.2 Comparison by Application

Chart on Comparison by Application
Data Table on Comparison by Application

9.3 WOO - Market size and forecast 2025-2030

Chart on WOO - Market size and forecast 2025-2030 ($ million)
Data Table on WOO - Market size and forecast 2025-2030 ($ million)
Chart on WOO - Year-over-year growth 2025-2030 (%)
Data Table on WOO - Year-over-year growth 2025-2030 (%)

9.4 Triage and prioritization - Market size and forecast 2025-2030

Chart on Triage and prioritization - Market size and forecast 2025-2030 ($ million)
Data Table on Triage and prioritization - Market size and forecast 2025-2030 ($ million)
Chart on Triage and prioritization - Year-over-year growth 2025-2030 (%)
Data Table on Triage and prioritization - Year-over-year growth 2025-2030 (%)

9.5 Reporting and documentation - Market size and forecast 2025-2030

Chart on Reporting and documentation - Market size and forecast 2025-2030 ($ million)
Data Table on Reporting and documentation - Market size and forecast 2025-2030 ($ million)
Chart on Reporting and documentation - Year-over-year growth 2025-2030 (%)
Data Table on Reporting and documentation - Year-over-year growth 2025-2030 (%)

9.6 Others - Market size and forecast 2025-2030

Chart on Others - Market size and forecast 2025-2030 ($ million)
Data Table on Others - Market size and forecast 2025-2030 ($ million)
Chart on Others - Year-over-year growth 2025-2030 (%)
Data Table on Others - Year-over-year growth 2025-2030 (%)

9.7 Market opportunity by Application

Market opportunity by Application ($ million)
Data Table on Market opportunity by Application ($ million)

10. Market Segmentation by Deployment

10.1 Market segments

Chart on Deployment - Market share 2025-2030 (%)
Data Table on Deployment - Market share 2025-2030 (%)

10.2 Comparison by Deployment

Chart on Comparison by Deployment
Data Table on Comparison by Deployment

10.3 Cloud - Market size and forecast 2025-2030

Chart on Cloud - Market size and forecast 2025-2030 ($ million)
Data Table on Cloud - Market size and forecast 2025-2030 ($ million)
Chart on Cloud - Year-over-year growth 2025-2030 (%)
Data Table on Cloud - Year-over-year growth 2025-2030 (%)

10.4 On premises - Market size and forecast 2025-2030

Chart on On premises - Market size and forecast 2025-2030 ($ million)
Data Table on On premises - Market size and forecast 2025-2030 ($ million)
Chart on On premises - Year-over-year growth 2025-2030 (%)
Data Table on On premises - Year-over-year growth 2025-2030 (%)

10.5 Market opportunity by Deployment

Market opportunity by Deployment ($ million)
Data Table on Market opportunity by Deployment ($ million)

11. Customer Landscape

11.1 Customer landscape overview

Analysis of price sensitivity, lifecycle, customer purchase basket, adoption rates, and purchase criteria

12. Geographic Landscape

12.1 Geographic segmentation

Chart on Market share by geography 2025-2030 (%)
Data Table on Market share by geography 2025-2030 (%)

12.2 Geographic comparison

Chart on Geographic comparison
Data Table on Geographic comparison

12.3 North America - Market size and forecast 2025-2030

Chart on North America - Market size and forecast 2025-2030 ($ million)
Data Table on North America - Market size and forecast 2025-2030 ($ million)
Chart on North America - Year-over-year growth 2025-2030 (%)
Data Table on North America - Year-over-year growth 2025-2030 (%)
Chart on Regional Comparison - North America
Data Table on Regional Comparison - North America

12.3.1 US - Market size and forecast 2025-2030

Chart on US - Market size and forecast 2025-2030 ($ million)
Data Table on US - Market size and forecast 2025-2030 ($ million)
Chart on US - Year-over-year growth 2025-2030 (%)
Data Table on US - Year-over-year growth 2025-2030 (%)

12.3.2 Canada - Market size and forecast 2025-2030

Chart on Canada - Market size and forecast 2025-2030 ($ million)
Data Table on Canada - Market size and forecast 2025-2030 ($ million)
Chart on Canada - Year-over-year growth 2025-2030 (%)
Data Table on Canada - Year-over-year growth 2025-2030 (%)

12.3.3 Mexico - Market size and forecast 2025-2030

Chart on Mexico - Market size and forecast 2025-2030 ($ million)
Data Table on Mexico - Market size and forecast 2025-2030 ($ million)
Chart on Mexico - Year-over-year growth 2025-2030 (%)
Data Table on Mexico - Year-over-year growth 2025-2030 (%)

12.4 Europe - Market size and forecast 2025-2030

Chart on Europe - Market size and forecast 2025-2030 ($ million)
Data Table on Europe - Market size and forecast 2025-2030 ($ million)
Chart on Europe - Year-over-year growth 2025-2030 (%)
Data Table on Europe - Year-over-year growth 2025-2030 (%)
Chart on Regional Comparison - Europe
Data Table on Regional Comparison - Europe

12.4.1 Germany - Market size and forecast 2025-2030

Chart on Germany - Market size and forecast 2025-2030 ($ million)
Data Table on Germany - Market size and forecast 2025-2030 ($ million)
Chart on Germany - Year-over-year growth 2025-2030 (%)
Data Table on Germany - Year-over-year growth 2025-2030 (%)

12.4.2 UK - Market size and forecast 2025-2030

Chart on UK - Market size and forecast 2025-2030 ($ million)
Data Table on UK - Market size and forecast 2025-2030 ($ million)
Chart on UK - Year-over-year growth 2025-2030 (%)
Data Table on UK - Year-over-year growth 2025-2030 (%)

12.4.3 France - Market size and forecast 2025-2030

Chart on France - Market size and forecast 2025-2030 ($ million)
Data Table on France - Market size and forecast 2025-2030 ($ million)
Chart on France - Year-over-year growth 2025-2030 (%)
Data Table on France - Year-over-year growth 2025-2030 (%)

12.4.4 Italy - Market size and forecast 2025-2030

Chart on Italy - Market size and forecast 2025-2030 ($ million)
Data Table on Italy - Market size and forecast 2025-2030 ($ million)
Chart on Italy - Year-over-year growth 2025-2030 (%)
Data Table on Italy - Year-over-year growth 2025-2030 (%)

12.4.5 The Netherlands - Market size and forecast 2025-2030

Chart on The Netherlands - Market size and forecast 2025-2030 ($ million)
Data Table on The Netherlands - Market size and forecast 2025-2030 ($ million)
Chart on The Netherlands - Year-over-year growth 2025-2030 (%)
Data Table on The Netherlands - Year-over-year growth 2025-2030 (%)

12.4.6 Spain - Market size and forecast 2025-2030

Chart on Spain - Market size and forecast 2025-2030 ($ million)
Data Table on Spain - Market size and forecast 2025-2030 ($ million)
Chart on Spain - Year-over-year growth 2025-2030 (%)
Data Table on Spain - Year-over-year growth 2025-2030 (%)

12.5 APAC - Market size and forecast 2025-2030

Chart on APAC - Market size and forecast 2025-2030 ($ million)
Data Table on APAC - Market size and forecast 2025-2030 ($ million)
Chart on APAC - Year-over-year growth 2025-2030 (%)
Data Table on APAC - Year-over-year growth 2025-2030 (%)
Chart on Regional Comparison - APAC
Data Table on Regional Comparison - APAC

12.5.1 China - Market size and forecast 2025-2030

Chart on China - Market size and forecast 2025-2030 ($ million)
Data Table on China - Market size and forecast 2025-2030 ($ million)
Chart on China - Year-over-year growth 2025-2030 (%)
Data Table on China - Year-over-year growth 2025-2030 (%)

12.5.2 Japan - Market size and forecast 2025-2030

Chart on Japan - Market size and forecast 2025-2030 ($ million)
Data Table on Japan - Market size and forecast 2025-2030 ($ million)
Chart on Japan - Year-over-year growth 2025-2030 (%)
Data Table on Japan - Year-over-year growth 2025-2030 (%)

12.5.3 India - Market size and forecast 2025-2030

Chart on India - Market size and forecast 2025-2030 ($ million)
Data Table on India - Market size and forecast 2025-2030 ($ million)
Chart on India - Year-over-year growth 2025-2030 (%)
Data Table on India - Year-over-year growth 2025-2030 (%)

12.5.4 South Korea - Market size and forecast 2025-2030

Chart on South Korea - Market size and forecast 2025-2030 ($ million)
Data Table on South Korea - Market size and forecast 2025-2030 ($ million)
Chart on South Korea - Year-over-year growth 2025-2030 (%)
Data Table on South Korea - Year-over-year growth 2025-2030 (%)

12.5.5 Australia - Market size and forecast 2025-2030

Chart on Australia - Market size and forecast 2025-2030 ($ million)
Data Table on Australia - Market size and forecast 2025-2030 ($ million)
Chart on Australia - Year-over-year growth 2025-2030 (%)
Data Table on Australia - Year-over-year growth 2025-2030 (%)

12.5.6 Indonesia - Market size and forecast 2025-2030

Chart on Indonesia - Market size and forecast 2025-2030 ($ million)
Data Table on Indonesia - Market size and forecast 2025-2030 ($ million)
Chart on Indonesia - Year-over-year growth 2025-2030 (%)
Data Table on Indonesia - Year-over-year growth 2025-2030 (%)

12.6 South America - Market size and forecast 2025-2030

Chart on South America - Market size and forecast 2025-2030 ($ million)
Data Table on South America - Market size and forecast 2025-2030 ($ million)
Chart on South America - Year-over-year growth 2025-2030 (%)
Data Table on South America - Year-over-year growth 2025-2030 (%)
Chart on Regional Comparison - South America
Data Table on Regional Comparison - South America

12.6.1 Brazil - Market size and forecast 2025-2030

Chart on Brazil - Market size and forecast 2025-2030 ($ million)
Data Table on Brazil - Market size and forecast 2025-2030 ($ million)
Chart on Brazil - Year-over-year growth 2025-2030 (%)
Data Table on Brazil - Year-over-year growth 2025-2030 (%)

12.6.2 Argentina - Market size and forecast 2025-2030

Chart on Argentina - Market size and forecast 2025-2030 ($ million)
Data Table on Argentina - Market size and forecast 2025-2030 ($ million)
Chart on Argentina - Year-over-year growth 2025-2030 (%)
Data Table on Argentina - Year-over-year growth 2025-2030 (%)

12.6.3 Colombia - Market size and forecast 2025-2030

Chart on Colombia - Market size and forecast 2025-2030 ($ million)
Data Table on Colombia - Market size and forecast 2025-2030 ($ million)
Chart on Colombia - Year-over-year growth 2025-2030 (%)
Data Table on Colombia - Year-over-year growth 2025-2030 (%)

12.7 Middle East and Africa - Market size and forecast 2025-2030

Chart on Middle East and Africa - Market size and forecast 2025-2030 ($ million)
Data Table on Middle East and Africa - Market size and forecast 2025-2030 ($ million)
Chart on Middle East and Africa - Year-over-year growth 2025-2030 (%)
Data Table on Middle East and Africa - Year-over-year growth 2025-2030 (%)
Chart on Regional Comparison - Middle East and Africa
Data Table on Regional Comparison - Middle East and Africa

12.7.1 Saudi Arabia - Market size and forecast 2025-2030

Chart on Saudi Arabia - Market size and forecast 2025-2030 ($ million)
Data Table on Saudi Arabia - Market size and forecast 2025-2030 ($ million)
Chart on Saudi Arabia - Year-over-year growth 2025-2030 (%)
Data Table on Saudi Arabia - Year-over-year growth 2025-2030 (%)

12.7.2 UAE - Market size and forecast 2025-2030

Chart on UAE - Market size and forecast 2025-2030 ($ million)
Data Table on UAE - Market size and forecast 2025-2030 ($ million)
Chart on UAE - Year-over-year growth 2025-2030 (%)
Data Table on UAE - Year-over-year growth 2025-2030 (%)

12.7.3 South Africa - Market size and forecast 2025-2030

Chart on South Africa - Market size and forecast 2025-2030 ($ million)
Data Table on South Africa - Market size and forecast 2025-2030 ($ million)
Chart on South Africa - Year-over-year growth 2025-2030 (%)
Data Table on South Africa - Year-over-year growth 2025-2030 (%)

12.7.4 Israel - Market size and forecast 2025-2030

Chart on Israel - Market size and forecast 2025-2030 ($ million)
Data Table on Israel - Market size and forecast 2025-2030 ($ million)
Chart on Israel - Year-over-year growth 2025-2030 (%)
Data Table on Israel - Year-over-year growth 2025-2030 (%)

12.7.5 Turkey - Market size and forecast 2025-2030

Chart on Turkey - Market size and forecast 2025-2030 ($ million)
Data Table on Turkey - Market size and forecast 2025-2030 ($ million)
Chart on Turkey - Year-over-year growth 2025-2030 (%)
Data Table on Turkey - Year-over-year growth 2025-2030 (%)

12.8 Market opportunity by geography

Market opportunity by geography ($ million)
Data Tables on Market opportunity by geography ($ million)

13. Drivers, Challenges, and Opportunity

13.1 Market drivers

Exponential expansion of medical imaging volumes across major regions
Rapid advancements in cloud infrastructure and deep learning frameworks
Strategic imperative to enhance diagnostic precision and reduce turnaround times

13.2 Market challenges

Stringent regulatory compliance and ambiguous data privacy frameworks
Prohibitive initial implementation expenditures and complex infrastructure integration
Pervasive institutional resistance and substantial workflow disruption during transition

13.3 Impact of drivers and challenges

Impact of drivers and challenges in 2025 and 2030

13.4 Market opportunities

Integration of generative AI for automated reporting and patient communication
Shift toward company-neutral and interoperable ecosystems
Focus on predictive analytics for resource allocation and modality fleet management

14. Competitive Landscape

14.1 Overview

14.2

Overview on criticality of inputs and factors of differentiation

14.3 Landscape disruption

Overview on factors of disruption

14.4 Industry risks

Impact of key risks on business

15. Competitive Analysis

15.1 Companies profiled

Companies covered

15.2 Company ranking index

15.3 Market positioning of companies

Matrix on companies position and classification

15.4 Aidoc Medical Ltd.

Aidoc Medical Ltd. - Overview
Aidoc Medical Ltd. - Product / Service
Aidoc Medical Ltd. - Key offerings
SWOT

15.5 Blackford Analysis

Blackford Analysis - Overview
Blackford Analysis - Product / Service
Blackford Analysis - Key offerings
SWOT

15.6 FUJIFILM Holdings Corp.

FUJIFILM Holdings Corp. - Overview
FUJIFILM Holdings Corp. - Business segments
FUJIFILM Holdings Corp. - Key news
FUJIFILM Holdings Corp. - Key offerings
FUJIFILM Holdings Corp. - Segment focus
SWOT

15.7 GE HealthCare Technologies

GE HealthCare Technologies - Overview
GE HealthCare Technologies - Business segments
GE HealthCare Technologies - Key news
GE HealthCare Technologies - Key offerings
GE HealthCare Technologies - Segment focus
SWOT

15.8 Koninklijke Philips NV

Koninklijke Philips NV - Overview
Koninklijke Philips NV - Business segments
Koninklijke Philips NV - Key news
Koninklijke Philips NV - Key offerings
Koninklijke Philips NV - Segment focus
SWOT

15.9 Microsoft Corp.

Microsoft Corp. - Overview
Microsoft Corp. - Business segments
Microsoft Corp. - Key news
Microsoft Corp. - Key offerings
Microsoft Corp. - Segment focus
SWOT

15.10 Optum Inc.

Optum Inc. - Overview
Optum Inc. - Product / Service
Optum Inc. - Key offerings
SWOT

15.11 Qure.ai Technologies Pvt. Ltd.

Qure.ai Technologies Pvt. Ltd. - Overview
Qure.ai Technologies Pvt. Ltd. - Product / Service
Qure.ai Technologies Pvt. Ltd. - Key offerings
SWOT

15.12 Rad AI

Rad AI - Overview
Rad AI - Product / Service
Rad AI - Key offerings
SWOT

15.13 RapidAI

RapidAI - Overview
RapidAI - Product / Service
RapidAI - Key offerings
SWOT

15.14 Sectra AB

Sectra AB - Overview
Sectra AB - Business segments
Sectra AB - Key offerings
Sectra AB - Segment focus
SWOT

15.15 Siemens Healthineers AG

Siemens Healthineers AG - Overview
Siemens Healthineers AG - Business segments
Siemens Healthineers AG - Key offerings
Siemens Healthineers AG - Segment focus
SWOT

15.16 TeraRecon Inc.

TeraRecon Inc. - Overview
TeraRecon Inc. - Product / Service
TeraRecon Inc. - Key offerings
SWOT

15.17 Visage Imaging

Visage Imaging - Overview
Visage Imaging - Product / Service
Visage Imaging - Key offerings
SWOT

15.18 Viz.ai Inc.

Viz.ai Inc. - Overview
Viz.ai Inc. - Product / Service
Viz.ai Inc. - Key offerings
SWOT

16. Appendix

16.1 Scope of the report

Market definition
Objectives
Notes and caveats

16.2 Inclusions and exclusions checklist

Inclusions checklist
Exclusions checklist

16.3 Currency conversion rates for US$

16.4 Research methodology

16.5 Data procurement

Information sources

16.6 Data validation

16.7 Validation techniques employed for market sizing

16.8 Data synthesis

16.9 360 degree market analysis

16.10 List of abbreviations

Research Methodology

Technavio presents a detailed picture of the market by way of study, synthesis, and summation of data from multiple sources. The analysts have presented the various facets of the market with a particular focus on identifying the key industry influencers. The data thus presented is comprehensive, reliable, and the result of extensive research, both primary and secondary.

INFORMATION SOURCES

Primary sources

  • Manufacturers and suppliers
  • Channel partners
  • Industry experts
  • Strategic decision makers

Secondary sources

  • Industry journals and periodicals
  • Government data
  • Financial reports of key industry players
  • Historical data
  • Press releases

DATA ANALYSIS

Data Synthesis

  • Collation of data
  • Estimation of key figures
  • Analysis of derived insights

Data Validation

  • Triangulation with data models
  • Reference against proprietary databases
  • Corroboration with industry experts

REPORT WRITING

Qualitative

  • Market drivers
  • Market challenges
  • Market trends
  • Five forces analysis

Quantitative

  • Market size and forecast
  • Market segmentation
  • Geographical insights
  • Competitive landscape

Interested in this report?

Get your sample now to see our research methodology and insights!

Download Now

Frequently Asked Questions

AI Radiology Workflow Automation Software market growth will increase by USD 1416.8 million during 2026-2030.

The AI Radiology Workflow Automation Software market is expected to grow at a CAGR of 21.6% during 2026-2030.

AI Radiology Workflow Automation Software market is segmented by Component (Software, Services) Application (WOO, Triage and prioritization, Reporting and documentation, Others) Deployment (Cloud, On premises)

Aidoc Medical Ltd., Blackford Analysis, Carestream Health Inc., DeepHealth, FUJIFILM Holdings Corp., GE HealthCare Technologies, GLEAMER, Koninklijke Philips NV, Lunit Inc., Microsoft Corp., Optum Inc., Qure.ai Technologies Pvt. Ltd., Rad AI, RapidAI, Sectra AB, Siemens Healthineers AG, Subtle Medical Inc., TeraRecon Inc., Visage Imaging, Viz.ai Inc. are a few of the key vendors in the AI Radiology Workflow Automation Software market.

North America will register the highest growth rate of 44.4% among the other regions. Therefore, the AI Radiology Workflow Automation Software market in North America is expected to garner significant business opportunities for the vendors during the forecast period.

US, Canada, Mexico, Germany, UK, France, Italy, The Netherlands, Spain, China, Japan, India, South Korea, Australia, Indonesia, Brazil, Argentina, Colombia, Saudi Arabia, UAE, South Africa, Israel, Turkey

  • Exponential expansion of medical imaging volumes across major regions is the driving factor this market.

The AI Radiology Workflow Automation Software market vendors should focus on grabbing business opportunities from the Component segment as it accounted for the largest market share in the base year.
RIA - Research AI Assistant
Ask RIA