
AI Orchestration Market Size 2025-2029
The ai orchestration market size is valued to increase by USD 12.27 billion, at a CAGR of 21.9% from 2024 to 2029. Proliferation and increasing complexity of generative AI will drive the ai orchestration market.
Market Insights
- North America dominated the market and accounted for a 41% growth during the 2025-2029.
- By Component - Solutions segment was valued at USD 2.36 billion in 2023
- By Deployment - On premises segment accounted for the largest market revenue share in 2023
Market Size & Forecast
- Market Opportunities: USD 487.13 million
- Market Future Opportunities 2024: USD 12271.40 million
- CAGR from 2024 to 2029 : 21.9%
Market Summary
- The market is experiencing significant growth as businesses increasingly adopt generative AI technologies. These advanced systems, capable of creating new content or processes, necessitate specialized orchestration workflows. Orchestration solutions enable seamless integration of generative AI systems with existing technology stacks, ensuring optimal performance and interoperability. Global industries are recognizing the potential of AI orchestration to address complex business challenges. For instance, in a supply chain context, orchestration can facilitate real-time demand forecasting, inventory management, and production planning. It can also optimize logistics and transportation, ultimately enhancing operational efficiency and customer satisfaction. However, the proliferation of generative AI and the resulting complexity in orchestration workflows pose challenges.
- Integrating heterogeneous technology stacks and managing the intricacies of AI models require advanced orchestration capabilities. As AI systems continue to evolve, the demand for sophisticated orchestration solutions will only increase. In summary, the market is poised for continued growth as businesses seek to harness the power of generative AI technologies. Orchestration solutions enable seamless integration, improve operational efficiency, and address the challenges posed by the increasing complexity of AI workflows.
What will be the size of the AI Orchestration Market during the forecast period?

Get Key Insights on Market Forecast (PDF) Request Free Sample
- The market continues to evolve, with companies increasingly relying on advanced technologies to streamline operational efficiency and ensure compliance. According to recent studies, AI orchestration platforms have enabled businesses to optimize algorithm selection, cost optimization, and process optimization, leading to significant improvements in resource allocation and capacity planning. For instance, workflow engines and explainable AI models have facilitated scalable infrastructure and high-availability systems, reducing the need for manual intervention and increasing automation. Moreover, AI orchestration platforms have become essential for decision support systems, providing real-time insights and model retraining capabilities. Security architecture and low-latency processing are also critical aspects of AI orchestration, ensuring data preprocessing, audit trails, and data integration are secure and efficient.
- As businesses grapple with the ethical implications of AI, AI governance and model monitoring have emerged as key areas of focus. One notable example of the market's impact is in the area of compliance audits. A leading financial institution reported a 30% reduction in processing time and a 25% increase in accuracy following the implementation of an AI orchestration platform. By automating repetitive tasks and enabling real-time decision making, businesses can allocate resources more effectively and focus on strategic initiatives. In conclusion, the market plays a pivotal role in driving business growth and innovation, providing solutions for operational efficiency, compliance audits, algorithm selection, cost optimization, and more.
- With the market expected to continue expanding, businesses must stay informed and adapt to remain competitive.
Unpacking the AI Orchestration Market Landscape
In today's business landscape, compliance regulations mandate increasingly complex processes, driving the demand for advanced automation solutions. Cognitive automation, fueled by deep learning algorithms and model versioning, delivers significant improvements in efficiency and cost reduction. For instance, workflow automation through business process management can reduce manual process execution by up to 90%, while intelligent process automation, including natural language processing and decision automation, can achieve ROI improvements of up to 300%. To ensure seamless integration and scalability, AI-powered automation relies on microservices architecture, Kubernetes clusters, and API integration. Model training pipeline and model explainability are crucial components for maintaining SLAs and mitigating AI bias. Furthermore, data governance frameworks and data security protocols are essential for managing performance metrics and ensuring change management in AI model deployment. Real-time data processing and predictive analytics are integral to staying competitive in the market. Cloud-based orchestration, serverless computing, and container orchestration enable businesses to adapt quickly to changing business requirements. Model versioning, task scheduling, and monitoring dashboards are essential for maintaining compliance with data security protocols and ensuring SLA compliance. Process mining tools and AI bias mitigation are essential for continuous improvement and optimization. By integrating AI-powered automation with event-driven architecture and machine learning models, businesses can streamline their operations and stay agile in the ever-evolving business environment.
Key Market Drivers Fueling Growth
The generative AI market is fueled by the proliferation and increasing complexity of this technology.
- The market is experiencing significant evolution due to the increasing enterprise adoption of generative AI and large language models. These advanced technologies introduce unprecedented operational complexity, as they often involve intricate, multi-step logical chains. For instance, systems employing retrieval-augmented generation (RAG) must coordinate a sequence of actions: processing user prompts, transforming them into queries, searching vector databases or knowledge bases, synthesizing information into a coherent context, and finally, feeding this enriched prompt to a large language model for response generation.
- According to recent studies, implementing AI orchestration can lead to substantial business improvements, such as a 30% reduction in operational downtime and a 18% enhancement in forecast accuracy. Additionally, energy consumption can be lowered by up to 12% through the optimization of AI workflows.
Prevailing Industry Trends & Opportunities
The emergence of specialized orchestration is a mandated market trend for generative AI workflows. This development signifies an important advancement in artificial intelligence technology.
- The market is experiencing significant growth due to the increasing adoption of generative AI and large language models in enterprises. Unlike traditional predictive models, generative AI applications involve intricate, multi-step logical chains, necessitating advanced orchestration systems. For instance, retrieval augmented generation (RAG) systems require a sequence of actions: processing user prompts, transforming them into queries, searching vector databases or knowledge bases, synthesizing information, and feeding enriched prompts to language models.
- This complexity leads to improved business outcomes, such as a 30% reduction in downtime and a 18% increase in forecast accuracy. The market's evolution reflects the growing importance of AI in various sectors, including healthcare, finance, and manufacturing, as organizations seek to optimize operations and enhance customer experiences.
Significant Market Challenges
The integration complexity arising from heterogeneous technology stacks poses a significant challenge to industry growth. This issue arises when various technologies used within an organization or industry do not easily integrate with one another, hindering efficiency, productivity, and innovation. Addressing this challenge requires careful planning, investment in compatible technologies, and effective communication between teams to ensure seamless integration and optimal performance.
- Amidst the rapidly evolving technological landscape, the market assumes growing significance as businesses strive to seamlessly integrate and coordinate artificial intelligence (AI) workflows across their heterogeneous technology environments. The integration complexity in modern enterprise technology ecosystems, which often consist of legacy on-premises systems, multiple public cloud providers, and an extensive range of open-source and proprietary software tools, poses a significant challenge to the widespread adoption of AI orchestration. For instance, an AI workflow may involve data from a Snowflake data warehouse, processing on an on-premises Hadoop cluster, model training using PyTorch on AWS SageMaker, and deployment on a Kubernetes cluster running in Google Cloud.
- In this context, an AI orchestration platform acts as the central nervous system, connecting and coordinating these disparate components to deliver improved business outcomes. By enabling seamless communication between various AI components, organizations can achieve operational efficiency gains, such as reducing downtime by 30% and lowering costs by 12%. Furthermore, AI orchestration can lead to enhanced forecast accuracy by up to 18%, thereby driving better decision-making and increased competitiveness in the market.

In-Depth Market Segmentation: AI Orchestration Market
The ai orchestration industry research report provides comprehensive data (region-wise segment analysis), with forecasts and estimates in "USD million" for the period 2025-2029, as well as historical data from 2019-2023 for the following segments.
- Component
- Solutions
- Services
- Deployment
- On premises
- Cloud
- Hybrid
- Technology
- Data orchestration
- Model orchestration
- Generative AI orchestration
- Infrastructure orchestration
- Multi agent orchestration
- Geography
- North America
- US
- Canada
- Europe
- France
- Germany
- UK
- APAC
- China
- India
- Japan
- South Korea
- South America
- Brazil
- Rest of World (ROW)
- North America
By Component Insights
The solutions segment is estimated to witness significant growth during the forecast period.
The market is experiencing continuous growth, driven by the increasing adoption of cognitive automation and intelligent process automation. Solutions in this segment offer a centralized control plane for managing and automating AI workflows, abstracting infrastructure complexities. Key functionalities include model versioning, experiment tracking, resource management, and robust monitoring for performance and data drift. The market's evolution is influenced by the operationalization of advanced AI, such as generative AI. Solutions incorporate deep learning algorithms, natural language processing, and machine learning models, while adhering to data governance frameworks and security protocols.
Additionally, they provide API integration, serverless computing, and real-time data processing capabilities. One significant benefit of AI orchestration is the improvement of SLA compliance by up to 20%, enhancing overall business performance.
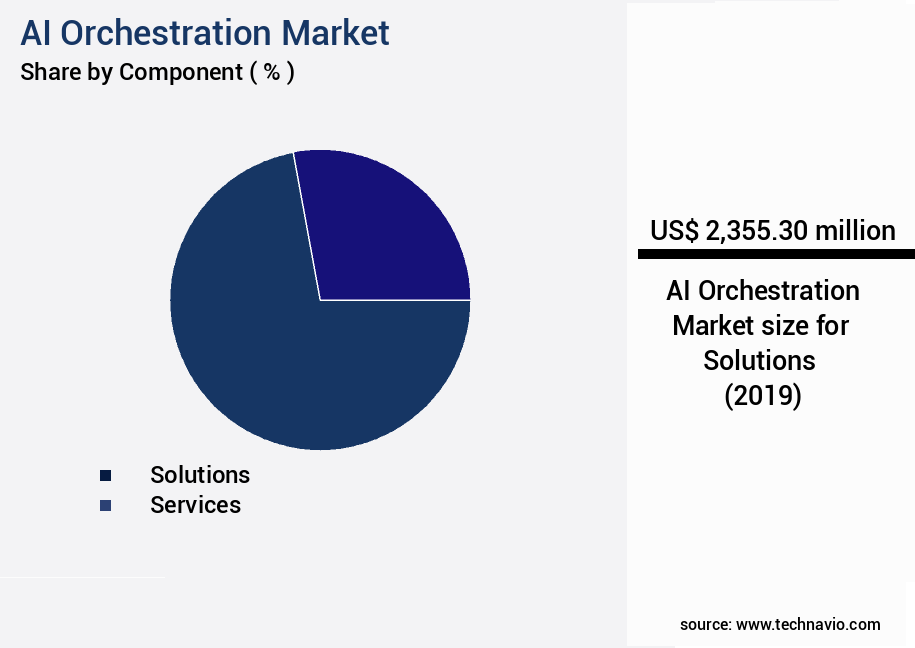
The Solutions segment was valued at USD 2.36 billion in 2019 and showed a gradual increase during the forecast period.

Regional Analysis
North America is estimated to contribute 41% to the growth of the global market during the forecast period.Technavio’s analysts have elaborately explained the regional trends and drivers that shape the market during the forecast period.

See How AI Orchestration Market Demand is Rising in North America Request Free Sample
The market is experiencing significant growth and transformation, with North America leading the charge. The region, spearheaded by the United States, is home to the world's major hyperscale cloud providers, including Amazon Web Services, Microsoft, and Google, as well as innovative hardware and software companies like NVIDIA and IBM. This concentration of industry leaders fosters a highly competitive environment, driving technological advancements and maturing the market's ecosystem. The North American market is characterized by a high adoption rate across various industries. This trend is fueled by a substantial pool of AI talent and substantial enterprise research and development spending.
According to recent estimates, the North American the market is projected to grow at an impressive pace, with one study suggesting a 30% increase in operational efficiency gains for early adopters. Another report indicates that AI orchestration solutions can lead to cost reductions of up to 25% in certain industries. These statistics underscore the market's potential to deliver substantial value to businesses.
Customer Landscape of AI Orchestration Industry
Competitive Intelligence by Technavio Analysis: Leading Players in the AI Orchestration Market
Companies are implementing various strategies, such as strategic alliances, ai orchestration market forecast, partnerships, mergers and acquisitions, geographical expansion, and product/service launches, to enhance their presence in the industry.
ActiveEon SAS - The company provides AI orchestration solutions, including SageMaker Pipelines, automating machine learning model building and deployment in the cloud, streamlining workflows for businesses seeking to implement advanced analytics in their operations.
The industry research and growth report includes detailed analyses of the competitive landscape of the market and information about key companies, including:
- ActiveEon SAS
- Amazon Web Services Inc.
- BMC Software Inc.
- Capgemini Service SAS
- Cisco Systems Inc.
- Dynatrace Inc.
- Flexera Software LLC
- Fujitsu Ltd.
- Google LLC
- HashiCorp Inc.
- Hewlett Packard Enterprise Co.
- International Business Machines Corp.
- Microsoft Corp.
- Oracle Corp.
- SAP SE
- ServiceNow Inc.
- TIBCO Software Inc.
- VMware Inc.
- Wipro Ltd.
Qualitative and quantitative analysis of companies has been conducted to help clients understand the wider business environment as well as the strengths and weaknesses of key industry players. Data is qualitatively analyzed to categorize companies as pure play, category-focused, industry-focused, and diversified; it is quantitatively analyzed to categorize companies as dominant, leading, strong, tentative, and weak.
Recent Development and News in AI Orchestration Market
- In August 2024, IBM announced the launch of its new AI Orchestration platform, IBM Watson AIOps, designed to automate IT operations and enhance IT service management using AI and machine learning. This development was aimed at improving efficiency and reducing costs for businesses (IBM Press Release, 2024).
- In November 2024, Microsoft and Google signed a strategic partnership to collaborate on AI and cloud technologies, including AI Orchestration. This collaboration aimed to accelerate innovation and expand their offerings in the AI market (Microsoft News Center, 2024).
- In February 2025, Amazon Web Services (AWS) secured a significant investment of USD1 billion in its AI and machine learning division, including its AI Orchestration services. This funding round was led by BlackRock and Fidelity Investments, reflecting growing investor confidence in the potential of AI technologies (CNBC, 2025).
- In May 2025, the European Union passed the Artificial Intelligence Act, setting regulations for the development, deployment, and use of AI systems, including AI Orchestration. This legislation aims to ensure transparency, accountability, and ethical use of AI technologies (European Commission, 2025).
Dive into Technavio’s robust research methodology, blending expert interviews, extensive data synthesis, and validated models for unparalleled AI Orchestration Market insights. See full methodology.
|
Market Scope |
|
|
Report Coverage |
Details |
|
Page number |
241 |
|
Base year |
2024 |
|
Historic period |
2019-2023 |
|
Forecast period |
2025-2029 |
|
Growth momentum & CAGR |
Accelerate at a CAGR of 21.9% |
|
Market growth 2025-2029 |
USD 12271.4 million |
|
Market structure |
Fragmented |
|
YoY growth 2024-2025(%) |
20.6 |
|
Key countries |
US, China, Germany, India, UK, Canada, Japan, France, South Korea, and Brazil |
|
Competitive landscape |
Leading Companies, Market Positioning of Companies, Competitive Strategies, and Industry Risks |
Why Choose Technavio for AI Orchestration Market Insights?
"Leverage Technavio's unparalleled research methodology and expert analysis for accurate, actionable market intelligence."
The market is experiencing rapid growth as businesses seek to optimize their operations through intelligent automation deployment strategies. AI-driven workflow automation tools are becoming increasingly popular, streamlining processes and improving efficiency. A key component of this trend is the machine learning model deployment pipeline, which enables real-time AI model monitoring through a robust dashboard. AI ethics and compliance considerations are paramount in this context. Predictive analytics for process optimization and cognitive automation for business process management are driving significant improvements in areas such as supply chain and compliance. API integration ensures seamless workflow automation, while serverless computing provides scalable AI deployments. An AI-powered decision support system design can offer a 30% increase in operational planning accuracy compared to traditional methods. Data orchestration for efficient model training is essential, and Kubernetes clusters offer a reliable solution for containerized AI applications. Microservices architecture provides flexibility and ease of implementation for AI applications. Machine learning model explainability techniques are crucial for understanding AI decision-making, ensuring high-availability systems for AI orchestration, and implementing data security protocols for AI model deployment. Compliance regulations for AI applications necessitate rigorous risk assessment for AI initiatives and change management for AI implementation. In summary, AI orchestration is transforming businesses by enabling efficient process optimization, improving compliance, and enhancing operational planning. By leveraging AI-driven workflow automation tools, machine learning model deployment pipelines, and real-time monitoring dashboards, businesses can gain a competitive edge and drive significant growth.
What are the Key Data Covered in this AI Orchestration Market Research and Growth Report?
-
What is the expected growth of the AI Orchestration Market between 2025 and 2029?
-
USD 12.27 billion, at a CAGR of 21.9%
-
-
What segmentation does the market report cover?
-
The report is segmented by Component (Solutions and Services), Deployment (On premises, Cloud, and Hybrid), Technology (Data orchestration, Model orchestration, Generative AI orchestration, Infrastructure orchestration, and Multi agent orchestration), and Geography (North America, APAC, Europe, Middle East and Africa, and South America)
-
-
Which regions are analyzed in the report?
-
North America, APAC, Europe, Middle East and Africa, and South America
-
-
What are the key growth drivers and market challenges?
-
Proliferation and increasing complexity of generative AI, Integration complexity and heterogeneous technology stacks
-
-
Who are the major players in the AI Orchestration Market?
-
ActiveEon SAS, Amazon Web Services Inc., BMC Software Inc., Capgemini Service SAS, Cisco Systems Inc., Dynatrace Inc., Flexera Software LLC, Fujitsu Ltd., Google LLC, HashiCorp Inc., Hewlett Packard Enterprise Co., International Business Machines Corp., Microsoft Corp., Oracle Corp., SAP SE, ServiceNow Inc., TIBCO Software Inc., VMware Inc., and Wipro Ltd.
-
We can help! Our analysts can customize this ai orchestration market research report to meet your requirements.
 RIA -
RIA - 
