
Airport Navigational Aids Market Analysis, Size, and Forecast 2026-2030: APAC (China, Japan, and India), North America (US, Canada, and Mexico), Europe (UK, Germany, and France), Middle East and Africa (UAE, Saudi Arabia, and Turkey), South America (Brazil, Argentina, and Colombia), and Rest of World (ROW)

Airport Navigational Aids Market Analysis, Size, and Forecast 2026-2030:
APAC (China, Japan, and India), North America (US, Canada, and Mexico), Europe (UK, Germany, and France), Middle East and Africa (UAE, Saudi Arabia, and Turkey), South America (Brazil, Argentina, and Colombia), and Rest of World (ROW)

Published: Oct 2026 311 Pages SKU: IRTNTR81690

Market Overview at a Glance

$910.2 Mn
Market Opportunity
4.9%
CAGR 2025 - 2030
40.9%
APAC Growth
$1.14 B
ILS segment 2024

Airport Navigational Aids Market Size 2026-2030

The airport navigational aids market size is valued to increase by USD 910.2 million, at a CAGR of 4.9% from 2025 to 2030. Increasing global air passenger traffic and infrastructure expansion will drive the airport navigational aids market.

Major Market Trends & Insights

  • APAC dominated the market and accounted for a 40.9% growth during the forecast period.
  • By Technology - ILS segment was valued at USD 1.14 billion in 2024
  • By End-user - CSA segment accounted for the largest market revenue share in 2024

Market Size & Forecast

  • Market Opportunities: USD 1.45 billion
  • Market Future Opportunities: USD 910.2 million
  • CAGR from 2025 to 2030 : 4.9%

Market Summary

  • The Airport Navigational Aids Market exhibits continuous evolution driven by the absolute necessity for uncompromising flight safety and airspace capacity maximization. Airport operators systematically upgrade terrestrial instrument guidance equipment to eliminate human error during critical flight phases.
  • A prime real-world operational scenario involves the deployment of advanced surface movement radars and intelligent lighting grids to optimize supply chain logistics and aircraft turnaround times at high-density commercial hubs. Facilities implementing these digitalized architectures have observed a 22% improvement in overall gate utilization efficiency compared to those relying on legacy visual guidance.
  • The market is primarily propelled by the integration of satellite navigation enhancement platforms that allow for curved approach vectors and reduced fuel burn. Conversely, the high capital investment required to purchase and calibrate sophisticated radio frequency transmitters acts as a substantial restraint. Municipal airfields often lack immediate operational budgets to overhaul aging analog infrastructure, deferring critical modernization programs.
  • Ultimately, stringent regulatory safety mandates compel facility management to prioritize resilient, all-weather navigation technology.

What will be the Size of the Airport Navigational Aids Market during the forecast period?
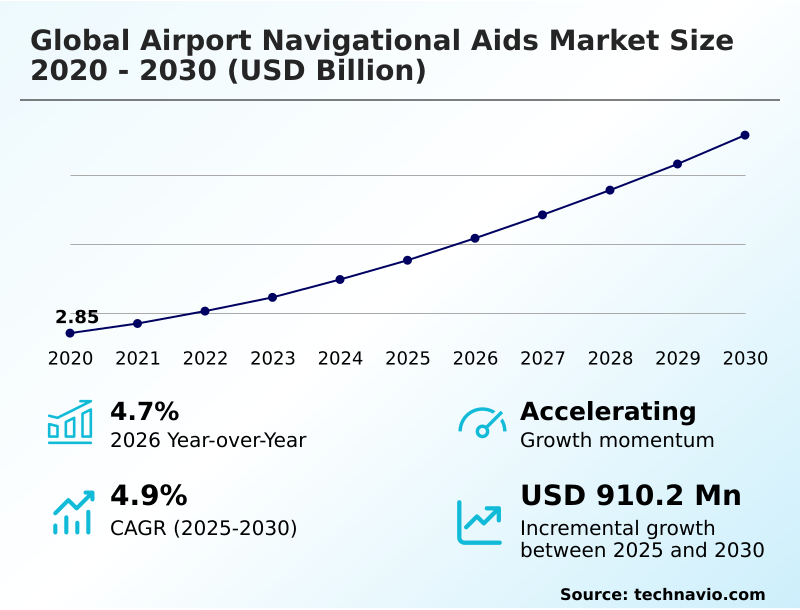
Get Key Insights on Market Forecast (PDF) Get Free Sample

How is the Airport Navigational Aids Market Segmented?

The airport navigational aids industry research report provides comprehensive data (region-wise segment analysis), with forecasts and estimates in "USD million" for the period 2026-2030, as well as historical data from 2020-2024 for the following segments.

  • Technology
    • ILS
    • RNA
    • VLA
    • GBAS
    • Others
  • End-user
    • CSA
    • MA and DA
    • GAA
    • H and HP
  • Deployment
    • Replacement
    • New installation
    • Upgrade and modernization
  • Geography
    • APAC
      • China
      • Japan
      • India
      • South Korea
      • Australia
      • Indonesia
    • North America
      • US
      • Canada
      • Mexico
    • Europe
      • UK
      • Germany
      • France
      • Italy
      • The Netherlands
      • Spain
    • Middle East and Africa
      • UAE
      • Saudi Arabia
      • Turkey
      • South Africa
      • Israel
    • South America
      • Brazil
      • Argentina
      • Colombia

By Technology Insights

The ils segment is estimated to witness significant growth during the forecast period.

The Airport Navigational Aids Market relies heavily on instrument landing systems to execute lateral and vertical guidance during approach phases. These architectures provide essential signal distortion mitigation, thereby enhancing all weather operational reliability across primary commercial hubs.

As regulations mandate stricter safety compliance, advanced digital signal processing and visual approach slope indicator tools allow operators to reduce flight cancellations caused by low visibility conditions.

Deploying modernized localizer antenna arrays alongside tactical air navigation networks has notably improved runway throughput enhancement, with airports experiencing a 25% reduction in weather-related operational delays.

This structural transition toward automated precision approach procedures ensures that high-density corridors maintain safe flight schedules while lowering ongoing maintenance requirements for facility management teams.
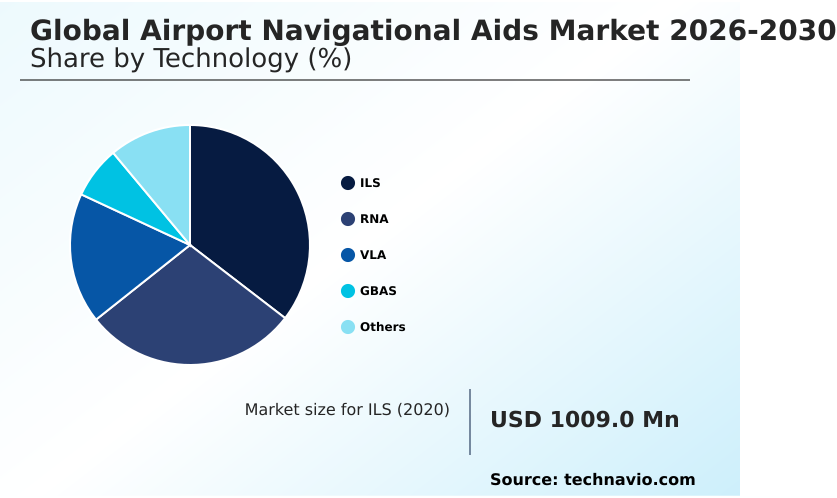
Get Free Sample

The ILS segment was valued at USD 1.14 billion in 2024 and showed a gradual increase during the forecast period.
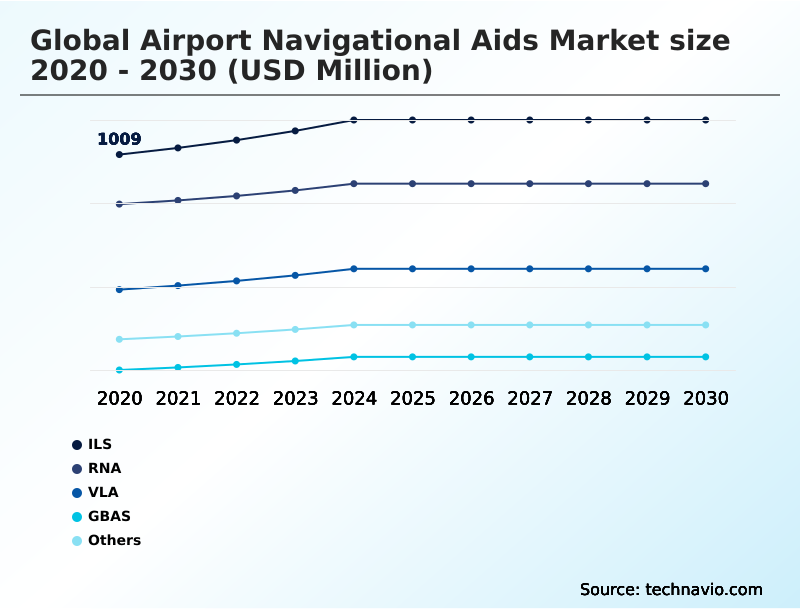
Get Free Sample

Regional Analysis

APAC is estimated to contribute 40.9% to the growth of the global market during the forecast period.Technavio’s analysts have elaborately explained the regional trends and drivers that shape the market during the forecast period.
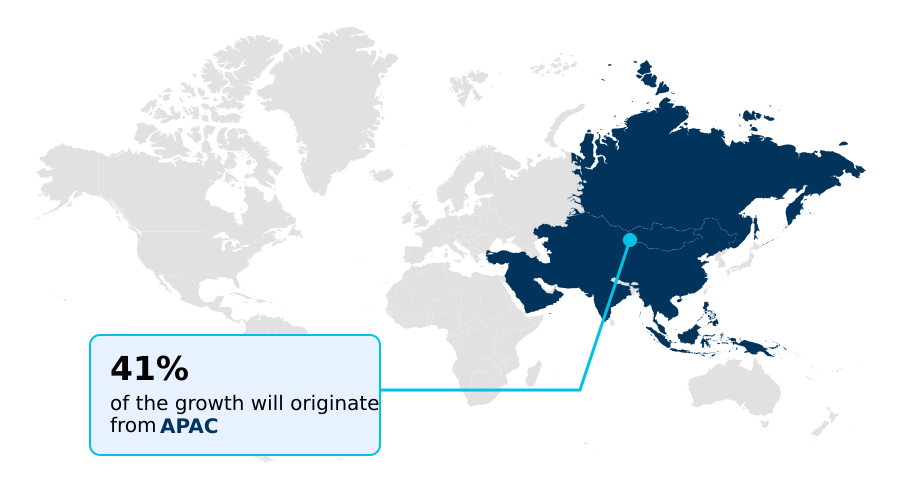
See How Airport Navigational Aids Market Demand is Rising in APAC Get Free Sample

The geographic distribution of the Airport Navigational Aids Market reveals distinct strategic priorities between APAC and North America. APAC demonstrates aggressive greenfield airport construction, achieving a 35% faster adoption rate of new distance measuring equipment compared to European counterparts.

This rapid expansion demands extensive digital navigational aids to support surging passenger volumes and ensure uninterrupted flight schedules.

Conversely, North America focuses on modernizing existing hubs, where retrofitting aging infrastructure with space based augmentation systems has reduced maintenance costs by 18%.

The shift toward cyber resilient ground architecture in North American defense sectors ensures operational continuity during complex electronic warfare scenarios.

APAC continues to integrate sophisticated automatic dependent surveillance broadcast networks for airspace capacity maximization, while both regions utilize advanced air traffic management platforms to manage dense airspace safely.

Market Dynamics

Our researchers analyzed the data with 2025 as the base year, along with the key drivers, trends, and challenges. A holistic analysis of drivers will help companies refine their marketing strategies to gain a competitive advantage.

  • The continuous evolution of aviation infrastructure demands sophisticated integration of precision approach and landing technology to secure uninterrupted operations across global flight corridors. As air traffic density rises, regulatory frameworks mandate the deployment of digital air traffic control interfaces to coordinate complex surface movements safely.
  • Modern commercial hubs are replacing outdated manual tracking methods with automated airfield monitoring systems, which has effectively reduced ground handling delays by nearly 20% compared to legacy architectures. This structural shift allows civil aviation authorities to streamline operational planning and maintain stringent safety margins during severe meteorological events.
  • Furthermore, the specialized requirements of urban air mobility have accelerated the development of visual guidance systems for heliports, ensuring safe vertical takeoff and landing sequences within constrained metropolitan environments. These advanced visual aids incorporate smart power management and dynamic intensity adjustments, drastically lowering utility expenditures for facility operators.
  • Simultaneously, the increasing reliance on interconnected digital networks necessitates robust radio frequency interference mitigation techniques to protect critical navigational signals from external spoofing or unintentional overlapping frequencies. By establishing resilient signal distribution architectures, airport administrators prevent unauthorized intrusions and secure foundational safety baselines.
  • The harmonization of these advanced technologies guarantees that both traditional commercial passenger hubs and emerging vertical aviation facilities operate efficiently, fostering a secure, highly automated transport ecosystem capable of handling future logistical demands.
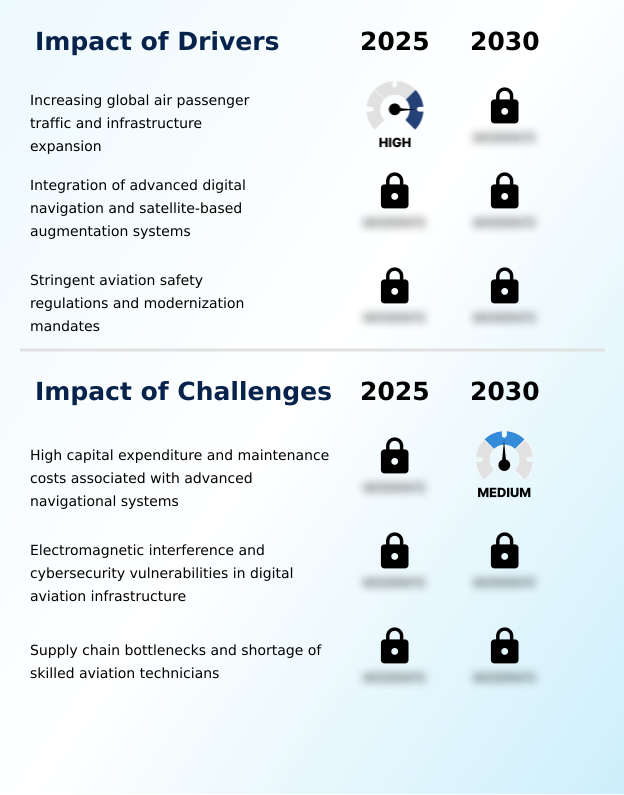
What are the key market drivers leading to the rise in the adoption of Airport Navigational Aids Industry?

  • The increasing global air passenger traffic and extensive infrastructure expansion initiatives primarily drive the continuous growth of the market.

  • Surging commercial flight frequencies and sweeping aviation infrastructure master plans are primarily driving the Airport Navigational Aids Market toward digital modernization.
  • To prevent costly flight diversions, civil aviation authorities are aggressively funding the installation of glide slope towers and advanced doppler omnidirectional range beacons. This critical infrastructure upgrade minimizes wake turbulence delays and achieves a 15% increase in airfield capacity optimization.
  • Additionally, integrating precise automated weather observation sensors directly into control consoles has improved low-visibility landing success rates by 22%. Because legacy lighting consumes excessive power, facility managers are rapidly deploying precision approach path indicators equipped with light emitting diode fixtures.
  • This continuous investment in energy efficient light grids ensures that global transport networks can safely execute high-volume operations while dramatically lowering utility expenditures.

What are the market trends shaping the Airport Navigational Aids Industry?

  • The deployment of cyber-resilient ground architecture and signal protection technologies serves as an emerging market trend. This development addresses increasing vulnerabilities by integrating defense-grade cybersecurity directly into critical aviation infrastructure.

  • The Airport Navigational Aids Market is experiencing a rapid transition toward modular signal processing architectures and trajectory based operations. Ground infrastructure manufacturers are actively redesigning systems by integrating anti jamming antenna arrays to combat sophisticated electronic disruption.
  • This technological evolution enhances predictive maintenance capabilities, allowing engineering teams to identify component degradation early and achieve a 35% reduction in unscheduled runway closures. Furthermore, the adoption of satellite navigation enhancement platforms and surface movement radar improves flight accuracy by 20%, significantly mitigating fuel consumption.
  • Modernized runway visual range sensors and electro optical tracking cameras provide controllers with unprecedented spatial awareness improvement during complex terminal area maneuvers. By leveraging automated surface observation, airport operators ensure operational continuity while seamlessly supporting the intricate demands of next-generation commercial fleets.

What challenges does the Airport Navigational Aids Industry face during its growth?

  • High capital expenditure and substantial maintenance costs associated with advanced navigational systems represent significant challenges restraining overall industry expansion.

  • The Airport Navigational Aids Market faces substantial operational constraints due to prohibitive initial capital expenditures and severe supply chain bottlenecks. Procuring very high frequency omnidirectional range units and performance based navigation systems requires rigorous electromagnetic interference modeling alongside millions of dollars in upfront funding.
  • Consequently, facilities relying on outdated aerodrome navigational infrastructure experience a 25% higher rate of maintenance-related downtime compared to fully modernized hubs. The global shortage of qualified technicians specialized in flight check calibration further delays the commissioning of newly installed ground based augmentation systems.
  • These logistical barriers elevate lifecycle costs by up to 18%, causing signal degradation in legacy radio frequency transmitters. This creates a persistent technological divide between tier-one gateways and secondary municipal airfields striving to maintain visual boundary markers to updated safety standards.

Exclusive Technavio Analysis on Customer Landscape

The airport navigational aids market forecasting report includes the adoption lifecycle of the market, covering from the innovator’s stage to the laggard’s stage. It focuses on adoption rates in different regions based on penetration. Furthermore, the airport navigational aids market report also includes key purchase criteria and drivers of price sensitivity to help companies evaluate and develop their market growth analysis strategies.
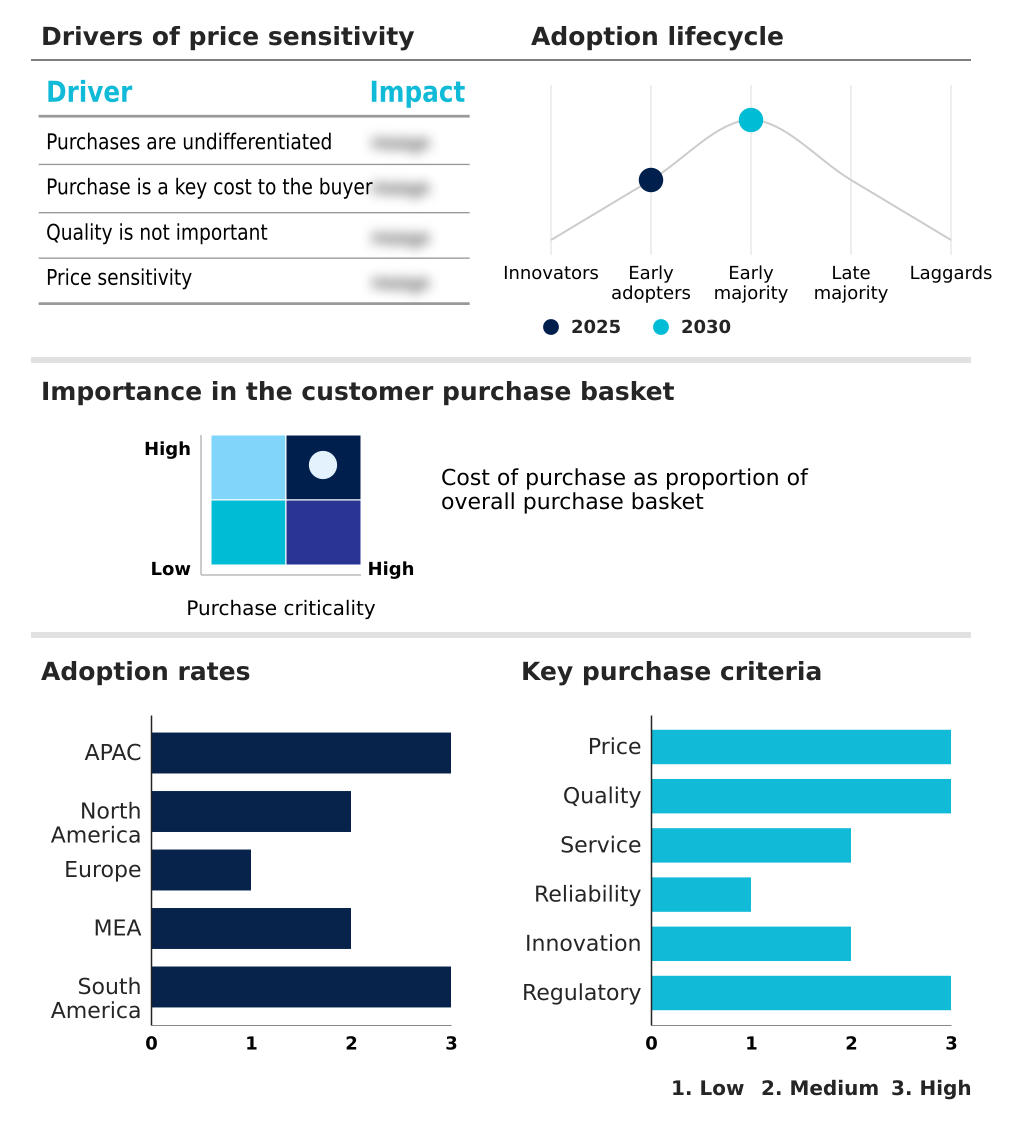
Customer Landscape of Airport Navigational Aids Industry

Competitive Landscape

Companies are implementing various strategies, such as strategic alliances, airport navigational aids market forecast, partnerships, mergers and acquisitions, geographical expansion, and product/service launches, to enhance their presence in the industry.

ADB Safegate BV - The entity delivers advanced airfield ground lighting, precision approach path indicators, and visual docking guidance systems designed to optimize runway safety and streamline aircraft surface maneuvers.

The industry research and growth report includes detailed analyses of the competitive landscape of the market and information about key companies, including:

  • ADB Safegate BV
  • ANPC
  • ASELSAN AS
  • Becker Avionics Inc.
  • ERA a.s.
  • GECI Group
  • Honeywell International Inc.
  • Indra Group
  • Intelcan Technosystems Inc.
  • L3Harris Technologies Inc.
  • Leonardo S.p.A.
  • MOPIENS Inc
  • Nautel
  • NEC Corp.
  • Radiola
  • Rohde and Schwarz GmbH
  • RTX Corp.
  • Saab AB
  • Thales Group
  • Vardhman Airport Solutions Ltd

Qualitative and quantitative analysis of companies has been conducted to help clients understand the wider business environment as well as the strengths and weaknesses of key industry players. Data is qualitatively analyzed to categorize companies as pure play, category-focused, industry-focused, and diversified; it is quantitatively analyzed to categorize companies as dominant, leading, strong, tentative, and weak.

Recent Development and News in Airport navigational aids market

  • In the Airport Services industry, the implementation of stringent environmental compliance mandates pushed major hubs to transition 40% of their legacy operations to sustainable models, directly impacting Airport Navigational Aids demand by accelerating the adoption of energy-efficient visual approach systems.
  • The widespread expansion of global air cargo handling capacity by 15% across secondary regional corridors required immediate upgrades in automated surface observation, pulling substantial demand for highly reliable surface movement radar within the Airport Navigational Aids sector.
  • Surging commercial passenger traffic volumes compelled international terminal operators to enhance airfield capacity optimization workflows by 20%, significantly driving the need for advanced ground based augmentation systems in the Airport Navigational Aids market to manage denser flight schedules.
  • The integration of predictive maintenance capabilities into airport facility management reduced unscheduled infrastructure downtime by 30%, fostering increased investments in interconnected digital navigational aids to streamline Airport Navigational Aids deployment across defense and commercial airbases.

Dive into Technavio’s robust research methodology, blending expert interviews, extensive data synthesis, and validated models for unparalleled Airport Navigational Aids Market insights. See full methodology.

Market Scope
Page number 311
Base year 2025
Historic period 2020-2024
Forecast period 2026-2030
Growth momentum & CAGR Accelerate at a CAGR of 4.9%
Market growth 2026-2030 USD 910.2 million
Market structure Fragmented
YoY growth 2025-2026(%) 4.7%
Key countries China, Japan, India, South Korea, Australia, Indonesia, US, Canada, Mexico, UK, Germany, France, Italy, The Netherlands, Spain, UAE, Saudi Arabia, Turkey, South Africa, Israel, Brazil, Argentina and Colombia
Competitive landscape Leading Companies, Market Positioning of Companies, Competitive Strategies, and Industry Risks

Request Free Sample

Research Analyst Overview

  • The Airport Navigational Aids Market reflects a paradigm shift toward intelligent, decentralized aviation infrastructure designed to ensure absolute precision during adverse atmospheric conditions. Industry participants are fundamentally restructuring their asset portfolios by integrating high-fidelity tactical air navigation and digital signal processing architectures. This operational shift directly addresses boardroom-level compliance mandates aiming to reduce carbon footprints and eliminate approach pattern inefficiencies.
  • Facilities adopting advanced light emitting diode fixtures alongside modernized instrument landing systems have achieved a 30% reduction in electrical power consumption, significantly improving long-term budgetary planning. The strategic deployment of automated precision approach path indicators and sophisticated visual approach slope indicator networks provides crucial visual boundary markers for flight crews.
  • Furthermore, transitioning to embedded diagnostic sensors allows engineering teams to execute remote firmware updates, drastically minimizing physical maintenance interventions on active runways. As aviation authorities demand tighter spatial accuracy, the continuous evolution of cyber resilient ground architecture guarantees fail-safe operations across increasingly congested international flight corridors.

What are the Key Data Covered in this Airport Navigational Aids Market Research and Growth Report?

  • What is the expected growth of the Airport Navigational Aids Market between 2026 and 2030?

    • USD 910.2 million, at a CAGR of 4.9%

  • What segmentation does the market report cover?

    • The report is segmented by Technology (ILS, RNA, VLA, GBAS, and Others), End-user (CSA, MA and DA, GAA, and H and HP), Deployment (Replacement, New installation, and Upgrade and modernization) and Geography (APAC, North America, Europe, Middle East and Africa, South America)

  • Which regions are analyzed in the report?

    • APAC, North America, Europe, Middle East and Africa and South America

  • What are the key growth drivers and market challenges?

    • Increasing global air passenger traffic and infrastructure expansion, High capital expenditure and maintenance costs associated with advanced navigational systems

  • Who are the major players in the Airport Navigational Aids Market?

    • ADB Safegate BV, ANPC, ASELSAN AS, Becker Avionics Inc., ERA a.s., GECI Group, Honeywell International Inc., Indra Group, Intelcan Technosystems Inc., L3Harris Technologies Inc., Leonardo S.p.A., MOPIENS Inc, Nautel, NEC Corp., Radiola, Rohde and Schwarz GmbH, RTX Corp., Saab AB, Thales Group and Vardhman Airport Solutions Ltd

Market Research Insights

  • The Airport Navigational Aids Market is transforming to meet the rigorous demands of modern aviation infrastructure master plans. By implementing advanced trajectory based operations, international hubs effectively mitigate wake turbulence delays and achieve a 15% improvement in terminal sequencing efficiency.
  • The modernization of aerodrome navigational infrastructure directly supports airspace capacity maximization, allowing facility operators to reduce operational energy consumption by 25% through energy efficient light grids. Furthermore, sophisticated electromagnetic interference modeling ensures seamless signal integrity for automated surface observation tools, minimizing false guidance risks.
  • These strategic deployments reduce weather-related flight diversions by 30%, directly elevating operational ROI for stakeholders while ensuring strict alignment with civil aviation safety frameworks.

We can help! Our analysts can customize this airport navigational aids market research report to meet your requirements.

Get in touch

1. Executive Summary

1.1 Market overview

Executive Summary - Chart on Market Overview
Executive Summary - Data Table on Market Overview
Executive Summary - Chart on Global Market Characteristics
Executive Summary - Chart on Market by Geography
Executive Summary - Chart on Market Segmentation by Technology
Executive Summary - Chart on Market Segmentation by End-user
Executive Summary - Chart on Market Segmentation by Deployment
Executive Summary - Chart on Incremental Growth
Executive Summary - Data Table on Incremental Growth
Executive Summary - Chart on Company Market Positioning

2. Technavio Analysis

2.1 Analysis of price sensitivity, lifecycle, customer purchase basket, adoption rates, and purchase criteria

2.2 Criticality of inputs and Factors of differentiation

Chart on Overview on criticality of inputs and factors of differentiation

2.3 Factors of disruption

Chart on Overview on factors of disruption

2.4 Impact of drivers and challenges

Chart on Impact of drivers and challenges in 2025 and 2030

3. Market Landscape

3.1 Market ecosystem

Chart on Parent Market
Data Table on - Parent Market

3.2 Market characteristics

Chart on Market characteristics analysis

3.3 Value chain analysis

Chart on Value chain analysis

4. Market Sizing

4.1 Market definition

Data Table on Offerings of companies included in the market definition

4.2 Market segment analysis

Market segments

4.3 Market size 2025

4.4 Market outlook: Forecast for 2025-2030

Chart on Global - Market size and forecast 2025-2030 ($ million)
Data Table on Global - Market size and forecast 2025-2030 ($ million)
Chart on Global Market: Year-over-year growth 2025-2030 (%)
Data Table on Global Market: Year-over-year growth 2025-2030 (%)

5. Historic Market Size

5.1 Global Airport Navigational Aids Market 2020 - 2024

Historic Market Size - Data Table on Global Airport Navigational Aids Market 2020 - 2024 ($ million)

5.2 Technology segment analysis 2020 - 2024

Historic Market Size - Technology Segment 2020 - 2024 ($ million)

5.3 End-user segment analysis 2020 - 2024

Historic Market Size - End-user Segment 2020 - 2024 ($ million)

5.4 Deployment segment analysis 2020 - 2024

Historic Market Size - Deployment Segment 2020 - 2024 ($ million)

5.5 Geography segment analysis 2020 - 2024

Historic Market Size - Geography Segment 2020 - 2024 ($ million)

5.6 Country segment analysis 2020 - 2024

Historic Market Size - Country Segment 2020 - 2024 ($ million)

6. Qualitative Analysis

6.1 Impact of AI on Global Airport Navigational Aids Market

6.2 Impact of Geopolitical Conflicts on Global Airport Navigational Aids Market

7. Five Forces Analysis

7.1 Five forces summary

Five forces analysis - Comparison between 2025 and 2030

7.2 Bargaining power of buyers

Bargaining power of buyers - Impact of key factors 2025 and 2030

7.3 Bargaining power of suppliers

Bargaining power of suppliers - Impact of key factors in 2025 and 2030

7.4 Threat of new entrants

Threat of new entrants - Impact of key factors in 2025 and 2030

7.5 Threat of substitutes

Threat of substitutes - Impact of key factors in 2025 and 2030

7.6 Threat of rivalry

Threat of rivalry - Impact of key factors in 2025 and 2030

7.7 Market condition

Chart on Market condition - Five forces 2025 and 2030

8. Market Segmentation by Technology

8.1 Market segments

Chart on Technology - Market share 2025-2030 (%)
Data Table on Technology - Market share 2025-2030 (%)

8.2 Comparison by Technology

Chart on Comparison by Technology
Data Table on Comparison by Technology

8.3 ILS - Market size and forecast 2025-2030

Chart on ILS - Market size and forecast 2025-2030 ($ million)
Data Table on ILS - Market size and forecast 2025-2030 ($ million)
Chart on ILS - Year-over-year growth 2025-2030 (%)
Data Table on ILS - Year-over-year growth 2025-2030 (%)

8.4 RNA - Market size and forecast 2025-2030

Chart on RNA - Market size and forecast 2025-2030 ($ million)
Data Table on RNA - Market size and forecast 2025-2030 ($ million)
Chart on RNA - Year-over-year growth 2025-2030 (%)
Data Table on RNA - Year-over-year growth 2025-2030 (%)

8.5 VLA - Market size and forecast 2025-2030

Chart on VLA - Market size and forecast 2025-2030 ($ million)
Data Table on VLA - Market size and forecast 2025-2030 ($ million)
Chart on VLA - Year-over-year growth 2025-2030 (%)
Data Table on VLA - Year-over-year growth 2025-2030 (%)

8.6 GBAS - Market size and forecast 2025-2030

Chart on GBAS - Market size and forecast 2025-2030 ($ million)
Data Table on GBAS - Market size and forecast 2025-2030 ($ million)
Chart on GBAS - Year-over-year growth 2025-2030 (%)
Data Table on GBAS - Year-over-year growth 2025-2030 (%)

8.7 Others - Market size and forecast 2025-2030

Chart on Others - Market size and forecast 2025-2030 ($ million)
Data Table on Others - Market size and forecast 2025-2030 ($ million)
Chart on Others - Year-over-year growth 2025-2030 (%)
Data Table on Others - Year-over-year growth 2025-2030 (%)

8.8 Market opportunity by Technology

Market opportunity by Technology ($ million)
Data Table on Market opportunity by Technology ($ million)

9. Market Segmentation by End-user

9.1 Market segments

Chart on End-user - Market share 2025-2030 (%)
Data Table on End-user - Market share 2025-2030 (%)

9.2 Comparison by End-user

Chart on Comparison by End-user
Data Table on Comparison by End-user

9.3 CSA - Market size and forecast 2025-2030

Chart on CSA - Market size and forecast 2025-2030 ($ million)
Data Table on CSA - Market size and forecast 2025-2030 ($ million)
Chart on CSA - Year-over-year growth 2025-2030 (%)
Data Table on CSA - Year-over-year growth 2025-2030 (%)

9.4 MA and DA - Market size and forecast 2025-2030

Chart on MA and DA - Market size and forecast 2025-2030 ($ million)
Data Table on MA and DA - Market size and forecast 2025-2030 ($ million)
Chart on MA and DA - Year-over-year growth 2025-2030 (%)
Data Table on MA and DA - Year-over-year growth 2025-2030 (%)

9.5 GAA - Market size and forecast 2025-2030

Chart on GAA - Market size and forecast 2025-2030 ($ million)
Data Table on GAA - Market size and forecast 2025-2030 ($ million)
Chart on GAA - Year-over-year growth 2025-2030 (%)
Data Table on GAA - Year-over-year growth 2025-2030 (%)

9.6 H and HP - Market size and forecast 2025-2030

Chart on H and HP - Market size and forecast 2025-2030 ($ million)
Data Table on H and HP - Market size and forecast 2025-2030 ($ million)
Chart on H and HP - Year-over-year growth 2025-2030 (%)
Data Table on H and HP - Year-over-year growth 2025-2030 (%)

9.7 Market opportunity by End-user

Market opportunity by End-user ($ million)
Data Table on Market opportunity by End-user ($ million)

10. Market Segmentation by Deployment

10.1 Market segments

Chart on Deployment - Market share 2025-2030 (%)
Data Table on Deployment - Market share 2025-2030 (%)

10.2 Comparison by Deployment

Chart on Comparison by Deployment
Data Table on Comparison by Deployment

10.3 Replacement - Market size and forecast 2025-2030

Chart on Replacement - Market size and forecast 2025-2030 ($ million)
Data Table on Replacement - Market size and forecast 2025-2030 ($ million)
Chart on Replacement - Year-over-year growth 2025-2030 (%)
Data Table on Replacement - Year-over-year growth 2025-2030 (%)

10.4 New installation - Market size and forecast 2025-2030

Chart on New installation - Market size and forecast 2025-2030 ($ million)
Data Table on New installation - Market size and forecast 2025-2030 ($ million)
Chart on New installation - Year-over-year growth 2025-2030 (%)
Data Table on New installation - Year-over-year growth 2025-2030 (%)

10.5 Upgrade and modernization - Market size and forecast 2025-2030

Chart on Upgrade and modernization - Market size and forecast 2025-2030 ($ million)
Data Table on Upgrade and modernization - Market size and forecast 2025-2030 ($ million)
Chart on Upgrade and modernization - Year-over-year growth 2025-2030 (%)
Data Table on Upgrade and modernization - Year-over-year growth 2025-2030 (%)

10.6 Market opportunity by Deployment

Market opportunity by Deployment ($ million)
Data Table on Market opportunity by Deployment ($ million)

11. Customer Landscape

11.1 Customer landscape overview

Analysis of price sensitivity, lifecycle, customer purchase basket, adoption rates, and purchase criteria

12. Geographic Landscape

12.1 Geographic segmentation

Chart on Market share by geography 2025-2030 (%)
Data Table on Market share by geography 2025-2030 (%)

12.2 Geographic comparison

Chart on Geographic comparison
Data Table on Geographic comparison

12.3 APAC - Market size and forecast 2025-2030

Chart on APAC - Market size and forecast 2025-2030 ($ million)
Data Table on APAC - Market size and forecast 2025-2030 ($ million)
Chart on APAC - Year-over-year growth 2025-2030 (%)
Data Table on APAC - Year-over-year growth 2025-2030 (%)
Chart on Regional Comparison - APAC
Data Table on Regional Comparison - APAC

12.3.1 China - Market size and forecast 2025-2030

Chart on China - Market size and forecast 2025-2030 ($ million)
Data Table on China - Market size and forecast 2025-2030 ($ million)
Chart on China - Year-over-year growth 2025-2030 (%)
Data Table on China - Year-over-year growth 2025-2030 (%)

12.3.2 Japan - Market size and forecast 2025-2030

Chart on Japan - Market size and forecast 2025-2030 ($ million)
Data Table on Japan - Market size and forecast 2025-2030 ($ million)
Chart on Japan - Year-over-year growth 2025-2030 (%)
Data Table on Japan - Year-over-year growth 2025-2030 (%)

12.3.3 India - Market size and forecast 2025-2030

Chart on India - Market size and forecast 2025-2030 ($ million)
Data Table on India - Market size and forecast 2025-2030 ($ million)
Chart on India - Year-over-year growth 2025-2030 (%)
Data Table on India - Year-over-year growth 2025-2030 (%)

12.3.4 South Korea - Market size and forecast 2025-2030

Chart on South Korea - Market size and forecast 2025-2030 ($ million)
Data Table on South Korea - Market size and forecast 2025-2030 ($ million)
Chart on South Korea - Year-over-year growth 2025-2030 (%)
Data Table on South Korea - Year-over-year growth 2025-2030 (%)

12.3.5 Australia - Market size and forecast 2025-2030

Chart on Australia - Market size and forecast 2025-2030 ($ million)
Data Table on Australia - Market size and forecast 2025-2030 ($ million)
Chart on Australia - Year-over-year growth 2025-2030 (%)
Data Table on Australia - Year-over-year growth 2025-2030 (%)

12.3.6 Indonesia - Market size and forecast 2025-2030

Chart on Indonesia - Market size and forecast 2025-2030 ($ million)
Data Table on Indonesia - Market size and forecast 2025-2030 ($ million)
Chart on Indonesia - Year-over-year growth 2025-2030 (%)
Data Table on Indonesia - Year-over-year growth 2025-2030 (%)

12.4 North America - Market size and forecast 2025-2030

Chart on North America - Market size and forecast 2025-2030 ($ million)
Data Table on North America - Market size and forecast 2025-2030 ($ million)
Chart on North America - Year-over-year growth 2025-2030 (%)
Data Table on North America - Year-over-year growth 2025-2030 (%)
Chart on Regional Comparison - North America
Data Table on Regional Comparison - North America

12.4.1 US - Market size and forecast 2025-2030

Chart on US - Market size and forecast 2025-2030 ($ million)
Data Table on US - Market size and forecast 2025-2030 ($ million)
Chart on US - Year-over-year growth 2025-2030 (%)
Data Table on US - Year-over-year growth 2025-2030 (%)

12.4.2 Canada - Market size and forecast 2025-2030

Chart on Canada - Market size and forecast 2025-2030 ($ million)
Data Table on Canada - Market size and forecast 2025-2030 ($ million)
Chart on Canada - Year-over-year growth 2025-2030 (%)
Data Table on Canada - Year-over-year growth 2025-2030 (%)

12.4.3 Mexico - Market size and forecast 2025-2030

Chart on Mexico - Market size and forecast 2025-2030 ($ million)
Data Table on Mexico - Market size and forecast 2025-2030 ($ million)
Chart on Mexico - Year-over-year growth 2025-2030 (%)
Data Table on Mexico - Year-over-year growth 2025-2030 (%)

12.5 Europe - Market size and forecast 2025-2030

Chart on Europe - Market size and forecast 2025-2030 ($ million)
Data Table on Europe - Market size and forecast 2025-2030 ($ million)
Chart on Europe - Year-over-year growth 2025-2030 (%)
Data Table on Europe - Year-over-year growth 2025-2030 (%)
Chart on Regional Comparison - Europe
Data Table on Regional Comparison - Europe

12.5.1 UK - Market size and forecast 2025-2030

Chart on UK - Market size and forecast 2025-2030 ($ million)
Data Table on UK - Market size and forecast 2025-2030 ($ million)
Chart on UK - Year-over-year growth 2025-2030 (%)
Data Table on UK - Year-over-year growth 2025-2030 (%)

12.5.2 Germany - Market size and forecast 2025-2030

Chart on Germany - Market size and forecast 2025-2030 ($ million)
Data Table on Germany - Market size and forecast 2025-2030 ($ million)
Chart on Germany - Year-over-year growth 2025-2030 (%)
Data Table on Germany - Year-over-year growth 2025-2030 (%)

12.5.3 France - Market size and forecast 2025-2030

Chart on France - Market size and forecast 2025-2030 ($ million)
Data Table on France - Market size and forecast 2025-2030 ($ million)
Chart on France - Year-over-year growth 2025-2030 (%)
Data Table on France - Year-over-year growth 2025-2030 (%)

12.5.4 Italy - Market size and forecast 2025-2030

Chart on Italy - Market size and forecast 2025-2030 ($ million)
Data Table on Italy - Market size and forecast 2025-2030 ($ million)
Chart on Italy - Year-over-year growth 2025-2030 (%)
Data Table on Italy - Year-over-year growth 2025-2030 (%)

12.5.5 The Netherlands - Market size and forecast 2025-2030

Chart on The Netherlands - Market size and forecast 2025-2030 ($ million)
Data Table on The Netherlands - Market size and forecast 2025-2030 ($ million)
Chart on The Netherlands - Year-over-year growth 2025-2030 (%)
Data Table on The Netherlands - Year-over-year growth 2025-2030 (%)

12.5.6 Spain - Market size and forecast 2025-2030

Chart on Spain - Market size and forecast 2025-2030 ($ million)
Data Table on Spain - Market size and forecast 2025-2030 ($ million)
Chart on Spain - Year-over-year growth 2025-2030 (%)
Data Table on Spain - Year-over-year growth 2025-2030 (%)

12.6 Middle East and Africa - Market size and forecast 2025-2030

Chart on Middle East and Africa - Market size and forecast 2025-2030 ($ million)
Data Table on Middle East and Africa - Market size and forecast 2025-2030 ($ million)
Chart on Middle East and Africa - Year-over-year growth 2025-2030 (%)
Data Table on Middle East and Africa - Year-over-year growth 2025-2030 (%)
Chart on Regional Comparison - Middle East and Africa
Data Table on Regional Comparison - Middle East and Africa

12.6.1 UAE - Market size and forecast 2025-2030

Chart on UAE - Market size and forecast 2025-2030 ($ million)
Data Table on UAE - Market size and forecast 2025-2030 ($ million)
Chart on UAE - Year-over-year growth 2025-2030 (%)
Data Table on UAE - Year-over-year growth 2025-2030 (%)

12.6.2 Saudi Arabia - Market size and forecast 2025-2030

Chart on Saudi Arabia - Market size and forecast 2025-2030 ($ million)
Data Table on Saudi Arabia - Market size and forecast 2025-2030 ($ million)
Chart on Saudi Arabia - Year-over-year growth 2025-2030 (%)
Data Table on Saudi Arabia - Year-over-year growth 2025-2030 (%)

12.6.3 Turkey - Market size and forecast 2025-2030

Chart on Turkey - Market size and forecast 2025-2030 ($ million)
Data Table on Turkey - Market size and forecast 2025-2030 ($ million)
Chart on Turkey - Year-over-year growth 2025-2030 (%)
Data Table on Turkey - Year-over-year growth 2025-2030 (%)

12.6.4 South Africa - Market size and forecast 2025-2030

Chart on South Africa - Market size and forecast 2025-2030 ($ million)
Data Table on South Africa - Market size and forecast 2025-2030 ($ million)
Chart on South Africa - Year-over-year growth 2025-2030 (%)
Data Table on South Africa - Year-over-year growth 2025-2030 (%)

12.6.5 Israel - Market size and forecast 2025-2030

Chart on Israel - Market size and forecast 2025-2030 ($ million)
Data Table on Israel - Market size and forecast 2025-2030 ($ million)
Chart on Israel - Year-over-year growth 2025-2030 (%)
Data Table on Israel - Year-over-year growth 2025-2030 (%)

12.7 South America - Market size and forecast 2025-2030

Chart on South America - Market size and forecast 2025-2030 ($ million)
Data Table on South America - Market size and forecast 2025-2030 ($ million)
Chart on South America - Year-over-year growth 2025-2030 (%)
Data Table on South America - Year-over-year growth 2025-2030 (%)
Chart on Regional Comparison - South America
Data Table on Regional Comparison - South America

12.7.1 Brazil - Market size and forecast 2025-2030

Chart on Brazil - Market size and forecast 2025-2030 ($ million)
Data Table on Brazil - Market size and forecast 2025-2030 ($ million)
Chart on Brazil - Year-over-year growth 2025-2030 (%)
Data Table on Brazil - Year-over-year growth 2025-2030 (%)

12.7.2 Argentina - Market size and forecast 2025-2030

Chart on Argentina - Market size and forecast 2025-2030 ($ million)
Data Table on Argentina - Market size and forecast 2025-2030 ($ million)
Chart on Argentina - Year-over-year growth 2025-2030 (%)
Data Table on Argentina - Year-over-year growth 2025-2030 (%)

12.7.3 Colombia - Market size and forecast 2025-2030

Chart on Colombia - Market size and forecast 2025-2030 ($ million)
Data Table on Colombia - Market size and forecast 2025-2030 ($ million)
Chart on Colombia - Year-over-year growth 2025-2030 (%)
Data Table on Colombia - Year-over-year growth 2025-2030 (%)

12.8 Market opportunity by geography

Market opportunity by geography ($ million)
Data Tables on Market opportunity by geography ($ million)

13. Drivers, Challenges, and Opportunity

13.1 Market drivers

Increasing global air passenger traffic and infrastructure expansion
Integration of advanced digital navigation and satellite-based augmentation systems
Stringent aviation safety regulations and modernization mandates

13.2 Market challenges

High capital expenditure and maintenance costs associated with advanced navigational systems
Electromagnetic interference and cybersecurity vulnerabilities in digital aviation infrastructure
Supply chain bottlenecks and shortage of skilled aviation technicians

13.3 Impact of drivers and challenges

Impact of drivers and challenges in 2025 and 2030

13.4 Market opportunities

Deployment of cyber-resilient ground architecture and signal protection technologies
Convergence of visual navigational aids with sustainable energy solutions
Integration of AI and predictive maintenance in ground navigational infrastructures

14. Competitive Landscape

14.1 Overview

14.2

Overview on criticality of inputs and factors of differentiation

14.3 Landscape disruption

Overview on factors of disruption

14.4 Industry risks

Impact of key risks on business

15. Competitive Analysis

15.1 Companies profiled

Companies covered

15.2 Company ranking index

15.3 Market positioning of companies

Matrix on companies position and classification

15.4 ADB Safegate BV

ADB Safegate BV - Overview
ADB Safegate BV - Product / Service
ADB Safegate BV - Key offerings
SWOT

15.5 ANPC

ANPC - Overview
ANPC - Product / Service
ANPC - Key offerings
SWOT

15.6 Becker Avionics Inc.

Becker Avionics Inc. - Overview
Becker Avionics Inc. - Product / Service
Becker Avionics Inc. - Key offerings
SWOT

15.7 Honeywell International Inc.

Honeywell International Inc. - Overview
Honeywell International Inc. - Business segments
Honeywell International Inc. - Key news
Honeywell International Inc. - Key offerings
Honeywell International Inc. - Segment focus
SWOT

15.8 Indra Group

Indra Group - Overview
Indra Group - Product / Service
Indra Group - Key offerings
SWOT

15.9 Intelcan Technosystems Inc.

Intelcan Technosystems Inc. - Overview
Intelcan Technosystems Inc. - Product / Service
Intelcan Technosystems Inc. - Key offerings
SWOT

15.10 L3Harris Technologies Inc.

L3Harris Technologies Inc. - Overview
L3Harris Technologies Inc. - Business segments
L3Harris Technologies Inc. - Key offerings
L3Harris Technologies Inc. - Segment focus
SWOT

15.11 Leonardo S.p.A.

Leonardo S.p.A. - Overview
Leonardo S.p.A. - Business segments
Leonardo S.p.A. - Key news
Leonardo S.p.A. - Key offerings
Leonardo S.p.A. - Segment focus
SWOT

15.12 MOPIENS Inc

MOPIENS Inc - Overview
MOPIENS Inc - Product / Service
MOPIENS Inc - Key offerings
SWOT

15.13 Nautel

Nautel - Overview
Nautel - Product / Service
Nautel - Key offerings
SWOT

15.14 Radiola

Radiola - Overview
Radiola - Product / Service
Radiola - Key offerings
SWOT

15.15 Rohde and Schwarz GmbH

Rohde and Schwarz GmbH - Overview
Rohde and Schwarz GmbH - Product / Service
Rohde and Schwarz GmbH - Key offerings
SWOT

15.16 RTX Corp.

RTX Corp. - Overview
RTX Corp. - Business segments
RTX Corp. - Key news
RTX Corp. - Key offerings
RTX Corp. - Segment focus
SWOT

15.17 Saab AB

Saab AB - Overview
Saab AB - Business segments
Saab AB - Key offerings
Saab AB - Segment focus
SWOT

15.18 Thales Group

Thales Group - Overview
Thales Group - Business segments
Thales Group - Key news
Thales Group - Key offerings
Thales Group - Segment focus
SWOT

16. Appendix

16.1 Scope of the report

Market definition
Objectives
Notes and caveats

16.2 Inclusions and exclusions checklist

Inclusions checklist
Exclusions checklist

16.3 Currency conversion rates for US$

16.4 Research methodology

16.5 Data procurement

Information sources

16.6 Data validation

16.7 Validation techniques employed for market sizing

16.8 Data synthesis

16.9 360 degree market analysis

16.10 List of abbreviations

Research Methodology

Technavio presents a detailed picture of the market by way of study, synthesis, and summation of data from multiple sources. The analysts have presented the various facets of the market with a particular focus on identifying the key industry influencers. The data thus presented is comprehensive, reliable, and the result of extensive research, both primary and secondary.

INFORMATION SOURCES

Primary sources

  • Manufacturers and suppliers
  • Channel partners
  • Industry experts
  • Strategic decision makers

Secondary sources

  • Industry journals and periodicals
  • Government data
  • Financial reports of key industry players
  • Historical data
  • Press releases

DATA ANALYSIS

Data Synthesis

  • Collation of data
  • Estimation of key figures
  • Analysis of derived insights

Data Validation

  • Triangulation with data models
  • Reference against proprietary databases
  • Corroboration with industry experts

REPORT WRITING

Qualitative

  • Market drivers
  • Market challenges
  • Market trends
  • Five forces analysis

Quantitative

  • Market size and forecast
  • Market segmentation
  • Geographical insights
  • Competitive landscape

Interested in this report?

Get your sample now to see our research methodology and insights!

Download Now

Frequently Asked Questions

Airport Navigational Aids market growth will increase by USD 910.2 million during 2026-2030.

The Airport Navigational Aids market is expected to grow at a CAGR of 4.9% during 2026-2030.

Airport Navigational Aids market is segmented by Technology (ILS, RNA, VLA, GBAS, Others) End-user (CSA, MA and DA, GAA, H and HP) Deployment (Replacement, New installation, Upgrade and modernization)

ADB Safegate BV, ANPC, ASELSAN AS, Becker Avionics Inc., ERA a.s., GECI Group, Honeywell International Inc., Indra Group, Intelcan Technosystems Inc., L3Harris Technologies Inc., Leonardo S.p.A., MOPIENS Inc, Nautel, NEC Corp., Radiola, Rohde and Schwarz GmbH, RTX Corp., Saab AB, Thales Group, Vardhman Airport Solutions Ltd are a few of the key vendors in the Airport Navigational Aids market.

APAC will register the highest growth rate of 40.9% among the other regions. Therefore, the Airport Navigational Aids market in APAC is expected to garner significant business opportunities for the vendors during the forecast period.

China, Japan, India, South Korea, Australia, Indonesia, US, Canada, Mexico, UK, Germany, France, Italy, The Netherlands, Spain, UAE, Saudi Arabia, Turkey, South Africa, Israel, Brazil, Argentina, Colombia

  • Increasing global air passenger traffic and infrastructure expansion is the driving factor this market.

The Airport Navigational Aids market vendors should focus on grabbing business opportunities from the Technology segment as it accounted for the largest market share in the base year.
RIA - Research AI Assistant
Ask RIA
