
Alpha Lactalbumin Market Size 2026-2030
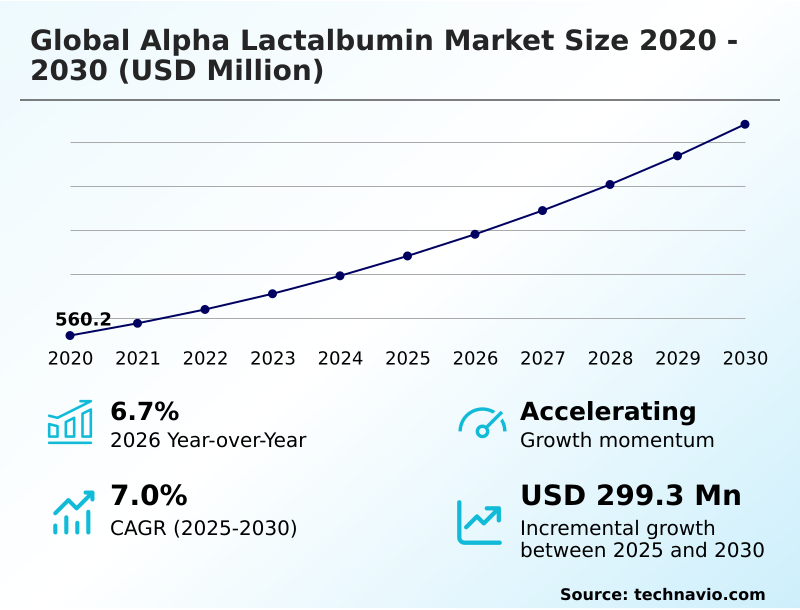
The alpha lactalbumin market size is valued to increase by USD 299.3 million, at a CAGR of 7% from 2025 to 2030. Surging demand for humanized infant nutrition will drive the alpha lactalbumin market.
Major Market Trends & Insights
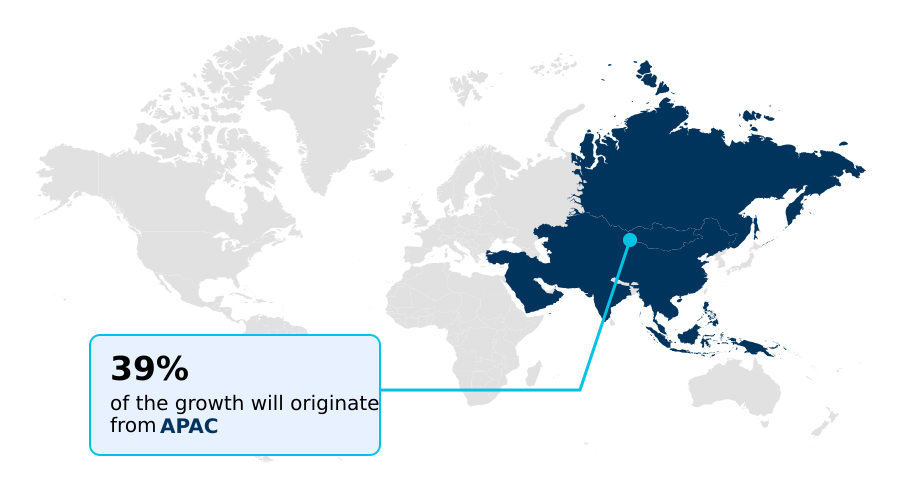
- APAC dominated the market and accounted for a 38.7% growth during the forecast period.
- By Type - Human alpha lactalbumin segment was valued at USD 448.9 million in 2024
- By Application - Food and beverage industry segment accounted for the largest market revenue share in 2024
Market Size & Forecast
- Market Opportunities: USD 480.1 million
- Market Future Opportunities: USD 299.3 million
- CAGR from 2025 to 2030 : 7%
Market Summary
- The alpha lactalbumin market is undergoing a significant transformation, driven by the increasing demand for high-value, functional ingredients in specialized nutrition. The primary impetus stems from the infant nutrition sector, where manufacturers strive to humanize bovine milk formulas by incorporating alpha-lactalbumin to mirror the protein profile of human breast milk.
- This enhances digestibility and provides essential amino acids crucial for neonatal development. Beyond pediatrics, applications are expanding into clinical and sports nutrition, leveraging the protein's unique properties to support cognitive function, immune response, and stress management.
- A key trend shaping the landscape is the rise of precision fermentation, enabling the production of bio-identical human alpha-lactalbumin, which offers a hypoallergenic and ethically sourced alternative.
- For instance, a food and beverage company is navigating this shift by reformulating its premium product line, a strategic decision requiring substantial investment in R&D and new supply chain partnerships to source these novel ingredients.
- This move aims to capture a growing consumer segment focused on clean-label and scientifically-backed products, even though it confronts the challenge of high production costs associated with advanced purification technologies.
What will be the Size of the Alpha Lactalbumin Market during the forecast period?
Get Key Insights on Market Forecast (PDF) Get Free Sample
How is the Alpha Lactalbumin Market Segmented?
The alpha lactalbumin industry research report provides comprehensive data (region-wise segment analysis), with forecasts and estimates in "USD million" for the period 2026-2030, as well as historical data from 2020-2024 for the following segments.
- Type
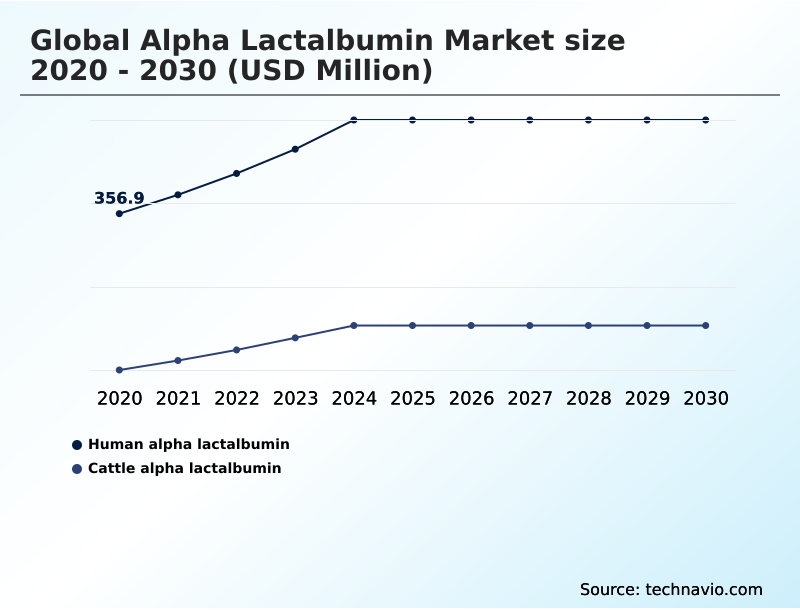
- Human alpha lactalbumin
- Cattle alpha lactalbumin
- Application
- Food and beverage industry
- Pharmaceutical industry
- Nutraceuticals industry
- Product type
- Infant formula
- Dietary supplements
- Others
- Geography
- APAC
- China
- Japan
- India
- North America
- US
- Canada
- Mexico
- Europe
- Germany
- UK
- France
- South America
- Brazil
- Argentina
- Colombia
- Middle East and Africa
- South Africa
- Saudi Arabia
- UAE
- Rest of World (ROW)
- APAC
By Type Insights
The human alpha lactalbumin segment is estimated to witness significant growth during the forecast period.
The market is segmented by type, notably between bovine-derived and human-identical proteins, and by application, including food, pharmaceutical, and nutraceutical industries. Human alpha lactalbumin, produced via advanced biotechnological processes, is gaining prominence.
This segment focuses on delivering bioactive solutions that offer enhanced mineral absorption and support immune responses, addressing the rising consumer demand for functional ingredients.
Formulations are increasingly targeting specific health outcomes such as stress management and improved sleep and mood patterns, moving beyond basic nutrition.
The development of enriched whey proteins and soluble milk protein variants with reduced allergenicity is critical, with some processes achieving a 99% reduction in key allergenic compounds, thereby expanding applications into sensitive nutritional supplements and cognitive performance products for healthy aging.
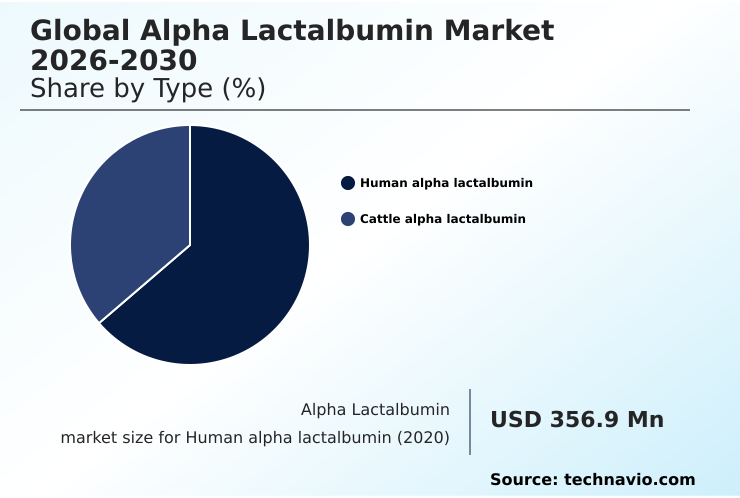
The Human alpha lactalbumin segment was valued at USD 448.9 million in 2024 and showed a gradual increase during the forecast period.
Regional Analysis
APAC is estimated to contribute 38.7% to the growth of the global market during the forecast period.Technavio’s analysts have elaborately explained the regional trends and drivers that shape the market during the forecast period.
See How Alpha Lactalbumin Market Demand is Rising in APAC Get Free Sample
The geographic landscape of the alpha lactalbumin market is led by APAC, which is projected to account for nearly 39% of the industry's incremental growth.
This expansion is driven by stringent national food safety standards and a strong clean-label movement in countries like China, fueling demand for high-purity ingredients in infant nutrition.
North America follows, representing approximately 25% of the growth opportunity, with a focus on clinical nutrition and sports nutrition applications leveraging lactoferrin and MFGM.
In mature markets such as Europe, innovation is geared toward functional foods for healthy aging, addressing sarcopenia and cognitive decline.
The reliance on high-purity whey fractions is universal, with manufacturers globally sourcing milk fat globule membranes to enhance product efficacy and meet consumer expectations.
Market Dynamics
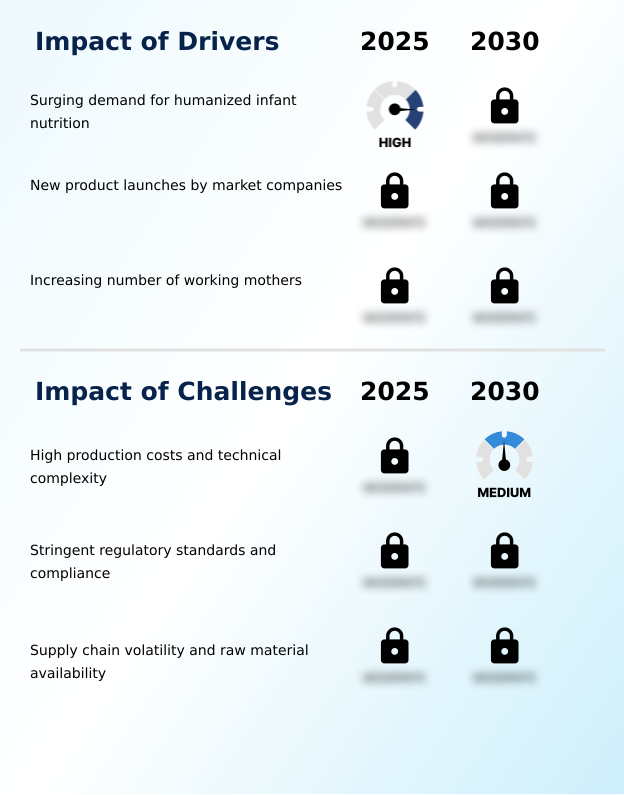
Our researchers analyzed the data with 2025 as the base year, along with the key drivers, trends, and challenges. A holistic analysis of drivers will help companies refine their marketing strategies to gain a competitive advantage.
- The alpha lactalbumin market is evolving rapidly, extending its reach far beyond its foundational role in infant nutrition. While the use of alpha lactalbumin for infant nutrition remains the primary driver, its application in sports nutrition is growing, leveraging its unique amino acid profile for muscle recovery and performance.
- The frontier of this expansion is precision fermentation for alpha lactalbumin, a technology enabling sustainable alpha lactalbumin production that is bio-identical to human variants. This innovation directly addresses consumer demand for hypoallergenic infant formula ingredients by facilitating the process of reducing beta-lactoglobulin in whey. Consequently, products supporting cognitive wellness and sleep regulation are emerging as high-growth segments.
- The functional properties of alpha lactalbumin are also being harnessed in medical foods and functional beverages designed for gut health and immune support. The strategic debate comparing bovine alpha lactalbumin vs human versions is intensifying, influenced by factors like tryptophan enrichment with alpha lactalbumin for neurological benefits.
- However, the alpha lactalbumin price volatility impact remains a significant concern for supply chain managers.
- Firms adopting advanced fractionation of whey proteins have reported yield efficiencies up to 40% higher than those using conventional methods, a critical advantage in managing production costs and ensuring the consistent availability of this premium ingredient for applications ranging from elderly nutrition to enhancing mineral bioavailability.
What are the key market drivers leading to the rise in the adoption of Alpha Lactalbumin Industry?
- The surging demand for humanized infant nutrition, aimed at closely replicating the biochemical composition of breast milk, is the key driver of market growth.
- The primary market driver is the scientific pursuit of infant formula humanization. Formulations are increasingly sophisticated, leveraging bioactive protein to replicate the amino acid profile of human milk, with a specific focus on tryptophan and cysteine for neonatal nutrition.
- This drive for biochemical mimicry enhances digestibility and supports neurological development. Leading manufacturers have developed an optimized protein matrix that improves gastric comfort, resulting in a clinically demonstrated 20% reduction in gastrointestinal discomfort.
- The focus on super-premium formulations is intensifying as consumer awareness grows, with products highlighting benefits like improved gut comfort now commanding a 15% price premium.
- This trend to humanize bovine milk formulas is compelling industry-wide investment in sourcing and processing high-purity protein fractions.
What are the market trends shaping the Alpha Lactalbumin Industry?
- A key market trend is the emergence of precision fermentation technologies, enabling the production of human-identical proteins for advanced nutritional applications.
- A transformative trend reshaping the industry is the rapid advancement in producing bio-identical proteins. The emergence of precision fermentation and cellular agriculture allows for the creation of human-identical milk proteins, marking a significant departure from the traditional whey protein fraction.
- This innovation, based on recombinant DNA technology, yields bio-identical human alpha-lactalbumin that is inherently free from beta-lactoglobulin, a primary allergen in bovine milk. The resulting hypoallergenic ingredient is gaining traction in premium infant formulas, with adoption rates in new product launches increasing by over 40% in the last year.
- This shift addresses supply chain volatility associated with dairy and appeals to consumers seeking animal-free dairy options, positioning whey protein concentrate alternatives for substantial growth.
What challenges does the Alpha Lactalbumin Industry face during its growth?
- High production costs and the technical complexity associated with protein isolation and purification present a key challenge affecting industry growth and wider market adoption.
- A significant market challenge stems from the high costs and technical hurdles of producing high-purity isolates. The process requires advanced fractionation and purification technologies, such as membrane filtration and ion-exchange chromatography, to achieve high purity levels. These chromatography technologies are capital-intensive and contribute to a final product cost that can be up to three times higher than standard whey protein.
- The reliance on cheese whey as a raw material introduces price volatility, making financial planning difficult. Consequently, alpha-lactalbumin is often cost-prohibitive for mass-market applications, confining its use to specialized medical foods and premium segments. This economic reality is a primary barrier to wider adoption, despite the clear functional benefits of the protein portfolio.
Exclusive Technavio Analysis on Customer Landscape
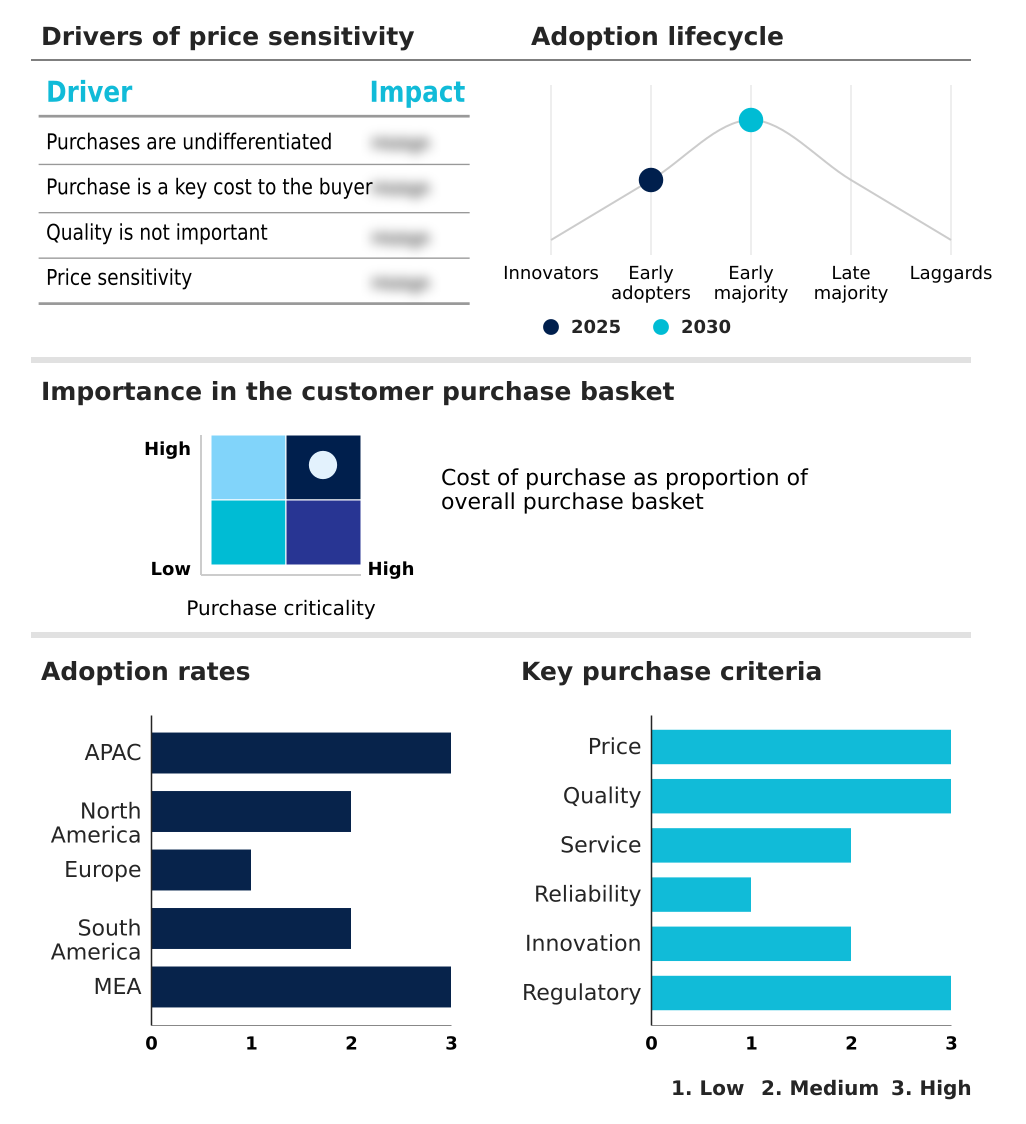
The alpha lactalbumin market forecasting report includes the adoption lifecycle of the market, covering from the innovator’s stage to the laggard’s stage. It focuses on adoption rates in different regions based on penetration. Furthermore, the alpha lactalbumin market report also includes key purchase criteria and drivers of price sensitivity to help companies evaluate and develop their market growth analysis strategies.
Customer Landscape of Alpha Lactalbumin Industry
Competitive Landscape
Companies are implementing various strategies, such as strategic alliances, alpha lactalbumin market forecast, partnerships, mergers and acquisitions, geographical expansion, and product/service launches, to enhance their presence in the industry.
Agropur Dairy Cooperative - Delivers high-purity alpha-lactalbumin isolates engineered for critical infant and medical nutritional applications, enhancing bioactive value and formulation efficacy.
The industry research and growth report includes detailed analyses of the competitive landscape of the market and information about key companies, including:
- Agropur Dairy Cooperative
- Arla Foods Ingredients Group PS
- Carbery Food Ingredients Ltd.
- EPI INGREDIENTS
- EUROSERUM
- Farbest Brands
- Fonterra Cooperative Group Ltd.
- Glanbia plc
- Groupe Lactalis
- Hilmar Cheese Co. Inc.
- Hoogwegt
- Kerry Group Plc
- Leprino Foods Co.
- MILEI GmbH
- Milk Specialties Global
- Morinaga Milk Industry
- Nestle SA
- Prolactal GmbH
- Royal Friesland Campina NV
Qualitative and quantitative analysis of companies has been conducted to help clients understand the wider business environment as well as the strengths and weaknesses of key industry players. Data is qualitatively analyzed to categorize companies as pure play, category-focused, industry-focused, and diversified; it is quantitatively analyzed to categorize companies as dominant, leading, strong, tentative, and weak.
Recent Development and News in Alpha lactalbumin market
- In September, 2024, Arla Foods Ingredients completed its acquisition of Volac's Whey Nutrition business, a move designed to strengthen its global position in high-value whey ingredients and expand its capacity for specialized protein fractions.
- In January, 2025, Arla Foods Ingredients launched a new Comfort protein blend for the Chinese market, specifically highlighting its high concentration of alpha-lactalbumin to clinically support reduced crying times and improved sleep in infants.
- In February, 2025, TurtleTree announced a strategic commercial manufacturing partnership to scale up production of its precision-fermentation-derived alpha-lactalbumin, aiming to supply major infant formula brands with a sustainable, human-identical protein source.
- In April, 2025, Kerry Group Plc issued a strategic update indicating that rising energy prices and processing complexities necessitated a price increase for its specialized protein portfolio, specifically affecting its high-purity alpha-lactalbumin isolates.
Dive into Technavio’s robust research methodology, blending expert interviews, extensive data synthesis, and validated models for unparalleled Alpha Lactalbumin Market insights. See full methodology.
| Market Scope | |
|---|---|
| Page number | 283 |
| Base year | 2025 |
| Historic period | 2020-2024 |
| Forecast period | 2026-2030 |
| Growth momentum & CAGR | Accelerate at a CAGR of 7% |
| Market growth 2026-2030 | USD 299.3 million |
| Market structure | Fragmented |
| YoY growth 2025-2026(%) | 6.7% |
| Key countries | China, Japan, India, South Korea, Australia, Indonesia, US, Canada, Mexico, Germany, UK, France, Italy, The Netherlands, Spain, Brazil, Argentina, Colombia, South Africa, Saudi Arabia, UAE, Egypt and Turkey |
| Competitive landscape | Leading Companies, Market Positioning of Companies, Competitive Strategies, and Industry Risks |
Research Analyst Overview
- The alpha lactalbumin market is defined by a strategic pivot from commodity whey to high-value bioactive protein fractions. This evolution is driven by sophisticated applications in infant nutrition, clinical nutrition, and sports nutrition, where a precise amino acid profile is critical.
- The boardroom-level decision facing manufacturers is whether to invest heavily in in-house advanced fractionation and purification technologies or to form strategic alliances with biotech firms pioneering precision fermentation and cellular agriculture. These emerging methods promise to deliver bio-identical human alpha-lactalbumin, effectively eliminating concerns of allergenicity from beta-lactoglobulin and enhancing digestibility.
- The use of ion-exchange chromatography has been shown to improve purity levels by over 15% compared to older filtration techniques. This technological advantage allows for the creation of high-purity ingredients with specific functionalities, such as supporting neurotransmitter synthesis for sleep and mood patterns or enhancing mineral absorption.
- As the market matures, differentiation will depend on the ability to produce functional protein and bioactive solutions like lactoferrin and MFGM that offer scientifically validated benefits for neonatal nutrition and beyond.
What are the Key Data Covered in this Alpha Lactalbumin Market Research and Growth Report?
-
What is the expected growth of the Alpha Lactalbumin Market between 2026 and 2030?
-
USD 299.3 million, at a CAGR of 7%
-
-
What segmentation does the market report cover?
-
The report is segmented by Type (Human alpha lactalbumin, and Cattle alpha lactalbumin), Application (Food and beverage industry, Pharmaceutical industry, and Nutraceuticals industry), Product Type (Infant formula, Dietary supplements, and Others) and Geography (APAC, North America, Europe, South America, Middle East and Africa)
-
-
Which regions are analyzed in the report?
-
APAC, North America, Europe, South America and Middle East and Africa
-
-
What are the key growth drivers and market challenges?
-
Surging demand for humanized infant nutrition, High production costs and technical complexity
-
-
Who are the major players in the Alpha Lactalbumin Market?
-
Agropur Dairy Cooperative, Arla Foods Ingredients Group PS, Carbery Food Ingredients Ltd., EPI INGREDIENTS, EUROSERUM, Farbest Brands, Fonterra Cooperative Group Ltd., Glanbia plc, Groupe Lactalis, Hilmar Cheese Co. Inc., Hoogwegt, Kerry Group Plc, Leprino Foods Co., MILEI GmbH, Milk Specialties Global, Morinaga Milk Industry, Nestle SA, Prolactal GmbH and Royal Friesland Campina NV
-
Market Research Insights
- The market's momentum is driven by a strategic shift toward high-value functional ingredients. The emphasis on infant formula humanization compels manufacturers to adopt premium ingredients, with formulations utilizing optimized protein matrix blends showing a 25% improvement in gastric comfort markers. Concurrently, the clean-label movement is influencing procurement, pushing for greater transparency.
- Innovations in chromatography technologies are enabling the production of high-purity isolates that are virtually free of allergenic compounds. This technical progress supports expansion into specialized medical foods and products targeting cognitive performance and stress management.
- As a result, the adoption of enriched whey proteins in new product development has increased by over 30% in specialized adult nutrition segments, reflecting a broadening application scope beyond pediatric use.
We can help! Our analysts can customize this alpha lactalbumin market research report to meet your requirements.
 RIA -
RIA - 
