


APAC Edible Meat Market Size 2026-2030
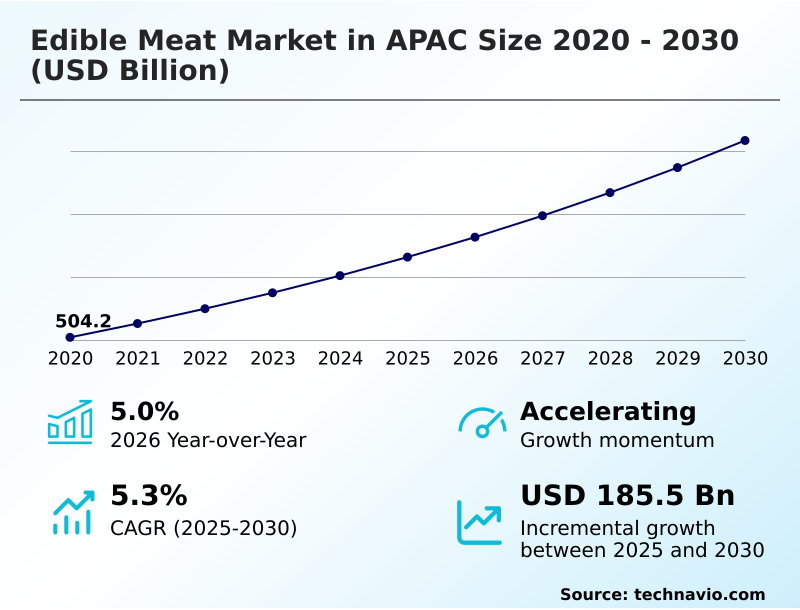
The apac edible meat market size is valued to increase by USD 185.5 billion, at a CAGR of 5.3% from 2025 to 2030. Rapid increasing and changing dietary patterns will drive the apac edible meat market.
Major Market Trends & Insights
- By Distribution Channel - Offline segment was valued at USD 561.2 billion in 2024
- By Product - Poultry segment accounted for the largest market revenue share in 2024
Market Size & Forecast
- Market Opportunities: USD 313.2 billion
- Market Future Opportunities: USD 185.5 billion
- CAGR from 2025 to 2030 : 5.3%
Market Summary
- The Edible Meat Market operates as a highly integrated agricultural and logistical network, continuously evolving to meet escalating urban protein demands. Operational efficiency relies heavily on synchronized supply chain execution. For example, large-scale processing facilities frequently implement automated temperature monitoring across storage hubs, enabling a 15% improvement in energy efficiency while drastically reducing bacterial contamination risks during peak production shifts.
- This modernization is primarily driven by rapidly changing dietary patterns, as rising middle-class populations increasingly substitute grain-heavy diets with premium lean meats, compelling retailers to expand their refrigerated inventory footprints. Conversely, unpredictable fluctuations in raw material prices, particularly concerning livestock feed components, present a severe challenge.
- Surging grain costs force producers to absorb diminished margins or pass expenses downstream, occasionally contracting retail demand. As modern hypermarkets and food service networks demand absolute supply consistency, industry participants must balance volatile procurement costs against stringent sanitary compliance, ensuring uninterrupted delivery of high-quality animal proteins to rapidly modernizing urban centers.
What will be the Size of the APAC Edible Meat Market during the forecast period?
Get Key Insights on Market Forecast (PDF) Get Free Sample
How is the APAC Edible Meat Market Segmented?
The apac edible meat industry research report provides comprehensive data (region-wise segment analysis), with forecasts and estimates in "USD billion" for the period 2026-2030, as well as historical data from 2020-2024 for the following segments.
- Distribution channel
- Offline
- Online
- Product
- Poultry
- Sheep and goats
- Beef
- Pork
- Others
- Product type
- Frozen
- Fresh
- Processed
- Canned
- Geography
- APAC
- China
- Japan
- India
- Australia
- APAC
By Distribution Channel Insights
The offline segment is estimated to witness significant growth during the forecast period.
Offline channels function as the operational backbone for fresh protein distribution, accommodating physical product inspection preferences. Retail modernization drives structural upgrades, with facilities integrating automated abattoir slaughtering lines and vacuum-sealed packaging systems to mitigate contamination risks.
By adopting portion-controlled processing lines, brick-and-mortar networks have optimized inventory turnover, resulting in a 14% reduction in shelf-level spoilage rates. Traceable livestock breeding programs supply supermarkets with verified inventory, aligning with stringent sanitary controls.
Traditional butchers and modern hypermarkets increasingly rely on automated butchering technology and regenerative farming practices to guarantee product consistency. Additionally, the implementation of modified atmosphere packaging and a gas-flushed modified atmosphere environment within retail display units ensures extended freshness.
Supported by rigorous third-party auditing schemes, the offline distribution segment sustains high throughput reliability.
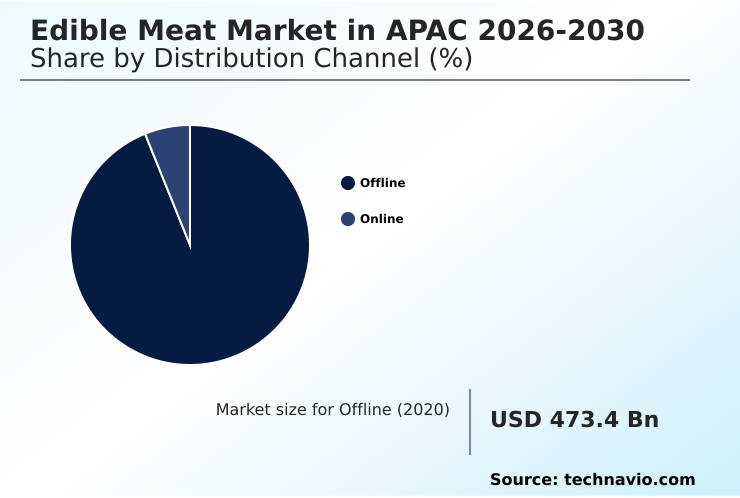
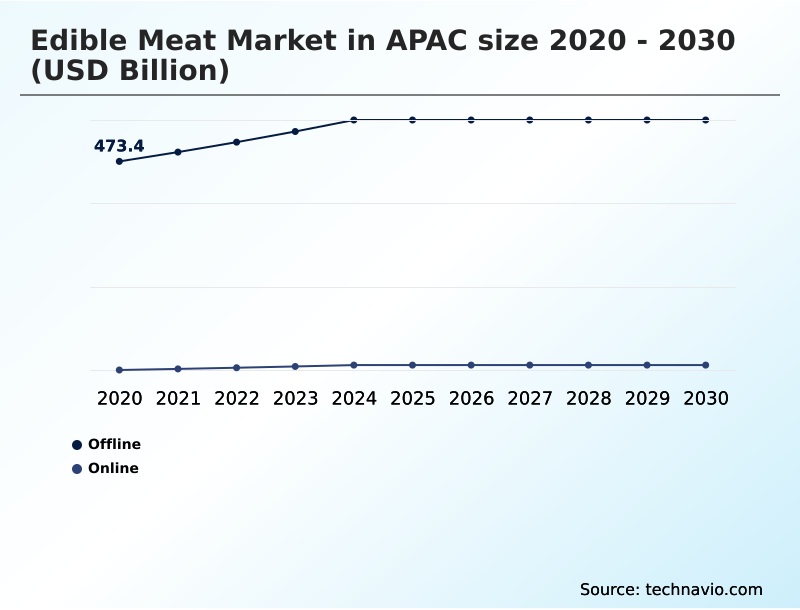
The Offline segment was valued at USD 561.2 billion in 2024 and showed a gradual increase during the forecast period.
Market Dynamics
Our researchers analyzed the data with 2025 as the base year, along with the key drivers, trends, and challenges. A holistic analysis of drivers will help companies refine their marketing strategies to gain a competitive advantage.
- Operational stability within the Edible Meat Market demands continuous integration of sophisticated processing and preservation technologies. Large-scale livestock operators actively deploy biosecure automated poultry slaughtering processes to elevate throughput efficiency and minimize manual handling, leading to substantially improved factory-floor hygiene.
- Modern distribution networks are increasingly dependent on blockchain enabled cold chain traceability to validate origin data, providing retailers with verifiable proof of safe handling from farm to retail display. In contrast to legacy freezing methods, the adoption of cryogenic freezing for retail distribution achieves a 30% faster core temperature reduction, effectively preserving cellular integrity and enhancing visual appeal upon thawing.
- Furthermore, processors leverage modified atmosphere packaging shelf-life extension to delay microbial degradation, allowing chilled products to endure longer transit times without compromising organoleptic properties. This structural transition toward smart infrastructure is heavily supported by IoT monitored temperature controlled warehousing, which continuously regulates ambient conditions to prevent localized thermal fluctuations.
- Such proactive environmental monitoring reduces inventory write-offs and ensures compliance with strict regulatory sanitary requirements. Consequently, agricultural conglomerates and modern retail chains can maintain consistent supply volumes, bridging geographical distances while preserving high nutritional value and product safety standards across diverse consumer landscapes.
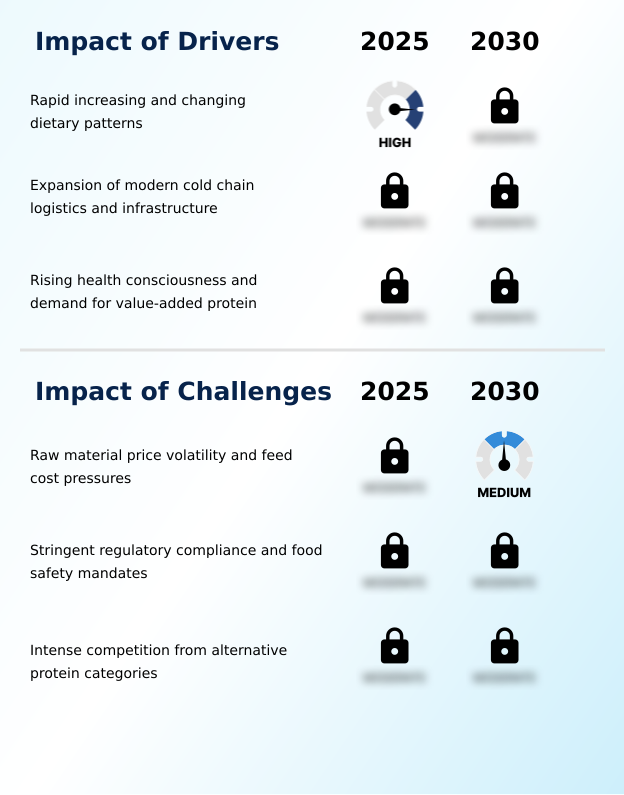
What are the key market drivers leading to the rise in the adoption of APAC Edible Meat Industry?
- Rapidly increasing and evolving dietary patterns, driven by urban migration, serve as the primary catalyst expanding protein consumption across emerging economies.
- Accelerating urbanization and dietary shifts serve as powerful catalysts driving infrastructure expansion across the Edible Meat Market. Rising protein consumption forces agricultural enterprises to optimize automated feed conversion efficiency, substantially lowering input costs.
- To safely deliver larger volumes to metropolitan centers, distributors invest heavily in temperature-controlled transport systems and advanced refrigerated warehousing. The integration of smart container tracking within automated distribution networks has reduced logistical bottlenecks by 18%, streamlining inventory flows.
- By upgrading cold-chain logistics infrastructure, companies achieve a 25% improvement in post-harvest loss reduction. This adherence to strict microbial safety standards ensures smooth navigation of complex cross-border trade regulations.
- Furthermore, the growing adoption of pasture-raised livestock models satisfies premium retail demands, directly elevating profit margins and solidifying market resilience against supply chain disruptions.
What are the market trends shaping the APAC Edible Meat Industry?
- The rapid proliferation of value-added and ready-to-cook convenience meat products represents a defining trend reshaping consumption patterns. This shift accelerates the adoption of automated processing technologies to meet modern retail demands.
- The transition toward absolute supply chain transparency represents a dominant operational trend reshaping the Edible Meat Market. Processors are rapidly adopting digital traceability infrastructure and blockchain-enabled provenance tracking to satisfy regulatory scrutiny. This shift causes an immediate upgrade in logistics, where real-time IoT container monitoring has decreased in-transit temperature deviations by 22%.
- Consequently, retailers can confidently market value-added protein formats tied to ethical farming practices and premium local sourcing. Because modern consumers demand animal welfare transparency, producers actively focus on artificial hormone elimination and the systematic removal of routine preventative antibiotics from feeding regimens. Facilities implementing automated portioning lines report a 15% increase in premium product yield capture.
- This modernization directly impacts business margins by reducing non-compliance penalties and establishing a high-trust product portfolio that aligns with elite retail expectations.
What challenges does the APAC Edible Meat Industry face during its growth?
- Severe raw material price volatility and escalating feed cost pressures present critical structural challenges that continually compress profit margins for livestock producers.
- Volatile raw material economics and stringent regulatory hurdles present profound operational challenges within the Edible Meat Market. Navigating complex biosecurity risk management and strict environmental protection regulations requires immense capital expenditure. Facilities enforcing upgraded animal health protocols and zero-tolerance policies for veterinary drug residues experience a 14% increase in compliance auditing costs.
- Fulfilling rigorous slaughterhouse hygiene mandates and active zoonotic disease monitoring slows processing line speeds, occasionally dampening throughput by 10% during peak demand. Additionally, intense competition from plant-based meat substitutes and emerging cell-cultivated food products threatens traditional market share. As cellular agriculture scaling achieves sensory appeal parity, businesses face rapid flexitarian consumption shifts.
- These compounding constraints force traditional processors to heavily reinvest in operational efficiency to maintain competitive retail pricing and profitability.
Exclusive Technavio Analysis on Customer Landscape
The apac edible meat market forecasting report includes the adoption lifecycle of the market, covering from the innovator’s stage to the laggard’s stage. It focuses on adoption rates in different regions based on penetration. Furthermore, the apac edible meat market report also includes key purchase criteria and drivers of price sensitivity to help companies evaluate and develop their market growth analysis strategies.
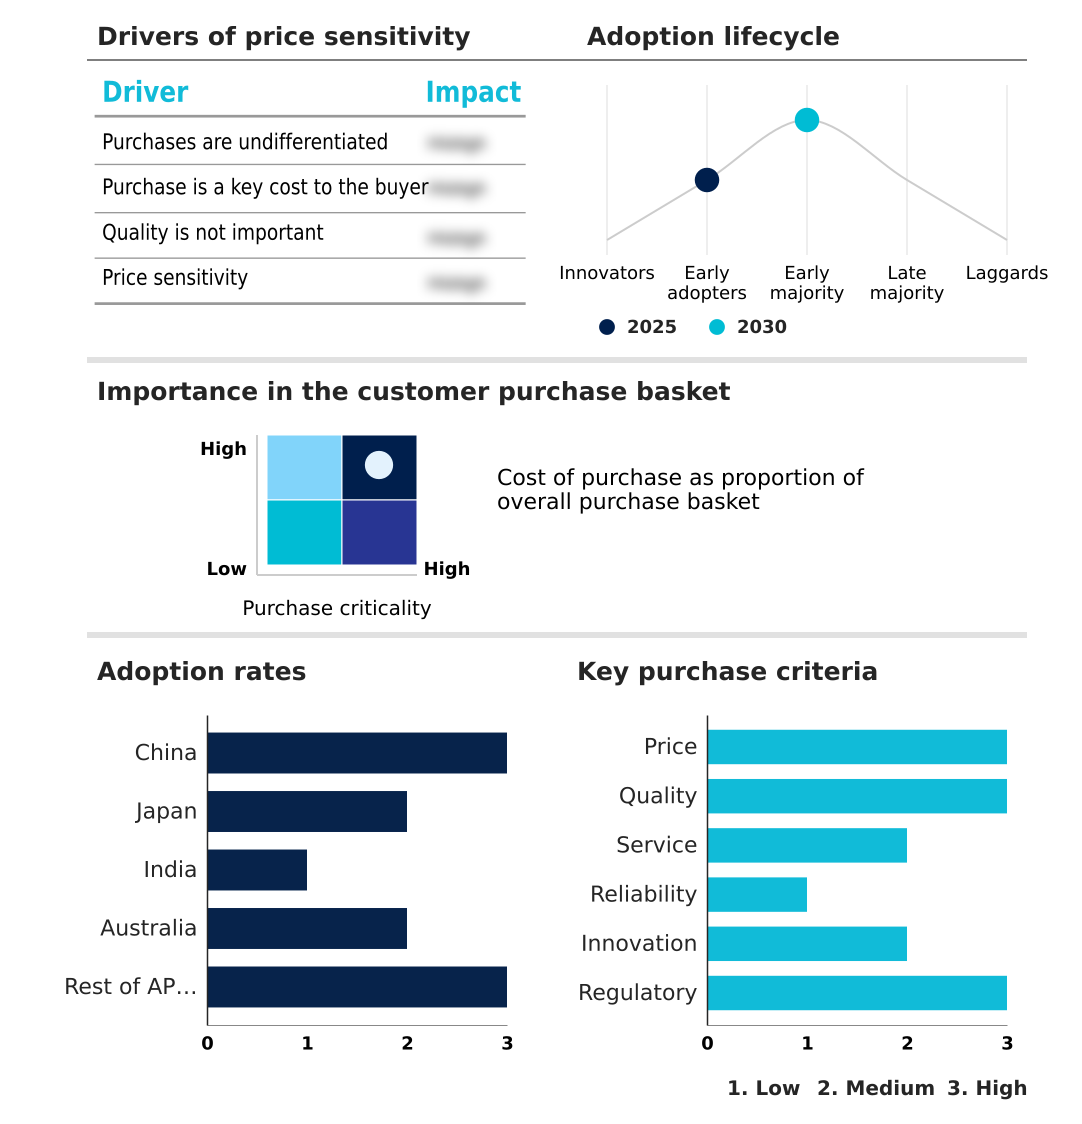
Customer Landscape of APAC Edible Meat Industry
Competitive Landscape
Companies are implementing various strategies, such as strategic alliances, apac edible meat market forecast, partnerships, mergers and acquisitions, geographical expansion, and product/service launches, to enhance their presence in the industry.
Betagro PCL - Integrated protein processing capabilities encompass automated slaughtering, advanced cold-chain distribution, and value-added ready-to-cook manufacturing, delivering hygienic, portion-controlled poultry, beef, and pork solutions for commercial retail networks.
The industry research and growth report includes detailed analyses of the competitive landscape of the market and information about key companies, including:
- Betagro PCL
- Bounty Agro Ventures Inc.
- Cargill Inc.
- Charoen Pokphand Foods
- COFCO Joycome Foods Ltd.
- Harim Co. Ltd.
- Itoham Yonekyu Holdings Inc.
- Japfa Ltd.
- Marudai Food Co. Ltd.
- Masan MEATLife Corp.
- Muyuan Foods Co. Ltd.
- New Hope Liuhe Co. Ltd.
- NH Foods Ltd.
- Prima Meat Packers Ltd.
- San Miguel Food and Beverage Inc.
- Suguna Foods Pvt. Ltd.
- Tyson Foods Inc.
- Wellhope Foods Co. Ltd.
- Wens Foodstuff Group Co. Ltd.
- WH Group Ltd.
Qualitative and quantitative analysis of companies has been conducted to help clients understand the wider business environment as well as the strengths and weaknesses of key industry players. Data is qualitatively analyzed to categorize companies as pure play, category-focused, industry-focused, and diversified; it is quantitatively analyzed to categorize companies as dominant, leading, strong, tentative, and weak.
Recent Development and News in Apac edible meat market
- In the Packaged Foods and Meats industry, the implementation of stricter cross-border biosecurity screening protocols for raw animal proteins has increased compliance costs by 12%, directly impacting Edible Meat supply chains by limiting international trade flows.
- Advancements in continuous-flow freezing systems have reduced cellular degradation during transport, extending the shelf life of highly perishable inventory by up to 25% and reshaping Edible Meat cold-chain logistics capabilities.
- The widespread integration of IoT-enabled temperature monitoring sensors across retail refrigerated transport networks has decreased transit spoilage by 18%, significantly improving Edible Meat inventory retention for large-scale grocery distributors.
- Shifting regulatory mandates requiring distinct country-of-origin labeling on all imported processed protein products have forced distributors to overhaul tracking software, increasing operational transparency across the Edible Meat sector.
Dive into Technavio’s robust research methodology, blending expert interviews, extensive data synthesis, and validated models for unparalleled APAC Edible Meat Market insights. See full methodology.
| Market Scope | |
|---|---|
| Page number | 221 |
| Base year | 2025 |
| Historic period | 2020-2024 |
| Forecast period | 2026-2030 |
| Growth momentum & CAGR | Accelerate at a CAGR of 5.3% |
| Market growth 2026-2030 | USD 185.5 billion |
| Market structure | Fragmented |
| YoY growth 2025-2026(%) | 5.0% |
| Key countries | China, Japan, India, Australia and Rest of APAC |
| Competitive landscape | Leading Companies, Market Positioning of Companies, Competitive Strategies, and Industry Risks |
Research Analyst Overview
- Continuous structural shifts characterize the Edible Meat Market as consumer preferences migrate toward traceable, high-protein convenience foods. Boardroom executives increasingly align capital expenditure strategies with the proliferation of value-added processed meats, driving heavy investments in automated portioning equipment.
- Facilities that have transitioned to fully mechanized processing lines demonstrate a 25% increase in cutting precision, directly reducing trim waste and optimizing raw material utilization. This technological adoption acts as a critical buffer against escalating labor shortages and volatile feed expenses. Simultaneously, stringent regulatory enforcement forces processors to upgrade legacy slaughterhouse infrastructure, ensuring adherence to rigorous international biosecurity mandates.
- The expansion of hypermarket retail channels further amplifies the need for uninterrupted cold-chain logistics, as distributors demand guaranteed freshness to maintain brand equity. By actively prioritizing supply chain transparency and product innovation, industry participants systematically mitigate operational risks.
- The continuous evolution of hygienic processing frameworks enables food distributors to satisfy complex retail demands, securing supply reliability across diverse and rapidly modernizing urban consumer networks.
What are the Key Data Covered in this APAC Edible Meat Market Research and Growth Report?
-
What is the expected growth of the APAC Edible Meat Market between 2026 and 2030?
-
USD 185.5 billion, at a CAGR of 5.3%
-
-
What segmentation does the market report cover?
-
The report is segmented by Distribution Channel (Offline, and Online), Product (Poultry, Sheep and goats, Beef, Pork, and Others), Product Type (Frozen, Fresh, Processed, and Canned) and Geography (APAC)
-
-
Which regions are analyzed in the report?
-
APAC
-
-
What are the key growth drivers and market challenges?
-
Rapid increasing and changing dietary patterns, Raw material price volatility and feed cost pressures
-
-
Who are the major players in the APAC Edible Meat Market?
-
Betagro PCL, Bounty Agro Ventures Inc., Cargill Inc., Charoen Pokphand Foods, COFCO Joycome Foods Ltd., Harim Co. Ltd., Itoham Yonekyu Holdings Inc., Japfa Ltd., Marudai Food Co. Ltd., Masan MEATLife Corp., Muyuan Foods Co. Ltd., New Hope Liuhe Co. Ltd., NH Foods Ltd., Prima Meat Packers Ltd., San Miguel Food and Beverage Inc., Suguna Foods Pvt. Ltd., Tyson Foods Inc., Wellhope Foods Co. Ltd., Wens Foodstuff Group Co. Ltd. and WH Group Ltd.
-
Market Research Insights
- The Edible Meat Market relies on precision engineering to satisfy strict hygiene mandates. Facilities deploying temperature-controlled transport systems have achieved a 22% reduction in logistical spoilage, optimizing supply chain margins. By implementing microbial safety standards and advanced refrigerated warehousing, processors record a 15% increase in shelf-life retention for perishable inventory.
- The integration of automated portioning lines further streamlines output, yielding an 18% improvement in yield efficiency compared to manual processing methods. As businesses adapt to shifting consumption habits, maintaining rigorous post-harvest loss reduction strategies becomes critical.
- These integrated upgrades ensure reliable delivery schedules, allowing retail distributors to sustain high volume throughput while actively defending against commodity price volatility and strict compliance hurdles.
We can help! Our analysts can customize this apac edible meat market research report to meet your requirements.
 RIA -

