Tolling And City Congestion Market Analysis APAC - Size and Forecast 2024-2028

Tolling And City Congestion Market Analysis APAC - Size and Forecast 2024-2028

Published: Jul 2024 147 Pages SKU: IRTNTR76479

Market Overview at a Glance

$3.57 B
Market Opportunity
16.07%
CAGR
15.71
YoY growth 2023-2024(%)

Asia-Pacific Tolling and City Congestion Market Size 2024-2028

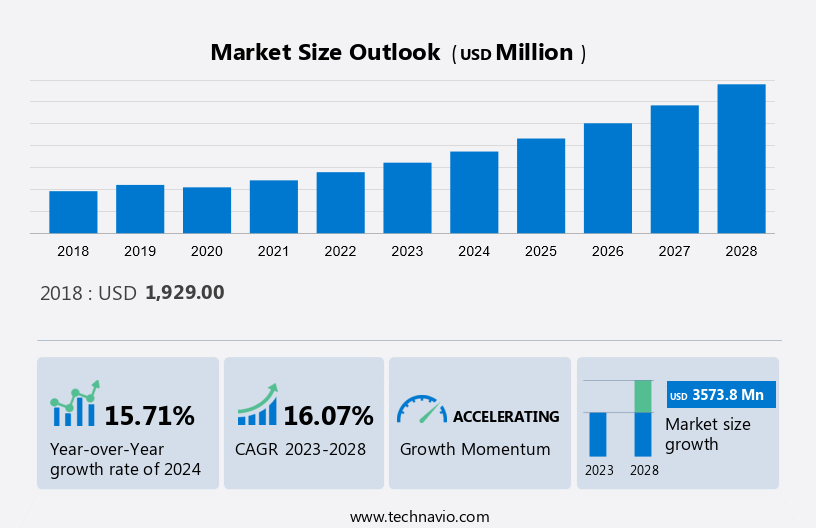
The Asia-Pacific (APAC) - Tolling and City Congestion Market size is forecast to increase by USD 3.57 billion, at a CAGR of 16.07% between 2023 and 2028. Electronic tolling systems offer significant benefits for both users and operators. For motorists, the convenience of contactless payments and faster travel through toll plazas is a major advantage. The increasing number of vehicles on the road necessitates efficient traffic management solutions, making electronic tolling an essential component of modern transportation infrastructure. Moreover, electronic tolling systems enable real-time data collection and analysis, providing valuable insights for transportation authorities to optimize traffic flow and improve overall road network efficiency. The rise in demand for seamless and hassle-free travel experiences further underscores the importance of electronic tolling systems in today's fast-paced world.

What will be the size of the Market During the Forecast Period?

Tolling And City Congestion Market in APAC Size

APAC Tolling and City Congestion Market Forecast 2024-2028

To learn more about this report,  Request Free Sample

Market Dynamic

The evolution of tolling systems has seen significant advancements with the introduction of electronic toll collection methods such as radio-frequency identification (RFID), global navigation satellite system (GNSS), and global positioning system (GPS). These technologies enable seamless transactions on toll bridges, toll roads, and toll tunnels by automatically deducting fees without requiring vehicles to stop. Countries like Guatemala face challenges such as raw material shortages and shipping delays impacting infrastructure projects, including toll road operations. Innovations in video analytics and infrared technology enhance traffic monitoring and toll enforcement, ensuring efficient toll collection and traffic management. Electronic Toll Collection (ETC) systems deployed by toll road operators improve user convenience and road network efficiency. Dedicated short-range communication (DSRC) further enhances the reliability of tolling infrastructure, providing real-time data for transportation planning and revenue management.

Driver - Convenience of electronic tolling for users and operators

Electronic tolling makes toll and parking payments convenient and swift for drivers. Automated collection of payments with minimal physical interactions could also be made possible by operators, thereby improving operational efficiency. In APAC, the adoption of RFID-based electronic tolling is rapidly growing, owing to the low cost of RFID technology. 

Moreover, electronic tolling is also used for vehicle identification, eliminating the inconvenience of carrying physical copies of vehicle papers. Electronic tolling systems for new vehicles in these countries will also be needed, with the aim of improving road infrastructure. Therefore, the rising convenience of electronic tolling for users and operators will drive the growth of the APAC - Tolling and City Congestion Market during the forecast period.

Trends - Increasing investment in smart cities by governments

Initiatives to make cities more efficient, sustainable, and livable frequently involve the use of advanced technology.  A major component of smart city initiatives is the use of intelligent traffic management technologies that monitor, control, and manage traffic flow, alleviate congestion, and improve safety. A variety of urban challenges, including traffic congestion, air pollution, and energy efficiency, are being addressed by governments in numerous nations through the implementation of smart city initiatives. 

Moreover, the increasing government investment in smart city initiatives is hastening the adoption of intelligent traffic management technologies in cities all over the world. This contributes to improving traffic flow, reducing congestion, and increasing security in cities. Therefore, the Asia Pacific - Tolling and City Congestion Market is anticipated to be positively impacted by governments' increasing investments in smart cities during the forecasted period.

Challenge - Lack of proper transportation infrastructure

A lack of adequate transportation infrastructure will negatively impact intelligent traffic management.  If a transport system does not have sufficient roads, bridges, tunnels, and other vital elements, it will be very difficult to guarantee an efficient flow of traffic. It will be difficult to control traffic signals, lane usage, and other aspects of traffic management without a sufficient transportation infrastructure.

Additionally, it will be more difficult to maintain clear roads and minimal congestion if transportation infrastructure is lacking. Consequently, productivity will be severely affected and emergency services may require more time to reach the scene. Along with lowering emissions and enhancing safety, these investments will contribute to a smoother traffic flow, which could be a potential challenge for the Asia-Pacific (APAC) - Tolling and City Congestion Market during the forecast period.

Market Segmentation

By Product

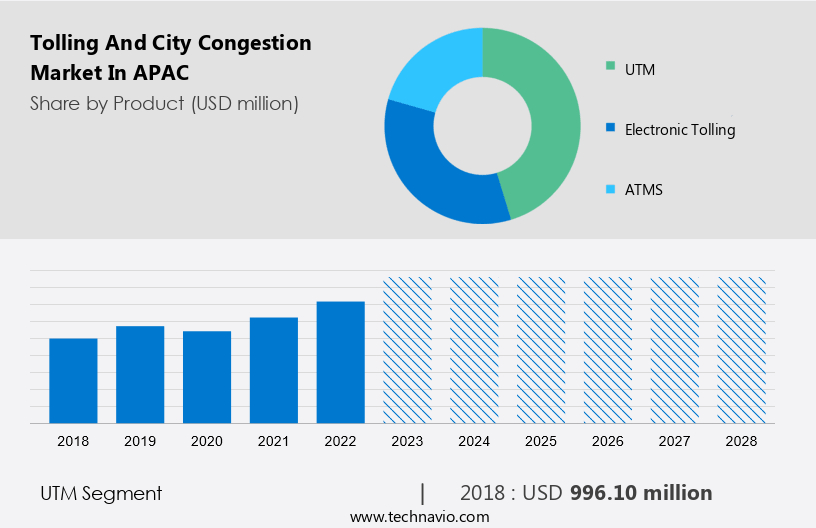
The UTM segment will account for a major share of the market's growth during the forecast period. UTM systems are designed in a way that allows different applications used within modern traffic management systems to share and communicate information with each other. The major objective of UTM systems is to increase road network potential to create a more vigorous and smart system that may be used in order to meet the management's specific needs going forward.

Tolling And City Congestion Market in APAC Size

Get a Customised Report as per your requirements for FREE!

The UTM segment was valued at USD 996.10 billion in 2018. Several traffic management systems have been developed for urban traffic control. Some of the more common methods are shown in the display box below. Among them, computerized traffic signal control, also known as Urban Traffic Control (UTC), has become the norm for large towns and cities. The advantages of using a computer for the coordination of traffic controls to balance needs and flow are clear in dense urban networks.

By Application

Highways play a critical part in making our lives simpler. They are necessary for traveling from one point to another swiftly and effectively. However, high-speed traffic poses certain difficulties. Safety is critical on highways designed for high-speed traffic. The more information drivers have on current traffic conditions, the safer they will be driving during this period of time. On roads, vehicles travel at fast speeds; electronic toll-collecting systems enable vehicle owners to conduct a quick digital transaction without stopping at toll booths. By facilitating the collection of tolls more quickly and effectively, this method has ushered in a new era. The highways segment holds the largest market share of the APAC - Tolling and City Congestion Market in 2022 and is expected to dominate the market during the forecast period, owing to an increase in infrastructural development and improvement in traffic management policies at toll booths on highways.

Who are the Major Market Companies?

Companies are implementing various strategies, such as strategic alliances, partnerships, mergers and acquisitions, geographical expansion, and product/service launches, to enhance their presence in the market.

Conduent Inc.- The company offers tolling and city congestion solutions such as SureView detection system and automated license plate recognition.

We also have detailed analyses of the market’s competitive landscape and offer information on 20 market companies, including:

Cubic Corp., EFKON GmbH, General Electric Co., Kapsch TrafficCom AG, Mitsubishi Heavy Industries Ltd., Raytheon Technologies Corp., Siemens AG, Singapore Technologies Engineering Ltd., Thales Group, Toshiba Corp., and Transurban Ltd.

Technavio report provides an in-depth analysis of the market and its players through combined qualitative and quantitative data. The analysis classifies companies into categories based on their business approaches, including pure-play, category-focused, industry-focused, and diversified. Companies are specially categorized into dominant, leading, strong, tentative, and weak, based on their quantitative data analysis.  

Segment Overview

The market research report provides comprehensive data (region wise segment analysis), with forecasts and estimates in "USD Billion" for the period 2024 to 2028, as well as historical data from 2018 to 2023 for the following segments.

  • Product Outlook
    • UTM
    • Electronic tolling
    • ATMS
  • Application Outlook
    • Highways
    • Urban areas

You may also interested in below market reports:

1. Electronic Toll Collection Market by Application, Technology, and Geography - Forecast and Analysis

2. Automated Barriers and Bollards Market Analysis Europe, North America, APAC, Middle East and Africa, South America - US, Italy, UK, Germany, China - Size and Forecast

3. In-Car Wi-Fi Market Analysis Europe, APAC, North America, Middle East and Africa, South America - US, China, Japan, Germany, France - Size and Forecast

Market Analyst Overview

The tolling system landscape is evolving rapidly with advancements in intelligent transportation systems (ITS) that integrate parking management & guidance, passenger information, and advanced traffic management solutions. Cities like Los Angeles, Moscow, Dhaka, New Delhi, Mumbai, and Amsterdam are leveraging Internet of Things (IoT) technologies to optimize urban traffic management through systems like TrafficLink SCM in North Holland and the UK. RFID (Radio Frequency Identification) and DSRC (Dedicated Short Range Communication) enable automated vehicle identification (AVI) and automated vehicle classification (AVC), streamlining transaction management and violation enforcement. These technologies operate on distance-based, point-based, time-based, and perimeter-based models, supporting both highway and urban mobility needs. Despite challenges like raw material shortages impacting software, hardware, and service availability, ITS solutions continue to enhance transportation efficiency and urban mobility worldwide, benefiting countries such as the Philippines, Pakistan, and Australia.

Industry  Scope

Report Coverage

Details

Page number

147

Base year

2023

Historic period

2018 - 2022

Forecast period

2024-2028

Growth momentum & CAGR

Accelerate at a CAGR of 16.07%

Market growth 2024-2028

USD 3.57 Billion

Market structure

Concentrated

YoY growth 2023-2024(%)

15.71

Competitive landscape

Leading Companies, Market Positioning of Companies, Competitive Strategies, and Industry Risks

Key companies profiled

Conduent Inc., Cubic Corp., EFKON GmbH, General Electric Co., Kapsch TrafficCom AG, Mitsubishi Heavy Industries Ltd., RTX Corp., Siemens AG, Singapore Technologies Engineering Ltd., Thales Group, Toshiba Corp., and Transurban Ltd.

Market dynamics

Parent market analysis, Market forecasting growth inducers and obstacles, Fast-growing and slow-growing segment analysis, Market growth and Forecasting, COVID 19 impact and recovery analysis and future consumer dynamics, Market condition analysis for forecast period

Customization purview

If our market report has not included the data that you are looking for, you can reach out to our analysts and get segments customized.

Request PDF sample

What are the Key Data Covered in this Market Forecast Report?

  • CAGR of the market during the forecast period
  • Detailed information on factors that will drive the market growth and forecasting of the market between 2024 and 2028
  • Precise estimation of the market size and its contribution to the parent market
  • Accurate predictions about upcoming market trends and analysis and changes in consumer behavior
  • Growth of the market across Europe, North America, APAC, South America, and Middle East and Africa
  • Thorough market growth analysis of the market’s competitive landscape and detailed information about companies
  • Comprehensive market analysis and report on the factors that will challenge the market research and growth of market companies

We can help! Our analysts can customize this market research report to meet your requirements. Get in touch

1 Executive Summary

  • 1.1 Market overview
    • Executive Summary - Chart on Market Overview
    • Executive Summary - Data Table on Market Overview
    • Executive Summary - Chart on Country Market Characteristics
    • Executive Summary - Chart on Market by Geography
    • Executive Summary - Chart on Market Segmentation by Product
    • Executive Summary - Chart on Market Segmentation by Application
    • Executive Summary - Chart on Incremental Growth
    • Executive Summary - Data Table on Incremental Growth
    • Executive Summary - Chart on Company Market Positioning

2 Market Landscape

  • 2.1 Market ecosystem
    • Parent Market
    • Data Table on - Parent Market
  • 2.2 Market characteristics
    • Market characteristics analysis
  • 2.3 Value chain analysis
    • Value Chain Analysis

3 Market Sizing

  • 3.1 Market definition
    • Offerings of companies included in the market definition
  • 3.2 Market segment analysis
    • Market segments
  • 3.3 Market size 2023
    • 3.4 Market outlook: Forecast for 2023-2028
      • Chart on APAC - Market size and forecast 2023-2028 ($ million)
      • Data Table on Regional - Market size and forecast 2023-2028 ($ million)
      • Chart on APAC: Year-over-year growth 2023-2028 (%)
      • Data Table on Regional - Market size and forecast 2023-2028 ($ million)

    4 Historic Market Size

    • 4.1 Tolling And City Congestion Market in APAC 2018 - 2022
      • Historic Market Size - Data Table on Tolling And City Congestion Market in APAC 2018 - 2022 ($ million)
    • 4.2 Product segment analysis 2018 - 2022
      • Historic Market Size - Product Segment 2018 - 2022 ($ million)
    • 4.3 Application segment analysis 2018 - 2022
      • Historic Market Size - Application Segment 2018 - 2022 ($ million)
    • 4.4 Geography segment analysis 2018 - 2022
      • Historic Market Size - Geography Segment 2018 - 2022 ($ million)

    5 Five Forces Analysis

    • 5.1 Five forces summary
      • Five forces analysis - Comparison between 2023 and 2028
    • 5.2 Bargaining power of buyers
      • Bargaining power of buyers - Impact of key factors 2023 and 2028
    • 5.3 Bargaining power of suppliers
      • Bargaining power of suppliers - Impact of key factors in 2023 and 2028
    • 5.4 Threat of new entrants
      • Threat of new entrants - Impact of key factors in 2023 and 2028
    • 5.5 Threat of substitutes
      • Threat of substitutes - Impact of key factors in 2023 and 2028
    • 5.6 Threat of rivalry
      • Threat of rivalry - Impact of key factors in 2023 and 2028
    • 5.7 Market condition
      • Chart on Market condition - Five forces 2023 and 2028

    6 Market Segmentation by Product

    • 6.1 Market segments
      • Chart on Product - Market share 2023-2028 (%)
      • Data Table on Product - Market share 2023-2028 (%)
    • 6.2 Comparison by Product
      • Chart on Comparison by Product
      • Data Table on Comparison by Product
    • 6.3 UTM - Market size and forecast 2023-2028
      • Chart on UTM - Market size and forecast 2023-2028 ($ million)
      • Data Table on UTM - Market size and forecast 2023-2028 ($ million)
      • Chart on UTM - Year-over-year growth 2023-2028 (%)
      • Data Table on UTM - Year-over-year growth 2023-2028 (%)
    • 6.4 Electronic tolling - Market size and forecast 2023-2028
      • Chart on Electronic tolling - Market size and forecast 2023-2028 ($ million)
      • Data Table on Electronic tolling - Market size and forecast 2023-2028 ($ million)
      • Chart on Electronic tolling - Year-over-year growth 2023-2028 (%)
      • Data Table on Electronic tolling - Year-over-year growth 2023-2028 (%)
    • 6.5 ATMS - Market size and forecast 2023-2028
      • Chart on ATMS - Market size and forecast 2023-2028 ($ million)
      • Data Table on ATMS - Market size and forecast 2023-2028 ($ million)
      • Chart on ATMS - Year-over-year growth 2023-2028 (%)
      • Data Table on ATMS - Year-over-year growth 2023-2028 (%)
    • 6.6 Market opportunity by Product
      • Market opportunity by Product ($ million)
      • Data Table on Market opportunity by Product ($ million)

    7 Market Segmentation by Application

    • 7.1 Market segments
      • Chart on Application - Market share 2023-2028 (%)
      • Data Table on Application - Market share 2023-2028 (%)
    • 7.2 Comparison by Application
      • Chart on Comparison by Application
      • Data Table on Comparison by Application
    • 7.3 Highways - Market size and forecast 2023-2028
      • Chart on Highways - Market size and forecast 2023-2028 ($ million)
      • Data Table on Highways - Market size and forecast 2023-2028 ($ million)
      • Chart on Highways - Year-over-year growth 2023-2028 (%)
      • Data Table on Highways - Year-over-year growth 2023-2028 (%)
    • 7.4 Urban areas - Market size and forecast 2023-2028
      • Chart on Urban areas - Market size and forecast 2023-2028 ($ million)
      • Data Table on Urban areas - Market size and forecast 2023-2028 ($ million)
      • Chart on Urban areas - Year-over-year growth 2023-2028 (%)
      • Data Table on Urban areas - Year-over-year growth 2023-2028 (%)
    • 7.5 Market opportunity by Application
      • Market opportunity by Application ($ million)
      • Data Table on Market opportunity by Application ($ million)

    8 Customer Landscape

    • 8.1 Customer landscape overview
      • Analysis of price sensitivity, lifecycle, customer purchase basket, adoption rates, and purchase criteria

    9 Geographic Landscape

    • 9.1 Geographic segmentation
      • Chart on Market share by geography - 2023-2028 (%)
      • Data Table on Market share by geography - 2023-2028 (%)
    • 9.2 Geographic comparison
      • Chart on Geographic comparison
      • Data Table on Geographic comparison
    • 9.3 China - Market size and forecast 2023-2028
      • Chart on China - Market size and forecast 2023-2028 ($ million)
      • Data Table on China - Market size and forecast 2023-2028 ($ million)
      • Chart on China - Year-over-year growth 2023-2028 (%)
      • Data Table on China - Year-over-year growth 2023-2028 (%)
    • 9.4 India - Market size and forecast 2023-2028
      • Chart on India - Market size and forecast 2023-2028 ($ million)
      • Data Table on India - Market size and forecast 2023-2028 ($ million)
      • Chart on India - Year-over-year growth 2023-2028 (%)
      • Data Table on India - Year-over-year growth 2023-2028 (%)
    • 9.5 Japan - Market size and forecast 2023-2028
      • Chart on Japan - Market size and forecast 2023-2028 ($ million)
      • Data Table on Japan - Market size and forecast 2023-2028 ($ million)
      • Chart on Japan - Year-over-year growth 2023-2028 (%)
      • Data Table on Japan - Year-over-year growth 2023-2028 (%)
    • 9.6 South Korea - Market size and forecast 2023-2028
      • Chart on South Korea - Market size and forecast 2023-2028 ($ million)
      • Data Table on South Korea - Market size and forecast 2023-2028 ($ million)
      • Chart on South Korea - Year-over-year growth 2023-2028 (%)
      • Data Table on South Korea - Year-over-year growth 2023-2028 (%)
    • 9.7 Rest of APAC - Market size and forecast 2023-2028
      • Chart on Rest of APAC - Market size and forecast 2023-2028 ($ million)
      • Data Table on Rest of APAC - Market size and forecast 2023-2028 ($ million)
      • Chart on Rest of APAC - Year-over-year growth 2023-2028 (%)
      • Data Table on Rest of APAC - Year-over-year growth 2023-2028 (%)
    • 9.8 Market opportunity by geography
      • Market opportunity by geography ($ million)
      • Data Table on Market opportunity by geography ($ million)

    10 Drivers, Challenges, and Opportunity/Restraints

    • 10.1 Market drivers
      • 10.2 Market challenges
        • 10.3 Impact of drivers and challenges
          • Impact of drivers and challenges in 2023 and 2028
        • 10.4 Market opportunities/restraints

          11 Competitive Landscape

          • 11.1 Overview
            • 11.2 Competitive Landscape
              • Overview on criticality of inputs and factors of differentiation
            • 11.3 Landscape disruption
              • Overview on factors of disruption
            • 11.4 Industry risks
              • Impact of key risks on business

            12 Competitive Analysis

            • 12.1 Companies profiled
              • Companies covered
            • 12.2 Market positioning of companies
              • Matrix on companies position and classification
            • 12.3 Conduent Inc.
              • Conduent Inc. - Overview
              • Conduent Inc. - Business segments
              • Conduent Inc. - Key news
              • Conduent Inc. - Key offerings
              • Conduent Inc. - Segment focus
            • 12.4 Cubic Corp.
              • Cubic Corp. - Overview
              • Cubic Corp. - Product / Service
              • Cubic Corp. - Key offerings
            • 12.5 EFKON GmbH
              • EFKON GmbH - Overview
              • EFKON GmbH - Product / Service
              • EFKON GmbH - Key offerings
            • 12.6 General Electric Co.
              • General Electric Co. - Overview
              • General Electric Co. - Business segments
              • General Electric Co. - Key news
              • General Electric Co. - Key offerings
              • General Electric Co. - Segment focus
            • 12.7 Kapsch TrafficCom AG
              • Kapsch TrafficCom AG - Overview
              • Kapsch TrafficCom AG - Business segments
              • Kapsch TrafficCom AG - Key news
              • Kapsch TrafficCom AG - Key offerings
              • Kapsch TrafficCom AG - Segment focus
            • 12.8 Mitsubishi Heavy Industries Ltd.
              • Mitsubishi Heavy Industries Ltd. - Overview
              • Mitsubishi Heavy Industries Ltd. - Business segments
              • Mitsubishi Heavy Industries Ltd. - Key news
              • Mitsubishi Heavy Industries Ltd. - Key offerings
              • Mitsubishi Heavy Industries Ltd. - Segment focus
            • 12.9 RTX Corp.
              • RTX Corp. - Overview
              • RTX Corp. - Business segments
              • RTX Corp. - Key news
              • RTX Corp. - Key offerings
              • RTX Corp. - Segment focus
            • 12.10 Siemens AG
              • Siemens AG - Overview
              • Siemens AG - Business segments
              • Siemens AG - Key news
              • Siemens AG - Key offerings
              • Siemens AG - Segment focus
            • 12.11 Singapore Technologies Engineering Ltd.
              • Singapore Technologies Engineering Ltd. - Overview
              • Singapore Technologies Engineering Ltd. - Business segments
              • Singapore Technologies Engineering Ltd. - Key news
              • Singapore Technologies Engineering Ltd. - Key offerings
              • Singapore Technologies Engineering Ltd. - Segment focus
            • 12.12 Thales Group
              • Thales Group - Overview
              • Thales Group - Business segments
              • Thales Group - Key news
              • Thales Group - Key offerings
              • Thales Group - Segment focus
            • 12.13 Toshiba Corp.
              • Toshiba Corp. - Overview
              • Toshiba Corp. - Business segments
              • Toshiba Corp. - Key news
              • Toshiba Corp. - Key offerings
              • Toshiba Corp. - Segment focus
            • 12.14 Transurban Ltd.
              • Transurban Ltd. - Overview
              • Transurban Ltd. - Business segments
              • Transurban Ltd. - Key offerings
              • Transurban Ltd. - Segment focus

            13 Appendix

            • 13.1 Scope of the report
              • 13.2 Inclusions and exclusions checklist
                • Inclusions checklist
                • Exclusions checklist
              • 13.3 Currency conversion rates for US$
                • Currency conversion rates for US$
              • 13.4 Research methodology
                • Research methodology
              • 13.5 Data procurement
                • Information sources
              • 13.6 Data validation
                • Data validation
              • 13.7 Validation techniques employed for market sizing
                • Validation techniques employed for market sizing
              • 13.8 Data synthesis
                • Data synthesis
              • 13.9 360 degree market analysis
                • 360 degree market analysis
              • 13.10 List of abbreviations
                • List of abbreviations

              Research Methodology

              Technavio presents a detailed picture of the market by way of study, synthesis, and summation of data from multiple sources. The analysts have presented the various facets of the market with a particular focus on identifying the key industry influencers. The data thus presented is comprehensive, reliable, and the result of extensive research, both primary and secondary.

              INFORMATION SOURCES

              Primary sources

              • Manufacturers and suppliers
              • Channel partners
              • Industry experts
              • Strategic decision makers

              Secondary sources

              • Industry journals and periodicals
              • Government data
              • Financial reports of key industry players
              • Historical data
              • Press releases

              DATA ANALYSIS

              Data Synthesis

              • Collation of data
              • Estimation of key figures
              • Analysis of derived insights

              Data Validation

              • Triangulation with data models
              • Reference against proprietary databases
              • Corroboration with industry experts

              REPORT WRITING

              Qualitative

              • Market drivers
              • Market challenges
              • Market trends
              • Five forces analysis

              Quantitative

              • Market size and forecast
              • Market segmentation
              • Geographical insights
              • Competitive landscape

              Interested in this report?

              Get your sample now to see our research methodology and insights!

              Download Now

              Frequently Asked Questions

              Tolling And City Congestionin APAC market growth will increase by $ 3573.8 mn during 2024-2028.

              The Tolling And City Congestionin APAC market is expected to grow at a CAGR of 16.07% during 2024-2028.

              Tolling And City Congestionin APAC market is segmented by Product( UTM, Electronic tolling, ATMS) Application( Highways, Urban areas)

              Conduent Inc., Cubic Corp., EFKON GmbH, General Electric Co., Kapsch TrafficCom AG, Mitsubishi Heavy Industries Ltd., RTX Corp., Siemens AG, Singapore Technologies Engineering Ltd., Thales Group, Toshiba Corp., Transurban Ltd. are a few of the key vendors in the Tolling And City Congestionin APAC market.

              APAC will register the highest growth rate of 100% among the other regions. Therefore, the Tolling And City Congestionin APAC market in APAC is expected to garner significant business opportunities for the vendors during the forecast period.

              China, India, Japan, South Korea, Rest of APAC

              • Convenience of electronic tolling for users and operatorsElectronic tolling makes toll and parking payments convenient and swift for drivers. Operators is the driving factor this market.
              • too is the driving factor this market.
              • can automate the process of collecting payment with minimum physical interaction is the driving factor this market.
              • which increases operational efficiency. In APAC is the driving factor this market.
              • the adoption of RFID-based electronic tolling is rapidly growing is the driving factor this market.
              • owing to the low cost of RFID technology. This system is also useful in extreme weather conditions is the driving factor this market.
              • where quick entry and exits are imperative. Electronic tolling is also used for vehicle identification is the driving factor this market.
              • eliminating the inconvenience of carrying physical copies of vehicle papers. Hence is the driving factor this market.
              • all major countries is the driving factor this market.
              • such as China and India is the driving factor this market.
              • are making electronic tolling systems a standard fitment for new vehicles. Efforts to improve road infrastructure will also make electronic tolling systems essential for new vehicles in these countries. Therefore is the driving factor this market.
              • the rising convenience of electronic tolling for users and operators will drive the growth of the tolling and city congestion market in APAC during the forecast period. is the driving factor this market.

              The Tolling And City Congestionin APAC market vendors should focus on grabbing business opportunities from the UTM segment as it accounted for the largest market share in the base year.
              RIA - Research AI Assistant
              Ask RIA