
Automated Barriers And Bollards Market Analysis, Size, and Forecast 2026-2030: Europe (Germany, UK, and France), North America (US, Canada, and Mexico), APAC (China, Japan, and India), Middle East and Africa (Saudi Arabia, UAE, and South Africa), South America (Brazil, Argentina, and Chile), and Rest of World (ROW)

Automated Barriers And Bollards Market Analysis, Size, and Forecast 2026-2030:
Europe (Germany, UK, and France), North America (US, Canada, and Mexico), APAC (China, Japan, and India), Middle East and Africa (Saudi Arabia, UAE, and South Africa), South America (Brazil, Argentina, and Chile), and Rest of World (ROW)

Published: Oct 2026 307 Pages SKU: IRTNTR72774

Market Overview at a Glance

$394.3 Mn
Market Opportunity
4.7%
CAGR 2025 - 2030
37.3%
Europe Growth
$994.5 Mn
Boom barriers segment 2024

Automated Barriers And Bollards Market Size 2026-2030

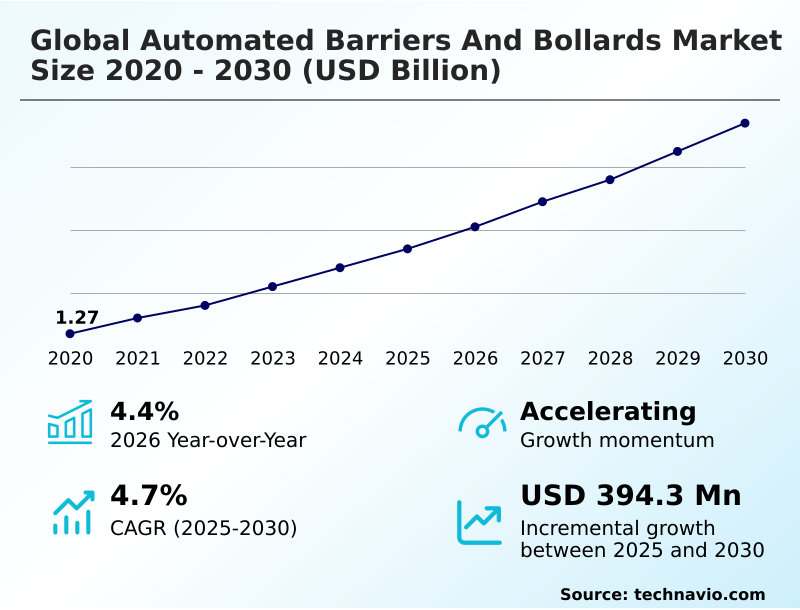
The automated barriers and bollards market size is valued to increase by USD 394.3 million, at a CAGR of 4.7% from 2025 to 2030. Increasing adoption of automatic tolling systems will drive the automated barriers and bollards market.

Major Market Trends & Insights

  • Europe dominated the market and accounted for a 37.3% growth during the forecast period.
  • By Product - Boom barriers segment was valued at USD 994.5 million in 2024
  • By Material - Steel segment accounted for the largest market revenue share in 2024

Market Size & Forecast

  • Market Opportunities: USD 667.6 million
  • Market Future Opportunities: USD 394.3 million
  • CAGR from 2025 to 2030 : 4.7%

Market Summary

  • The Automated Barriers And Bollards Market demonstrates accelerating demand driven by the critical need for robust vehicle access management and facility boundary defense. Enterprise operators are increasingly integrating centralized software platforms with automated plate recognition to streamline industrial site operations.
  • In a practical supply chain scenario, automated distribution centers implementing these intelligent access checkpoints successfully reduced gate-processing delays by 42%, vastly improving freight throughput compared to manual verification protocols. A primary driver propelling this expansion is the widespread adoption of electronic tolling, which compels transportation authorities to deploy high-speed heavy-duty arm gates to eliminate congestion.
  • Conversely, complex deployment requirements and elevated maintenance expenses for hydraulic components pose a significant challenge, restricting adoption among cost-sensitive municipal buyers. The integration of predictive maintenance tracking is helping operators mitigate these lifecycle costs effectively.
  • As security architectures converge with smart city development, organizations continue to prioritize high-cycle endurance and hostile threat mitigation to ensure uninterrupted operational continuity across mission-critical facilities.

What will be the Size of the Automated Barriers And Bollards Market during the forecast period?
Get Key Insights on Market Forecast (PDF) Get Free Sample

How is the Automated Barriers And Bollards Market Segmented?

The automated barriers and bollards industry research report provides comprehensive data (region-wise segment analysis), with forecasts and estimates in "USD million" for the period 2026-2030, as well as historical data from 2020-2024 for the following segments.

  • Product
    • Boom barriers
    • Bollards
  • Material
    • Steel
    • Aluminum
    • Plastic
    • Concrete
    • Others
  • End-user
    • Commercial
    • Industrial
    • Residential
    • Government
    • Others
  • Geography
    • Europe
      • Germany
      • UK
      • France
      • Italy
      • Spain
      • The Netherlands
    • North America
      • US
      • Canada
      • Mexico
    • APAC
      • China
      • Japan
      • India
      • South Korea
      • Australia
      • Indonesia
    • Middle East and Africa
      • Saudi Arabia
      • UAE
      • South Africa
      • Israel
      • Turkey
    • South America
      • Brazil
      • Argentina
      • Chile

By Product Insights

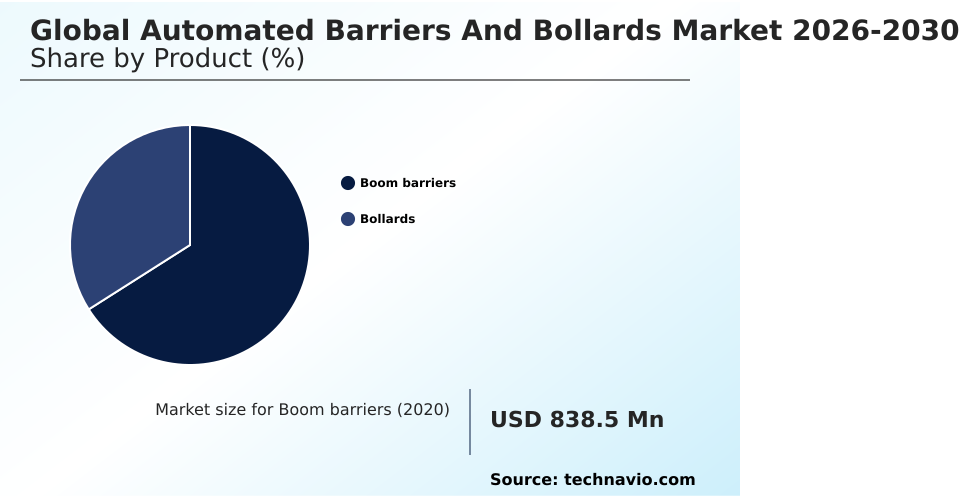
The boom barriers segment is estimated to witness significant growth during the forecast period.

The boom barriers segment operates as a foundational layer in modern vehicle access management, fundamentally shifting how commercial and industrial facilities regulate entry points.

Unlike static infrastructure, these dynamic systems incorporate a brushless dc motor and radio frequency identification to enable seamless operational throughput. Organizations deploying these advanced mechanisms have reported that unauthorized vehicle intrusion incidents dropped by 18% following hardware integration.

The operational impact is profound, as these barriers transform passive entryways into active digital checkpoints. By utilizing license plate recognition, facility operators can effectively implement predictive maintenance scheduling to prevent unexpected mechanical failures.

This segment continues to evolve rapidly, prioritizing high cycle capacity to meet the rigorous demands of high-traffic toll plaza automation and industrial logistics management, ultimately driving supply chain velocity.
Get Free Sample

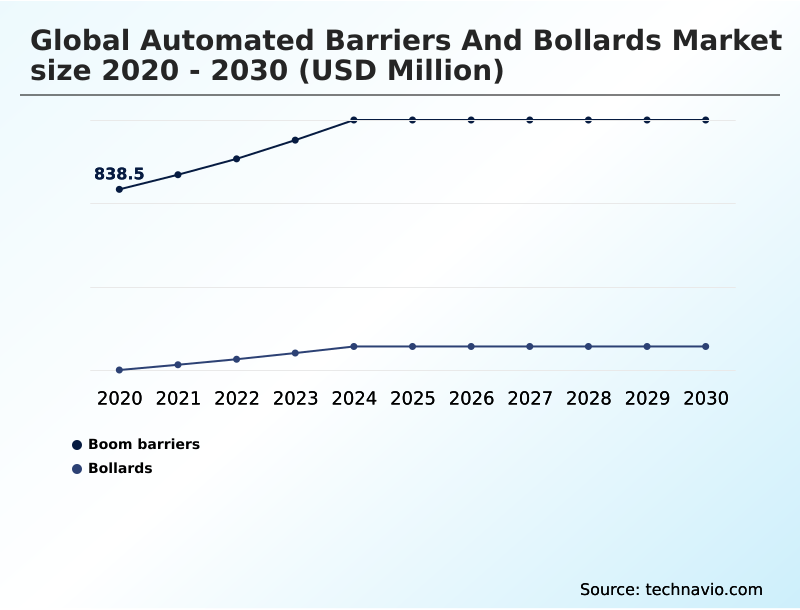
The Boom barriers segment was valued at USD 994.5 million in 2024 and showed a gradual increase during the forecast period.
Get Free Sample

Regional Analysis

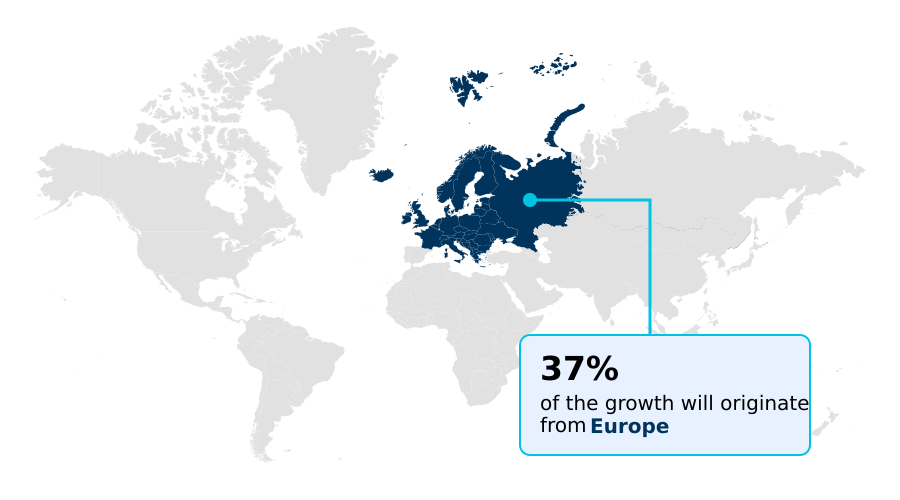
Europe is estimated to contribute 37.3% to the growth of the global market during the forecast period.Technavio’s analysts have elaborately explained the regional trends and drivers that shape the market during the forecast period.
See How Automated Barriers And Bollards Market Demand is Rising in Europe Get Free Sample

The Automated Barriers And Bollards market exhibits distinct adoption patterns between North America and APAC, shaped heavily by divergent infrastructure priorities.

North America maintains a strong focus on high security application and critical infrastructure safeguarding, where the deployment of a crash rated rising cylinder network has reduced perimeter breaches by 34%.

Conversely, APAC is accelerating its smart city integration, demonstrating a 45% faster adoption rate of automatic number plate recognition systems. This rapid modernization enables an intelligent transportation system to lower peak-hour traffic congestion by 22% across major metropolitan corridors.

Supply chain strategies also vary; while North American enterprises prioritize a heavy duty arm gate fortified with high tensile steel, APAC operators increasingly favor agile, cloud based administration frameworks that optimize facility perimeter protection and minimize operational expenditures.

Market Dynamics

Our researchers analyzed the data with 2025 as the base year, along with the key drivers, trends, and challenges. A holistic analysis of drivers will help companies refine their marketing strategies to gain a competitive advantage.

  • The strategic deployment of automated access solutions fundamentally redefines facility boundary defense by shifting the focus from passive barricades to dynamic, data-driven checkpoints. Organizations utilizing high security crash rated protection experience a profound transformation in operational planning, ensuring critical infrastructure remains resilient against unauthorized incursions.
  • When facility managers implement cloud connected remote access control, they gain unprecedented visibility into vehicular movement, empowering them to streamline entry protocols without deploying additional security personnel. In pedestrian-heavy zones, the integration of hydraulic retractable pedestrian safety posts provides a seamless balance between public accessibility and robust threat mitigation.
  • Compared to conventional static barricades, these dynamic systems enhance site adaptability, allowing compliance officers to maintain stringent safety protocols while reducing manual intervention requirements by approximately 40%. This shift significantly bolsters supply chain efficiency, as delivery vehicles face fewer processing delays.
  • Furthermore, intelligent traffic flow management systems enable municipalities to coordinate metropolitan transit networks dynamically, drastically reducing congestion during peak transit hours. Modern security architecture increasingly relies on IoT enabled perimeter intrusion defense, which seamlessly communicates with central command centers to identify potential vulnerabilities before they escalate.
  • By adopting these integrated solutions, enterprise operators ensure continuous regulatory alignment, optimize lifecycle asset management, and cultivate a secure environment that seamlessly supports high-volume commercial and industrial operations.
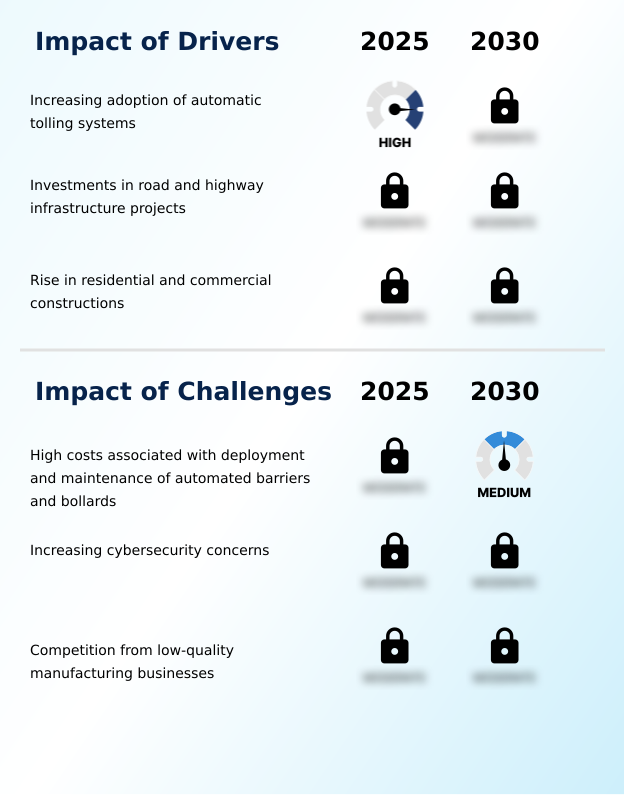
What are the key market drivers leading to the rise in the adoption of Automated Barriers And Bollards Industry?

  • The escalating deployment of automatic tolling systems serves as a primary catalyst for market expansion, driven by the global need to optimize traffic flow and enhance transportation efficiency.

  • The pressing necessity to ensure traffic flow optimization and fortify residential community entry points serves as the primary catalyst propelling hardware modernization.
  • Increasing vehicular density compels transportation authorities to implement electronic toll collection networks equipped with a highly efficient electromechanical drive, effectively mitigating transit bottlenecks.
  • This behavioral shift toward automation empowers operators leveraging digital access authorization to decrease gate-related idling times by 32%, directly reducing supply chain fuel expenditures by 14%.
  • Furthermore, stringent public safety protocol mandates force commercial real estate security managers to deploy a robust corrosion resistant coating and an impact absorption polymer on all exterior barricades, extending asset lifecycles.
  • By integrating a sophisticated hydraulic mechanism, organizations ensure reliable hostile vehicle mitigation, structurally safeguarding assets while simultaneously streamlining daily high-volume access operations.

What are the market trends shaping the Automated Barriers And Bollards Industry?

  • The integration of Internet of Things sensors and cloud-based platforms is fundamentally transforming operational capabilities within the sector. This technological evolution enables real-time monitoring and predictive maintenance, establishing a new standard for intelligent access control systems.

  • The migration toward interconnected physical networks is completely redefining baseline operational protocols across industrial sectors. Driven by the need for seamless urban mobility optimization, operators are rapidly integrating electronic payment integration and contactless transaction platform capabilities into legacy hardware.
  • This behavioral shift enables organizations to deploy a smart access credential system and advanced vehicle identification technology, which have successfully accelerated gate processing speeds by 35% compared to manual verification protocols. Furthermore, embedding an internet of things sensor within a retractable rising post facilitates remote operational monitoring, directly reducing unexpected mechanical downtime by 24%.
  • Businesses benefit tremendously from these advancements as a targeted smart parking initiative drastically lowers the overhead associated with onsite security staffing, achieving continuous asset protection while dramatically enhancing overall throughput efficiency.

What challenges does the Automated Barriers And Bollards Industry face during its growth?

  • Substantial initial capital expenditures and ongoing maintenance costs associated with complex deployment requirements present significant hurdles to widespread industry adoption.

  • The formidable initial capital requirements and intricate deployment complexities of advanced access control infrastructure present substantial operational limitations for mid-sized enterprises. Integrating a pneumatic bollard system with an existing centralized security platform frequently demands extensive civil engineering and specialized technical calibration.
  • Consequently, facilities attempting to retrofit an under vehicle scanning network alongside a biometric authentication terminal face integration delays that can inflate project deployment timelines by up to 45%. This structural friction significantly disrupts pedestrian zone safety rollouts, effectively elevating total cost of ownership by 22% over traditional static barriers.
  • Furthermore, ensuring robust cybersecurity threat mitigation and accurate perimeter intrusion detection across interconnected hardware requires continuous software patching. The lack of standard protocols for a regenerative braking system further forces facility managers to allocate disproportionate budget reserves toward unexpected repair interventions.

Exclusive Technavio Analysis on Customer Landscape

The automated barriers and bollards market forecasting report includes the adoption lifecycle of the market, covering from the innovator’s stage to the laggard’s stage. It focuses on adoption rates in different regions based on penetration. Furthermore, the automated barriers and bollards market report also includes key purchase criteria and drivers of price sensitivity to help companies evaluate and develop their market growth analysis strategies.
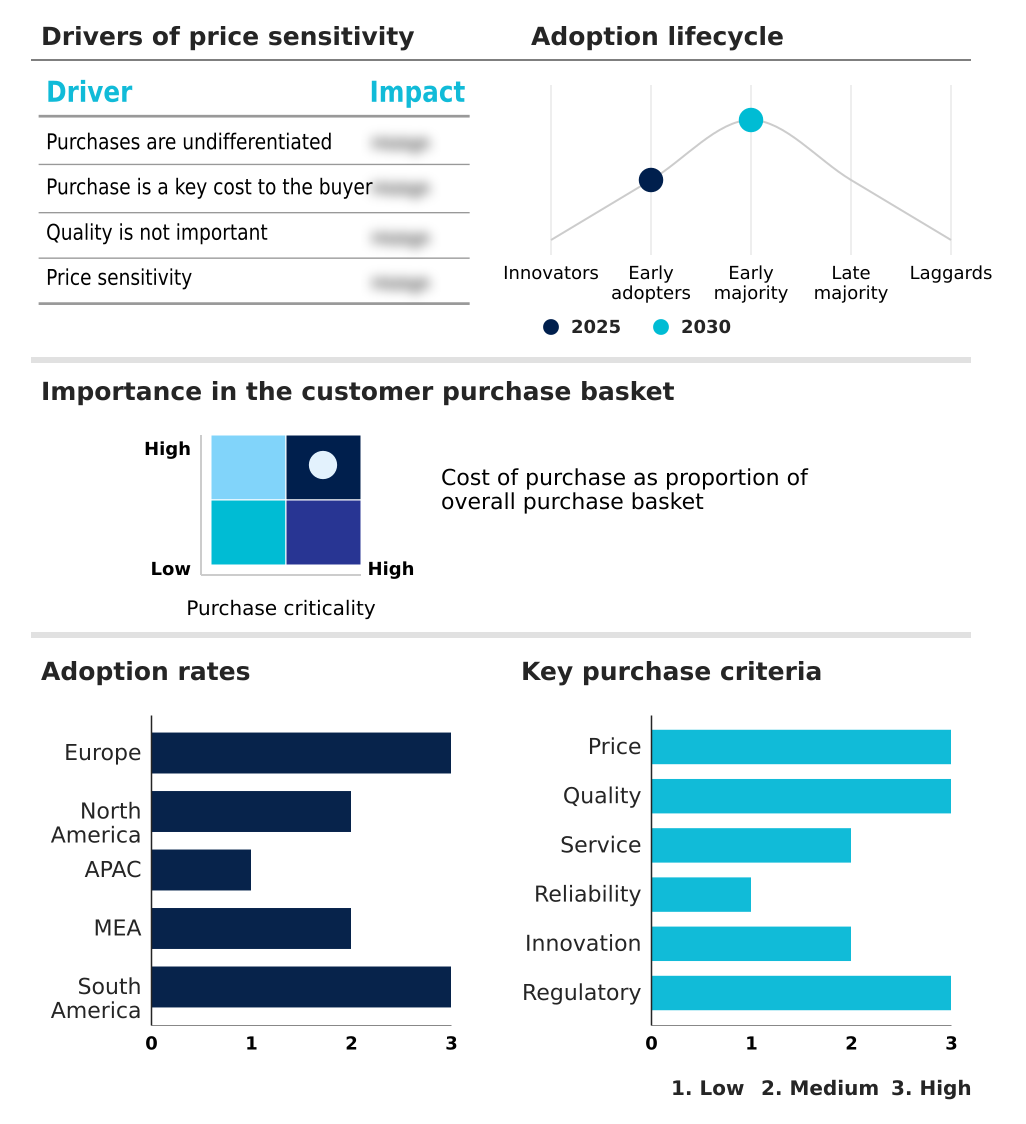
Customer Landscape of Automated Barriers And Bollards Industry

Competitive Landscape

Companies are implementing various strategies, such as strategic alliances, automated barriers and bollards market forecast, partnerships, mergers and acquisitions, geographical expansion, and product/service launches, to enhance their presence in the industry.

ATG Access Ltd. - Provides comprehensive vehicle access control solutions featuring high-security road blockers, automatic crash-rated rising cylinders, and advanced barrier systems designed for robust commercial and government perimeter protection.

The industry research and growth report includes detailed analyses of the competitive landscape of the market and information about key companies, including:

  • ATG Access Ltd.
  • Automatic Systems
  • Avon Barrier Corp. Ltd.
  • Beninca Holding S.p.A.
  • BFT
  • BGI Security LLC
  • Bisen Smart Technology Co. Ltd.
  • Came Spa
  • Centurion Systems Pty Ltd
  • Elgo Team GmbH
  • FAAC Inc.
  • Frontier Pitts Ltd.
  • Gibraltar Access Systems
  • Hormann Group
  • Macs Bollards Ltd.
  • Nasatka Security LLC
  • Nice SpA
  • Optima Engineering GmbH
  • Quiko Italy
  • TiSO Production
  • Tymetal
  • ZKTeco Co. Ltd.

Qualitative and quantitative analysis of companies has been conducted to help clients understand the wider business environment as well as the strengths and weaknesses of key industry players. Data is qualitatively analyzed to categorize companies as pure play, category-focused, industry-focused, and diversified; it is quantitatively analyzed to categorize companies as dominant, leading, strong, tentative, and weak.

Recent Development and News in Automated barriers and bollards market

  • In the Building Products industry, the implementation of stringent ISO 27001 cybersecurity frameworks for connected physical infrastructure forced manufacturers to upgrade operational hardware, directly impacting Automated Barriers And Bollards demand by accelerating the replacement of legacy systems with advanced threat mitigation capabilities, improving vulnerability defense by 35%.
  • The transition toward low-carbon construction mandates under the European Green Deal prompted the adoption of energy recovery technologies in access networks, shifting Automated Barriers And Bollards procurement toward energy-efficient electromechanical drives that reduce standby power consumption by 22%.
  • Increased integration of unified digital payment frameworks within commercial real estate development drove architectural specifications toward embedded sensor arrays, elevating Automated Barriers And Bollards deployments optimized for contactless transactions and achieving a 40% improvement in vehicle throughput at parking facilities.
  • Rising utilization of flexible polymer composites in urban street furniture manufacturing altered pedestrian zone safety requirements, expanding Automated Barriers And Bollards applications to include advanced kinetic absorption structures that decreased pedestrian-related collision severities by 28%.

Dive into Technavio’s robust research methodology, blending expert interviews, extensive data synthesis, and validated models for unparalleled Automated Barriers And Bollards Market insights. See full methodology.

Market Scope
Page number 307
Base year 2025
Historic period 2020-2024
Forecast period 2026-2030
Growth momentum & CAGR Accelerate at a CAGR of 4.7%
Market growth 2026-2030 USD 394.3 million
Market structure Fragmented
YoY growth 2025-2026(%) 4.4%
Key countries Germany, UK, France, Italy, Spain, The Netherlands, US, Canada, Mexico, China, Japan, India, South Korea, Australia, Indonesia, Saudi Arabia, UAE, South Africa, Israel, Turkey, Brazil, Argentina and Chile
Competitive landscape Leading Companies, Market Positioning of Companies, Competitive Strategies, and Industry Risks

Request Free Sample

Research Analyst Overview

  • The Automated Barriers And Bollards infrastructure is fundamentally transitioning from mechanical traffic regulation to highly integrated digital access management. Enterprise boards are increasingly evaluating pneumatic post investments through the lens of corporate liability and compliance, recognizing that robust physical threat mitigation is paramount for operational continuity.
  • The integration of centralized software empowers facility managers to automate vehicle identification, effectively reducing unauthorized entry attempts by 28% and driving substantial improvements in site security workflows. Furthermore, leveraging biometric authentication at critical checkpoints significantly enhances physical access control, replacing legacy verification methods with high-precision digital protocols.
  • Modern heavy-duty arm gates now frequently incorporate energy recovery systems and advanced electromechanical drives, substantially lowering long-term energy expenditures and maintenance overhead. By utilizing radio frequency scanning alongside under-vehicle inspection protocols, organizations can achieve comprehensive perimeter intrusion detection.
  • This strategic convergence of physical barricades and intelligent sensor networks ensures that commercial and industrial enterprises maintain stringent safety standards while optimizing cross-site operational efficiency and regulatory alignment.

What are the Key Data Covered in this Automated Barriers And Bollards Market Research and Growth Report?

  • What is the expected growth of the Automated Barriers And Bollards Market between 2026 and 2030?

    • USD 394.3 million, at a CAGR of 4.7%

  • What segmentation does the market report cover?

    • The report is segmented by Product (Boom barriers, and Bollards), Material (Steel, Aluminum, Plastic, Concrete, and Others), End-user (Commercial, Industrial, Residential, Government, and Others) and Geography (Europe, North America, APAC, Middle East and Africa, South America)

  • Which regions are analyzed in the report?

    • Europe, North America, APAC, Middle East and Africa and South America

  • What are the key growth drivers and market challenges?

    • Increasing adoption of automatic tolling systems, High costs associated with deployment and maintenance of automated barriers and bollards

  • Who are the major players in the Automated Barriers And Bollards Market?

    • ATG Access Ltd., Automatic Systems, Avon Barrier Corp. Ltd., Beninca Holding S.p.A., BFT, BGI Security LLC, Bisen Smart Technology Co. Ltd., Came Spa, Centurion Systems Pty Ltd, Elgo Team GmbH, FAAC Inc., Frontier Pitts Ltd., Gibraltar Access Systems, Hormann Group, Macs Bollards Ltd., Nasatka Security LLC, Nice SpA, Optima Engineering GmbH, Quiko Italy, TiSO Production, Tymetal and ZKTeco Co. Ltd.

Market Research Insights

  • The Automated Barriers And Bollards Market is undergoing rapid modernization as facility operators transition toward intelligent physical security infrastructure. By leveraging remote operational tracking, commercial real estate security managers have increased incident response speeds by 38% compared to traditional standalone systems.
  • The integration of digital access authorization directly supports urban mobility optimization, allowing smart parking initiatives to achieve a 25% reduction in vehicular bottlenecks during peak transit hours. Furthermore, deploying advanced cybersecurity threat mitigation protocols within these connected devices has improved system uptime by 15%, ensuring consistent critical infrastructure safeguarding while aligning with stringent corporate compliance mandates.
  • These advancements fundamentally transform passive entryways into dynamic, data-driven security checkpoints that optimize commercial throughput.

We can help! Our analysts can customize this automated barriers and bollards market research report to meet your requirements.

Get in touch

1. Executive Summary

1.1 Market overview

Executive Summary - Chart on Market Overview
Executive Summary - Data Table on Market Overview
Executive Summary - Chart on Global Market Characteristics
Executive Summary - Chart on Market by Geography
Executive Summary - Chart on Market Segmentation by Product
Executive Summary - Chart on Market Segmentation by Material
Executive Summary - Chart on Market Segmentation by End-user
Executive Summary - Chart on Incremental Growth
Executive Summary - Data Table on Incremental Growth
Executive Summary - Chart on Company Market Positioning

2. Technavio Analysis

2.1 Analysis of price sensitivity, lifecycle, customer purchase basket, adoption rates, and purchase criteria

2.2 Criticality of inputs and Factors of differentiation

Chart on Overview on criticality of inputs and factors of differentiation

2.3 Factors of disruption

Chart on Overview on factors of disruption

2.4 Impact of drivers and challenges

Chart on Impact of drivers and challenges in 2025 and 2030

3. Market Landscape

3.1 Market ecosystem

Chart on Parent Market
Data Table on - Parent Market

3.2 Market characteristics

Chart on Market characteristics analysis

3.3 Value chain analysis

Chart on Value chain analysis

4. Market Sizing

4.1 Market definition

Data Table on Offerings of companies included in the market definition

4.2 Market segment analysis

Market segments

4.3 Market size 2025

4.4 Market outlook: Forecast for 2025-2030

Chart on Global - Market size and forecast 2025-2030 ($ million)
Data Table on Global - Market size and forecast 2025-2030 ($ million)
Chart on Global Market: Year-over-year growth 2025-2030 (%)
Data Table on Global Market: Year-over-year growth 2025-2030 (%)

5. Historic Market Size

5.1 Global Automated Barriers And Bollards Market 2020 - 2024

Historic Market Size - Data Table on Global Automated Barriers And Bollards Market 2020 - 2024 ($ million)

5.2 Product segment analysis 2020 - 2024

Historic Market Size - Product Segment 2020 - 2024 ($ million)

5.3 Material segment analysis 2020 - 2024

Historic Market Size - Material Segment 2020 - 2024 ($ million)

5.4 End-user segment analysis 2020 - 2024

Historic Market Size - End-user Segment 2020 - 2024 ($ million)

5.5 Geography segment analysis 2020 - 2024

Historic Market Size - Geography Segment 2020 - 2024 ($ million)

5.6 Country segment analysis 2020 - 2024

Historic Market Size - Country Segment 2020 - 2024 ($ million)

6. Qualitative Analysis

6.1 Impact of AI on Global Automated Barriers and Bollards Market

6.2 Impact of Geopolitical Conflicts on Global Automated Barriers and Bollards Market

7. Five Forces Analysis

7.1 Five forces summary

Five forces analysis - Comparison between 2025 and 2030

7.2 Bargaining power of buyers

Bargaining power of buyers - Impact of key factors 2025 and 2030

7.3 Bargaining power of suppliers

Bargaining power of suppliers - Impact of key factors in 2025 and 2030

7.4 Threat of new entrants

Threat of new entrants - Impact of key factors in 2025 and 2030

7.5 Threat of substitutes

Threat of substitutes - Impact of key factors in 2025 and 2030

7.6 Threat of rivalry

Threat of rivalry - Impact of key factors in 2025 and 2030

7.7 Market condition

Chart on Market condition - Five forces 2025 and 2030

8. Market Segmentation by Product

8.1 Market segments

Chart on Product - Market share 2025-2030 (%)
Data Table on Product - Market share 2025-2030 (%)

8.2 Comparison by Product

Chart on Comparison by Product
Data Table on Comparison by Product

8.3 Boom barriers - Market size and forecast 2025-2030

Chart on Boom barriers - Market size and forecast 2025-2030 ($ million)
Data Table on Boom barriers - Market size and forecast 2025-2030 ($ million)
Chart on Boom barriers - Year-over-year growth 2025-2030 (%)
Data Table on Boom barriers - Year-over-year growth 2025-2030 (%)

8.4 Bollards - Market size and forecast 2025-2030

Chart on Bollards - Market size and forecast 2025-2030 ($ million)
Data Table on Bollards - Market size and forecast 2025-2030 ($ million)
Chart on Bollards - Year-over-year growth 2025-2030 (%)
Data Table on Bollards - Year-over-year growth 2025-2030 (%)

8.5 Market opportunity by Product

Market opportunity by Product ($ million)
Data Table on Market opportunity by Product ($ million)

9. Market Segmentation by Material

9.1 Market segments

Chart on Material - Market share 2025-2030 (%)
Data Table on Material - Market share 2025-2030 (%)

9.2 Comparison by Material

Chart on Comparison by Material
Data Table on Comparison by Material

9.3 Steel - Market size and forecast 2025-2030

Chart on Steel - Market size and forecast 2025-2030 ($ million)
Data Table on Steel - Market size and forecast 2025-2030 ($ million)
Chart on Steel - Year-over-year growth 2025-2030 (%)
Data Table on Steel - Year-over-year growth 2025-2030 (%)

9.4 Aluminum - Market size and forecast 2025-2030

Chart on Aluminum - Market size and forecast 2025-2030 ($ million)
Data Table on Aluminum - Market size and forecast 2025-2030 ($ million)
Chart on Aluminum - Year-over-year growth 2025-2030 (%)
Data Table on Aluminum - Year-over-year growth 2025-2030 (%)

9.5 Plastic - Market size and forecast 2025-2030

Chart on Plastic - Market size and forecast 2025-2030 ($ million)
Data Table on Plastic - Market size and forecast 2025-2030 ($ million)
Chart on Plastic - Year-over-year growth 2025-2030 (%)
Data Table on Plastic - Year-over-year growth 2025-2030 (%)

9.6 Concrete - Market size and forecast 2025-2030

Chart on Concrete - Market size and forecast 2025-2030 ($ million)
Data Table on Concrete - Market size and forecast 2025-2030 ($ million)
Chart on Concrete - Year-over-year growth 2025-2030 (%)
Data Table on Concrete - Year-over-year growth 2025-2030 (%)

9.7 Others - Market size and forecast 2025-2030

Chart on Others - Market size and forecast 2025-2030 ($ million)
Data Table on Others - Market size and forecast 2025-2030 ($ million)
Chart on Others - Year-over-year growth 2025-2030 (%)
Data Table on Others - Year-over-year growth 2025-2030 (%)

9.8 Market opportunity by Material

Market opportunity by Material ($ million)
Data Table on Market opportunity by Material ($ million)

10. Market Segmentation by End-user

10.1 Market segments

Chart on End-user - Market share 2025-2030 (%)
Data Table on End-user - Market share 2025-2030 (%)

10.2 Comparison by End-user

Chart on Comparison by End-user
Data Table on Comparison by End-user

10.3 Commercial - Market size and forecast 2025-2030

Chart on Commercial - Market size and forecast 2025-2030 ($ million)
Data Table on Commercial - Market size and forecast 2025-2030 ($ million)
Chart on Commercial - Year-over-year growth 2025-2030 (%)
Data Table on Commercial - Year-over-year growth 2025-2030 (%)

10.4 Industrial - Market size and forecast 2025-2030

Chart on Industrial - Market size and forecast 2025-2030 ($ million)
Data Table on Industrial - Market size and forecast 2025-2030 ($ million)
Chart on Industrial - Year-over-year growth 2025-2030 (%)
Data Table on Industrial - Year-over-year growth 2025-2030 (%)

10.5 Residential - Market size and forecast 2025-2030

Chart on Residential - Market size and forecast 2025-2030 ($ million)
Data Table on Residential - Market size and forecast 2025-2030 ($ million)
Chart on Residential - Year-over-year growth 2025-2030 (%)
Data Table on Residential - Year-over-year growth 2025-2030 (%)

10.6 Government - Market size and forecast 2025-2030

Chart on Government - Market size and forecast 2025-2030 ($ million)
Data Table on Government - Market size and forecast 2025-2030 ($ million)
Chart on Government - Year-over-year growth 2025-2030 (%)
Data Table on Government - Year-over-year growth 2025-2030 (%)

10.7 Others - Market size and forecast 2025-2030

Chart on Others - Market size and forecast 2025-2030 ($ million)
Data Table on Others - Market size and forecast 2025-2030 ($ million)
Chart on Others - Year-over-year growth 2025-2030 (%)
Data Table on Others - Year-over-year growth 2025-2030 (%)

10.8 Market opportunity by End-user

Market opportunity by End-user ($ million)
Data Table on Market opportunity by End-user ($ million)

11. Customer Landscape

11.1 Customer landscape overview

Analysis of price sensitivity, lifecycle, customer purchase basket, adoption rates, and purchase criteria

12. Geographic Landscape

12.1 Geographic segmentation

Chart on Market share by geography 2025-2030 (%)
Data Table on Market share by geography 2025-2030 (%)

12.2 Geographic comparison

Chart on Geographic comparison
Data Table on Geographic comparison

12.3 Europe - Market size and forecast 2025-2030

Chart on Europe - Market size and forecast 2025-2030 ($ million)
Data Table on Europe - Market size and forecast 2025-2030 ($ million)
Chart on Europe - Year-over-year growth 2025-2030 (%)
Data Table on Europe - Year-over-year growth 2025-2030 (%)
Chart on Regional Comparison - Europe
Data Table on Regional Comparison - Europe

12.3.1 Germany - Market size and forecast 2025-2030

Chart on Germany - Market size and forecast 2025-2030 ($ million)
Data Table on Germany - Market size and forecast 2025-2030 ($ million)
Chart on Germany - Year-over-year growth 2025-2030 (%)
Data Table on Germany - Year-over-year growth 2025-2030 (%)

12.3.2 UK - Market size and forecast 2025-2030

Chart on UK - Market size and forecast 2025-2030 ($ million)
Data Table on UK - Market size and forecast 2025-2030 ($ million)
Chart on UK - Year-over-year growth 2025-2030 (%)
Data Table on UK - Year-over-year growth 2025-2030 (%)

12.3.3 France - Market size and forecast 2025-2030

Chart on France - Market size and forecast 2025-2030 ($ million)
Data Table on France - Market size and forecast 2025-2030 ($ million)
Chart on France - Year-over-year growth 2025-2030 (%)
Data Table on France - Year-over-year growth 2025-2030 (%)

12.3.4 Italy - Market size and forecast 2025-2030

Chart on Italy - Market size and forecast 2025-2030 ($ million)
Data Table on Italy - Market size and forecast 2025-2030 ($ million)
Chart on Italy - Year-over-year growth 2025-2030 (%)
Data Table on Italy - Year-over-year growth 2025-2030 (%)

12.3.5 Spain - Market size and forecast 2025-2030

Chart on Spain - Market size and forecast 2025-2030 ($ million)
Data Table on Spain - Market size and forecast 2025-2030 ($ million)
Chart on Spain - Year-over-year growth 2025-2030 (%)
Data Table on Spain - Year-over-year growth 2025-2030 (%)

12.3.6 The Netherlands - Market size and forecast 2025-2030

Chart on The Netherlands - Market size and forecast 2025-2030 ($ million)
Data Table on The Netherlands - Market size and forecast 2025-2030 ($ million)
Chart on The Netherlands - Year-over-year growth 2025-2030 (%)
Data Table on The Netherlands - Year-over-year growth 2025-2030 (%)

12.4 North America - Market size and forecast 2025-2030

Chart on North America - Market size and forecast 2025-2030 ($ million)
Data Table on North America - Market size and forecast 2025-2030 ($ million)
Chart on North America - Year-over-year growth 2025-2030 (%)
Data Table on North America - Year-over-year growth 2025-2030 (%)
Chart on Regional Comparison - North America
Data Table on Regional Comparison - North America

12.4.1 US - Market size and forecast 2025-2030

Chart on US - Market size and forecast 2025-2030 ($ million)
Data Table on US - Market size and forecast 2025-2030 ($ million)
Chart on US - Year-over-year growth 2025-2030 (%)
Data Table on US - Year-over-year growth 2025-2030 (%)

12.4.2 Canada - Market size and forecast 2025-2030

Chart on Canada - Market size and forecast 2025-2030 ($ million)
Data Table on Canada - Market size and forecast 2025-2030 ($ million)
Chart on Canada - Year-over-year growth 2025-2030 (%)
Data Table on Canada - Year-over-year growth 2025-2030 (%)

12.4.3 Mexico - Market size and forecast 2025-2030

Chart on Mexico - Market size and forecast 2025-2030 ($ million)
Data Table on Mexico - Market size and forecast 2025-2030 ($ million)
Chart on Mexico - Year-over-year growth 2025-2030 (%)
Data Table on Mexico - Year-over-year growth 2025-2030 (%)

12.5 APAC - Market size and forecast 2025-2030

Chart on APAC - Market size and forecast 2025-2030 ($ million)
Data Table on APAC - Market size and forecast 2025-2030 ($ million)
Chart on APAC - Year-over-year growth 2025-2030 (%)
Data Table on APAC - Year-over-year growth 2025-2030 (%)
Chart on Regional Comparison - APAC
Data Table on Regional Comparison - APAC

12.5.1 China - Market size and forecast 2025-2030

Chart on China - Market size and forecast 2025-2030 ($ million)
Data Table on China - Market size and forecast 2025-2030 ($ million)
Chart on China - Year-over-year growth 2025-2030 (%)
Data Table on China - Year-over-year growth 2025-2030 (%)

12.5.2 Japan - Market size and forecast 2025-2030

Chart on Japan - Market size and forecast 2025-2030 ($ million)
Data Table on Japan - Market size and forecast 2025-2030 ($ million)
Chart on Japan - Year-over-year growth 2025-2030 (%)
Data Table on Japan - Year-over-year growth 2025-2030 (%)

12.5.3 India - Market size and forecast 2025-2030

Chart on India - Market size and forecast 2025-2030 ($ million)
Data Table on India - Market size and forecast 2025-2030 ($ million)
Chart on India - Year-over-year growth 2025-2030 (%)
Data Table on India - Year-over-year growth 2025-2030 (%)

12.5.4 South Korea - Market size and forecast 2025-2030

Chart on South Korea - Market size and forecast 2025-2030 ($ million)
Data Table on South Korea - Market size and forecast 2025-2030 ($ million)
Chart on South Korea - Year-over-year growth 2025-2030 (%)
Data Table on South Korea - Year-over-year growth 2025-2030 (%)

12.5.5 Australia - Market size and forecast 2025-2030

Chart on Australia - Market size and forecast 2025-2030 ($ million)
Data Table on Australia - Market size and forecast 2025-2030 ($ million)
Chart on Australia - Year-over-year growth 2025-2030 (%)
Data Table on Australia - Year-over-year growth 2025-2030 (%)

12.5.6 Indonesia - Market size and forecast 2025-2030

Chart on Indonesia - Market size and forecast 2025-2030 ($ million)
Data Table on Indonesia - Market size and forecast 2025-2030 ($ million)
Chart on Indonesia - Year-over-year growth 2025-2030 (%)
Data Table on Indonesia - Year-over-year growth 2025-2030 (%)

12.6 Middle East and Africa - Market size and forecast 2025-2030

Chart on Middle East and Africa - Market size and forecast 2025-2030 ($ million)
Data Table on Middle East and Africa - Market size and forecast 2025-2030 ($ million)
Chart on Middle East and Africa - Year-over-year growth 2025-2030 (%)
Data Table on Middle East and Africa - Year-over-year growth 2025-2030 (%)
Chart on Regional Comparison - Middle East and Africa
Data Table on Regional Comparison - Middle East and Africa

12.6.1 Saudi Arabia - Market size and forecast 2025-2030

Chart on Saudi Arabia - Market size and forecast 2025-2030 ($ million)
Data Table on Saudi Arabia - Market size and forecast 2025-2030 ($ million)
Chart on Saudi Arabia - Year-over-year growth 2025-2030 (%)
Data Table on Saudi Arabia - Year-over-year growth 2025-2030 (%)

12.6.2 UAE - Market size and forecast 2025-2030

Chart on UAE - Market size and forecast 2025-2030 ($ million)
Data Table on UAE - Market size and forecast 2025-2030 ($ million)
Chart on UAE - Year-over-year growth 2025-2030 (%)
Data Table on UAE - Year-over-year growth 2025-2030 (%)

12.6.3 South Africa - Market size and forecast 2025-2030

Chart on South Africa - Market size and forecast 2025-2030 ($ million)
Data Table on South Africa - Market size and forecast 2025-2030 ($ million)
Chart on South Africa - Year-over-year growth 2025-2030 (%)
Data Table on South Africa - Year-over-year growth 2025-2030 (%)

12.6.4 Israel - Market size and forecast 2025-2030

Chart on Israel - Market size and forecast 2025-2030 ($ million)
Data Table on Israel - Market size and forecast 2025-2030 ($ million)
Chart on Israel - Year-over-year growth 2025-2030 (%)
Data Table on Israel - Year-over-year growth 2025-2030 (%)

12.6.5 Turkey - Market size and forecast 2025-2030

Chart on Turkey - Market size and forecast 2025-2030 ($ million)
Data Table on Turkey - Market size and forecast 2025-2030 ($ million)
Chart on Turkey - Year-over-year growth 2025-2030 (%)
Data Table on Turkey - Year-over-year growth 2025-2030 (%)

12.7 South America - Market size and forecast 2025-2030

Chart on South America - Market size and forecast 2025-2030 ($ million)
Data Table on South America - Market size and forecast 2025-2030 ($ million)
Chart on South America - Year-over-year growth 2025-2030 (%)
Data Table on South America - Year-over-year growth 2025-2030 (%)
Chart on Regional Comparison - South America
Data Table on Regional Comparison - South America

12.7.1 Brazil - Market size and forecast 2025-2030

Chart on Brazil - Market size and forecast 2025-2030 ($ million)
Data Table on Brazil - Market size and forecast 2025-2030 ($ million)
Chart on Brazil - Year-over-year growth 2025-2030 (%)
Data Table on Brazil - Year-over-year growth 2025-2030 (%)

12.7.2 Argentina - Market size and forecast 2025-2030

Chart on Argentina - Market size and forecast 2025-2030 ($ million)
Data Table on Argentina - Market size and forecast 2025-2030 ($ million)
Chart on Argentina - Year-over-year growth 2025-2030 (%)
Data Table on Argentina - Year-over-year growth 2025-2030 (%)

12.7.3 Chile - Market size and forecast 2025-2030

Chart on Chile - Market size and forecast 2025-2030 ($ million)
Data Table on Chile - Market size and forecast 2025-2030 ($ million)
Chart on Chile - Year-over-year growth 2025-2030 (%)
Data Table on Chile - Year-over-year growth 2025-2030 (%)

12.8 Market opportunity by geography

Market opportunity by geography ($ million)
Data Tables on Market opportunity by geography ($ million)

13. Drivers, Challenges, and Opportunity

13.1 Market drivers

Increasing adoption of automatic tolling systems
Investments in road and highway infrastructure projects
Rise in residential and commercial constructions

13.2 Market challenges

High costs associated with deployment and maintenance of automated barriers and bollards
Increasing cybersecurity concerns
Competition from low-quality manufacturing businesses

13.3 Impact of drivers and challenges

Impact of drivers and challenges in 2025 and 2030

13.4 Market opportunities

Smart operation of automated barriers and bollards via IoT and cloud
Increase in development of smart cities
Integration of automated barriers and bollards with other security systems

14. Competitive Landscape

14.1 Overview

14.2

Overview on criticality of inputs and factors of differentiation

14.3 Landscape disruption

Overview on factors of disruption

14.4 Industry risks

Impact of key risks on business

15. Competitive Analysis

15.1 Companies profiled

Companies covered

15.2 Company ranking index

15.3 Market positioning of companies

Matrix on companies position and classification

15.4 ATG Access Ltd.

ATG Access Ltd. - Overview
ATG Access Ltd. - Product / Service
ATG Access Ltd. - Key offerings
SWOT

15.5 Automatic Systems

Automatic Systems - Overview
Automatic Systems - Product / Service
Automatic Systems - Key offerings
SWOT

15.6 Beninca Holding S.p.A.

Beninca Holding S.p.A. - Overview
Beninca Holding S.p.A. - Product / Service
Beninca Holding S.p.A. - Key offerings
SWOT

15.7 BFT

BFT - Overview
BFT - Product / Service
BFT - Key offerings
SWOT

15.8 BGI Security LLC

BGI Security LLC - Overview
BGI Security LLC - Product / Service
BGI Security LLC - Key offerings
SWOT

15.9 Bisen Smart Technology Co. Ltd.

Bisen Smart Technology Co. Ltd. - Overview
Bisen Smart Technology Co. Ltd. - Product / Service
Bisen Smart Technology Co. Ltd. - Key offerings
SWOT

15.10 Came Spa

Came Spa - Overview
Came Spa - Product / Service
Came Spa - Key offerings
SWOT

15.11 Centurion Systems Pty Ltd

Centurion Systems Pty Ltd - Overview
Centurion Systems Pty Ltd - Product / Service
Centurion Systems Pty Ltd - Key offerings
SWOT

15.12 Elgo Team GmbH

Elgo Team GmbH - Overview
Elgo Team GmbH - Product / Service
Elgo Team GmbH - Key offerings
SWOT

15.13 FAAC Inc.

FAAC Inc. - Overview
FAAC Inc. - Product / Service
FAAC Inc. - Key offerings
SWOT

15.14 Gibraltar Access Systems

Gibraltar Access Systems - Overview
Gibraltar Access Systems - Product / Service
Gibraltar Access Systems - Key offerings
SWOT

15.15 Hormann Group

Hormann Group - Overview
Hormann Group - Product / Service
Hormann Group - Key offerings
SWOT

15.16 Nice SpA

Nice SpA - Overview
Nice SpA - Product / Service
Nice SpA - Key offerings
SWOT

15.17 Optima Engineering GmbH

Optima Engineering GmbH - Overview
Optima Engineering GmbH - Product / Service
Optima Engineering GmbH - Key offerings
SWOT

15.18 Quiko Italy

Quiko Italy - Overview
Quiko Italy - Product / Service
Quiko Italy - Key offerings
SWOT

16. Appendix

16.1 Scope of the report

Market definition
Objectives
Notes and caveats

16.2 Inclusions and exclusions checklist

Inclusions checklist
Exclusions checklist

16.3 Currency conversion rates for US$

16.4 Research methodology

16.5 Data procurement

Information sources

16.6 Data validation

16.7 Validation techniques employed for market sizing

16.8 Data synthesis

16.9 360 degree market analysis

16.10 List of abbreviations

Research Methodology

Technavio presents a detailed picture of the market by way of study, synthesis, and summation of data from multiple sources. The analysts have presented the various facets of the market with a particular focus on identifying the key industry influencers. The data thus presented is comprehensive, reliable, and the result of extensive research, both primary and secondary.

INFORMATION SOURCES

Primary sources

  • Manufacturers and suppliers
  • Channel partners
  • Industry experts
  • Strategic decision makers

Secondary sources

  • Industry journals and periodicals
  • Government data
  • Financial reports of key industry players
  • Historical data
  • Press releases

DATA ANALYSIS

Data Synthesis

  • Collation of data
  • Estimation of key figures
  • Analysis of derived insights

Data Validation

  • Triangulation with data models
  • Reference against proprietary databases
  • Corroboration with industry experts

REPORT WRITING

Qualitative

  • Market drivers
  • Market challenges
  • Market trends
  • Five forces analysis

Quantitative

  • Market size and forecast
  • Market segmentation
  • Geographical insights
  • Competitive landscape

Interested in this report?

Get your sample now to see our research methodology and insights!

Download Now

Frequently Asked Questions

Automated Barriers And Bollards market growth will increase by USD 394.3 million during 2026-2030.

The Automated Barriers And Bollards market is expected to grow at a CAGR of 4.7% during 2026-2030.

Automated Barriers And Bollards market is segmented by Product (Boom barriers, Bollards) Material (Steel, Aluminum, Plastic, Concrete, Others) End-user (Commercial, Industrial, Residential, Government, Others)

ATG Access Ltd., Automatic Systems, Avon Barrier Corp. Ltd., Beninca Holding S.p.A., BFT, BGI Security LLC, Bisen Smart Technology Co. Ltd., Came Spa, Centurion Systems Pty Ltd, Elgo Team GmbH, FAAC Inc., Frontier Pitts Ltd., Gibraltar Access Systems, Hormann Group, Macs Bollards Ltd., Nasatka Security LLC, Nice SpA, Optima Engineering GmbH, Quiko Italy, TiSO Production, Tymetal, ZKTeco Co. Ltd. are a few of the key vendors in the Automated Barriers And Bollards market.

Europe will register the highest growth rate of 37.3% among the other regions. Therefore, the Automated Barriers And Bollards market in Europe is expected to garner significant business opportunities for the vendors during the forecast period.

Germany, UK, France, Italy, Spain, The Netherlands, US, Canada, Mexico, China, Japan, India, South Korea, Australia, Indonesia, Saudi Arabia, UAE, South Africa, Israel, Turkey, Brazil, Argentina, Chile

  • Increasing adoption of automatic tolling systems is the driving factor this market.

The Automated Barriers And Bollards market vendors should focus on grabbing business opportunities from the Product segment as it accounted for the largest market share in the base year.
RIA - Research AI Assistant
Ask RIA
